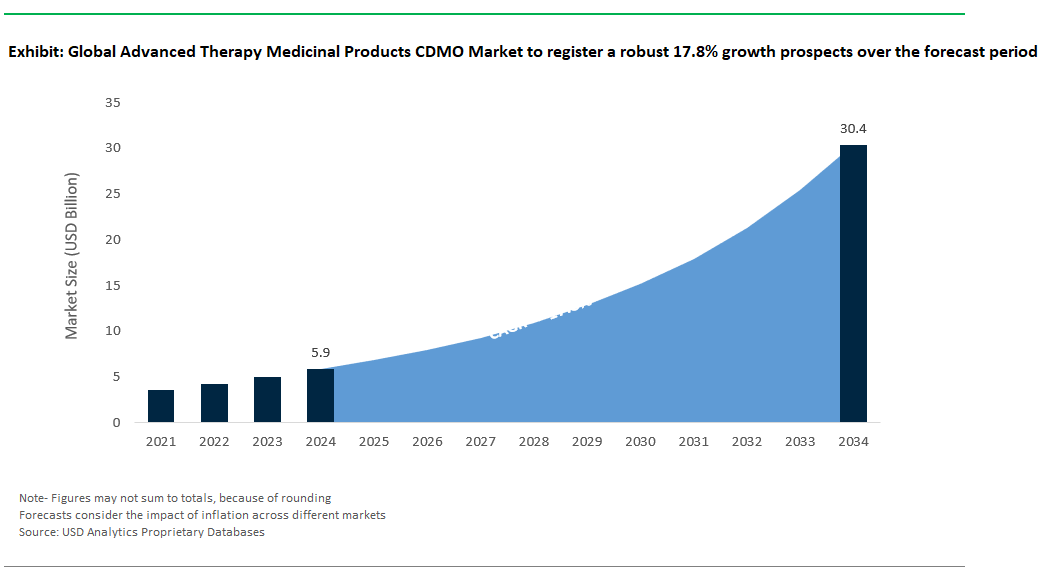
Global Advanced Therapy Medicinal Products CDMO Market Size is valued at $5.9 Billion in 2024 and is forecast to register a growth rate (CAGR) of 17.8% to reach $30.4 Billion by 2034.
The global Advanced Therapy Medicinal Products CDMO Market study analyzes and forecasts the market size across 6 regions and 24 countries for diverse segments including- By Product (Gene Therapy, Cell Therapy, Tissue Engineered, Others), By Phase (Phase I, Phase II, Phase III, Phase IV), By Indication (Oncology, Cardiology, Central nervous system, Musculoskeletal, Infectious disease, Dermatology, Endocrine, metabolic, genetic, Immunology & inflammation, Ophthalmology, Hematology, Gastroenterology, Others)
Advanced Therapy Medicinal Products CDMO Market Overview
The increasing prevalence of chronic diseases, coupled with a growing demand for personalized and targeted therapies are stimulating the need for innovative and advanced medicinal products. ATMPs, including gene therapies, cell therapies, and tissue-engineered products are offering promising treatment avenues for various challenging medical conditions, driving the market's expansion. Companies are seeking CDMOs capable of adapting manufacturing processes to various stages of ATMP development, accommodating small-scale clinical trials to large-scale commercial production. Additionally, CDMOs are continuing to invest in cutting-edge technologies and automation to optimize ATMP manufacturing processes. Additionally, advancements in biotechnology and manufacturing processes are enhancing the efficiency and scalability of ATMP production, attracting both pharmaceutical companies and specialized CDMOs to invest in this burgeoning field.
Advanced Therapy Medicinal Products CDMO Market Competitive Landscape
The market report analyses the leading companies in the industry including AGC Biologics, Bio Elpida, BlueReg, Catalent, Celonic, CGT Catapult, Lonza, Minaris Regenerative Medicine, Patheon, Rentschler Biopharma SE, WuXi Advanced Therapies, and Others.
Advanced Therapy Medicinal Products CDMO Market Dynamics
Advanced Therapy Medicinal Products CDMO Market Trends- The Advanced Therapy Medicinal Products CDMO market showcases a strategic focus on technology advancements and automation
The industry's pursuit of streamlining and enhancing manufacturing processes for ATMPs, such as gene therapies and cell-based treatments are fueling the market.
CDMOs are increasingly investing in cutting-edge technologies and automation solutions to optimize production efficiency, reduce costs, and ensure consistent product quality.
Additionally, Automation integration, encompassing robotics and digitalization are facilitating precise and standardized manufacturing processes, enhancing scalability and minimizing human error.
Advanced Therapy Medicinal Products CDMO Market Driver- The Advanced Therapy Medicinal Products CDMO market experiences heightened demand for specialized expertise and advanced manufacturing capabilities
The increasing complexity of ATMPs, including gene therapies, cell therapies, and tissue-engineered products, necessitates specialized knowledge and technical proficiency for their development and production.
Additionally, rising investments and research activities in innovative therapies, intensifies the need for CDMOs equipped with scalable facilities and adaptable manufacturing processes to accommodate diverse developmental stages, driving the market.
Further, the regulatory landscape governing ATMPs requires stringent compliance and quality assurance measures, compelling companies to seek CDMOs with expertise in navigating these regulatory complexities.
Advanced Therapy Medicinal Products CDMO Market Opportunity- The ATMP CDMO market experiences a surge in clinical trials and a broadened therapeutic pipeline
The escalating number of clinical trials and the subsequent expansion of the therapeutic pipeline are rapidly increasing the market.
The growing investment in research and development initiatives aiming at innovative therapies, including gene and cell therapies are fueling the demand.
Additionally, the pharmaceutical and biotech sectors are witnessing a surge in clinical trial activities for ATMPs due to their potential in addressing unmet medical needs and providing personalized treatment options.
Advanced Therapy Medicinal Products CDMO Market Share Analysis- Cell Therapy is poised to register the fastest growth rate (CAGR) over the forecast period from 2025 to 2034.
The Advanced Therapy Medicinal Products CDMO market is analyzed across Gene Therapy, Cell Therapy, Tissue Engineered and Others. Cell Therapy is poised to register the fastest growth. It involves therapeutic treatments that harness the potential of cells—typically stem cells or immune cells—to address various diseases and conditions. These therapies hold immense promise in treating cancers, genetic disorders, autoimmune diseases, and regenerative medicine applications. In the CDMO landscape, cell therapy manufacturing involves intricate processes, including cell sourcing, expansion, modification, and quality control, necessitating specialized expertise and advanced infrastructure. CDMOs catering to cell therapy manufacturing offer a spectrum of services, encompassing process development, manufacturing, and analytical capabilities tailored to the unique requirements of cell-based therapies. As the cell therapy field continues to advance and gain regulatory approvals, the demand for specialized CDMO services supporting these innovative treatments is on the rise.
Advanced Therapy Medicinal Products CDMO Market Share Analysis- Phase I held a significant market share in 2024
The Advanced Therapy Medicinal Products CDMO market is analyzed across various phases including Phase I, Phase II, Phase III and Phase IV. Of these, Phase I held a significant market share in 2024. Phase I clinical trials serve as the initial step in evaluating the safety and tolerability of new ATMPs in a small group of human subjects. These trials aim to determine the therapy's safety profile, dosage range, potential side effects, and pharmacokinetics. CDMOs involved in Phase I trials provide essential support in process development and manufacturing services tailored to the specific requirements of these early-stage therapies. They assist in producing limited quantities of ATMPs following stringent regulatory guidelines, focusing on ensuring product safety and quality. CDMOs contribute expertise in areas such as cell line development, process optimization, and analytical method validation to enable the successful progression of these therapies through the initial clinical trial phases. As Phase I trials lay the foundation for subsequent clinical evaluations and product development stages, CDMOs play a crucial role in supporting the ATMP market's advancement by facilitating the safe and controlled production of these pioneering therapies.
Advanced Therapy Medicinal Products CDMO Market News
Charles River Unveils Expansion of Cell Therapy Manufacturing Capacity, Bolstering Dedication to CDMO Clientele.
Yposkesi launches Project SKY to Establish its Second Commercial Bioproduction Facility
Advanced Therapy Medicinal Products CDMO Market Report Scope
|
Parameter
|
Details
|
|
Market Size (2024)
|
$5.9 Billion
|
|
Market Size (2034)
|
$30.4 Billion
|
|
Market Growth Rate
|
17.8%
|
|
Segments
|
By Product (Gene Therapy, Cell Therapy, Tissue Engineered, Others), By Phase (Phase I, Phase II, Phase III, Phase IV), By Indication (Oncology, Cardiology, Central nervous system, Musculoskeletal, Infectious disease, Dermatology, Endocrine, metabolic, genetic, Immunology & inflammation, Ophthalmology, Hematology, Gastroenterology, Others)
|
|
Study Period
|
2019- 2024 and 2025-2034
|
|
Units
|
Revenue (USD)
|
|
Qualitative Analysis
|
Porter’s Five Forces, SWOT Profile, Market Share, Scenario Forecasts, Market Ecosystem, Company Ranking, Market Dynamics, Industry Benchmarking
|
|
Companies
|
AGC Biologics, Bio Elpida, BlueReg, Catalent, Celonic, CGT Catapult, Lonza, Minaris Regenerative Medicine, Patheon, Rentschler Biopharma SE, WuXi Advanced Therapies, and Others.
|
|
Countries
|
US, Canada, Mexico, Germany, France, Spain, Italy, UK, Russia, China, India, Japan, South Korea, Australia, South East Asia, Brazil, Argentina, Middle East, Africa
|
Advanced Therapy Medicinal Products CDMO Market Segmentation
By Product
- Gene Therapy
- Cell Therapy
- Tissue Engineered
- Others
By Phase
- Phase I
- Phase II
- Phase III
- Phase IV
By Indication
- Oncology
- Cardiology
- Central nervous system
- Musculoskeletal
- Infectious disease
- Dermatology
- Endocrine, metabolic, genetic
- Immunology & inflammation
- Ophthalmology
- Hematology
- Gastroenterology
- Others
By Region
- North America (United States, Canada, Mexico)
- Europe (Germany, France, United Kingdom, Spain, Italy, Others)
- Asia Pacific (China, India, Japan, South Korea, Australia, Others)
- Latin America (Brazil, Argentina, Others)
- Middle East and Africa (Saudi Arabia, UAE, Kuwait, Other Middle East, South Africa, Nigeria, Other Africa)
Advanced Therapy Medicinal Products CDMO market Companies
- AGC Biologics
- Bio Elpida
- BlueReg
- Catalent
- Celonic
- CGT Catapult
- Lonza
- Minaris Regenerative Medicine
- Patheon
- Rentschler Biopharma SE
- WuXi Advanced Therapies
*List not exhaustive
Advanced Therapy Medicinal Products CDMO Market Outlook 2023
1 Market Overview
1.1 Introduction to the Advanced Therapy Medicinal Products CDMO Market
1.2 Scope of the Study
1.3 Research Objective
1.3.1 Key Market Scope and Segments
1.3.2 Players Covered
1.3.3 Years Considered
2 Executive Summary
2.1 2023 Advanced Therapy Medicinal Products CDMO Industry- Market Statistics
3 Market Dynamics
3.1 Market Drivers
3.2 Market Challenges
3.3 Market Opportunities
3.4 Market Trends
4 Market Factor Analysis
4.1 Porter’s Five Forces
4.2 Market Entropy
4.2.1 Global Advanced Therapy Medicinal Products CDMO Market Companies with Area Served
4.2.2 Products Offerings Global Advanced Therapy Medicinal Products CDMO Market
5 COVID-19 Impact Analysis and Outlook Scenarios
5.1.1 Covid-19 Impact Analysis
5.1.2 post-COVID-19 Scenario- Low Growth Case
5.1.3 Post-COVID-19 Scenario- Reference Growth Case
5.1.4 Post-COVID-19 Scenario- Low Growth Case
6 Global Advanced Therapy Medicinal Products CDMO Market Trends
6.1 Global Advanced Therapy Medicinal Products CDMO Revenue (USD Million) and CAGR (%) by Type (2018-2030)
6.2 Global Advanced Therapy Medicinal Products CDMO Revenue (USD Million) and CAGR (%) by Applications (2018-2030)
6.3 Global Advanced Therapy Medicinal Products CDMO Revenue (USD Million) and CAGR (%) by Regions (2018-2030)
7 Global Advanced Therapy Medicinal Products CDMO Market Revenue (USD Million) by Type, and Applications (2018-2022)
7.1 Global Advanced Therapy Medicinal Products CDMO Revenue (USD Million) by Type (2018-2022)
7.1.1 Global Advanced Therapy Medicinal Products CDMO Revenue (USD Million), Market Share (%) by Type (2018-2022)
7.2 Global Advanced Therapy Medicinal Products CDMO Revenue (USD Million) by Applications (2018-2022)
7.2.1 Global Advanced Therapy Medicinal Products CDMO Revenue (USD Million), Market Share (%) by Applications (2018-2022)
8 Global Advanced Therapy Medicinal Products CDMO Development Regional Status and Outlook
8.1 Global Advanced Therapy Medicinal Products CDMO Revenue (USD Million) By Regions (2018-2022)
8.2 North America Advanced Therapy Medicinal Products CDMO Revenue (USD Million) by Type, and Application (2018-2022)
8.2.1 North America Advanced Therapy Medicinal Products CDMO Revenue (USD Million) by Country (2018-2022)
8.2.2 North America Advanced Therapy Medicinal Products CDMO Revenue (USD Million) by Type (2018-2022)
8.2.3 North America Advanced Therapy Medicinal Products CDMO Revenue (USD Million) by Applications (2018-2022)
8.3 Europe Advanced Therapy Medicinal Products CDMO Revenue (USD Million), by Type, and Applications (USD Million) (2018-2022)
8.3.1 Europe Advanced Therapy Medicinal Products CDMO Revenue (USD Million), by Country (2018-2022)
8.3.2 Europe Advanced Therapy Medicinal Products CDMO Revenue (USD Million) by Type (2018-2022)
8.3.3 Europe Advanced Therapy Medicinal Products CDMO Revenue (USD Million) by Applications (2018-2022)
8.4 Asia Pacific Advanced Therapy Medicinal Products CDMO Revenue (USD Million), and Revenue (USD Million) by Type, and Applications (2018-2022)
8.4.1 Asia Pacific Advanced Therapy Medicinal Products CDMO Revenue (USD Million) by Country (2018-2022)
8.4.2 Asia Pacific Advanced Therapy Medicinal Products CDMO Revenue (USD Million) by Type (2018-2022)
8.4.3 Asia Pacific Advanced Therapy Medicinal Products CDMO Revenue (USD Million) by Applications (2018-2022)
8.5 South America Advanced Therapy Medicinal Products CDMO Revenue (USD Million), by Type, and Applications (2018-2022)
8.5.1 South America Advanced Therapy Medicinal Products CDMO Revenue (USD Million), by Country (2018-2022)
8.5.2 South America Advanced Therapy Medicinal Products CDMO Revenue (USD Million) by Type (2018-2022)
8.5.3 South America Advanced Therapy Medicinal Products CDMO Revenue (USD Million) by Applications (2018-2022)
8.6 Middle East and Africa Advanced Therapy Medicinal Products CDMO Revenue (USD Million), by Type, Technology, Application, Thickness (2018-2022)
8.6.1 Middle East and Africa Advanced Therapy Medicinal Products CDMO Revenue (USD Million) by Country (2018-2022)
8.6.2 Middle East and Africa Advanced Therapy Medicinal Products CDMO Revenue (USD Million) by Type (2018-2022)
8.6.3 Middle East and Africa Advanced Therapy Medicinal Products CDMO Revenue (USD Million) by Applications (2018-2022)
9 Company Profiles
10 Global Advanced Therapy Medicinal Products CDMO Market Revenue (USD Million), by Type, and Applications (2023-2030)
10.1 Global Advanced Therapy Medicinal Products CDMO Revenue (USD Million) and Market Share (%) by Type (2023-2030)
10.1.1 Global Advanced Therapy Medicinal Products CDMO Revenue (USD Million), and Market Share (%) by Type (2023-2030)
10.2 Global Advanced Therapy Medicinal Products CDMO Revenue (USD Million) and Market Share (%) by Applications (2023-2030)
10.2.1 Global Advanced Therapy Medicinal Products CDMO Revenue (USD Million), and Market Share (%) by Applications (2023-2030)
11 Global Advanced Therapy Medicinal Products CDMO Development Regional Status and Outlook Forecast
11.1 Global Advanced Therapy Medicinal Products CDMO Revenue (USD Million) By Regions (2023-2030)
11.2 North America Advanced Therapy Medicinal Products CDMO Revenue (USD Million) by Type, and Applications (2023-2030)
11.2.1 North America Advanced Therapy Medicinal Products CDMO Revenue (USD) Million by Country (2023-2030)
11.2.2 North America Advanced Therapy Medicinal Products CDMO Revenue (USD Million), by Type (2023-2030)
11.2.3 North America Advanced Therapy Medicinal Products CDMO Revenue (USD Million), Market Share (%) by Applications (2023-2030)
11.3 Europe Advanced Therapy Medicinal Products CDMO Revenue (USD Million), by Type, and Applications (2023-2030)
11.3.1 Europe Advanced Therapy Medicinal Products CDMO Revenue (USD Million), by Country (2023-2030)
11.3.2 Europe Advanced Therapy Medicinal Products CDMO Revenue (USD Million), by Type (2023-2030)
11.3.3 Europe Advanced Therapy Medicinal Products CDMO Revenue (USD Million), by Applications (2023-2030)
11.4 Asia Pacific Advanced Therapy Medicinal Products CDMO Revenue (USD Million) by Type, and Applications (2023-2030)
11.4.1 Asia Pacific Advanced Therapy Medicinal Products CDMO Revenue (USD Million), by Country (2023-2030)
11.4.2 Asia Pacific Advanced Therapy Medicinal Products CDMO Revenue (USD Million), by Type (2023-2030)
11.4.3 Asia Pacific Advanced Therapy Medicinal Products CDMO Revenue (USD Million), by Applications (2023-2030)
11.5 South America Advanced Therapy Medicinal Products CDMO Revenue (USD Million), by Type, and Applications (2023-2030)
11.5.1 South America Advanced Therapy Medicinal Products CDMO Revenue (USD Million), by Country (2023-2030)
11.5.2 South America Advanced Therapy Medicinal Products CDMO Revenue (USD Million), by Type (2023-2030)
11.5.3 South America Advanced Therapy Medicinal Products CDMO Revenue (USD Million), by Applications (2023-2030)
11.6 Middle East and Africa Advanced Therapy Medicinal Products CDMO Revenue (USD Million), by Type, and Applications (2023-2030)
11.6.1 Middle East and Africa Advanced Therapy Medicinal Products CDMO Revenue (USD Million), by Region (2023-2030)
11.6.2 Middle East and Africa Advanced Therapy Medicinal Products CDMO Revenue (USD Million), by Type (2023-2030)
11.6.3 Middle East and Africa Advanced Therapy Medicinal Products CDMO Revenue (USD Million), by Applications (2023-2030)
12 Methodology and Data Sources
12.1 Methodology/Research Approach
12.1.1 Research Programs/Design
12.1.2 Market Size Estimation
12.1.3 Market Breakdown and Data Triangulation
12.2 Data Sources
12.2.1 Secondary Sources
12.2.2 Primary Sources
12.3 Disclaimer
List of Tables
Table 1 Market Segmentation Analysis
Table 2 Global Advanced Therapy Medicinal Products CDMO Market Companies with Areas Served
Table 3 Products Offerings Global Advanced Therapy Medicinal Products CDMO Market
Table 4 Low Growth Scenario Forecasts
Table 5 Reference Case Growth Scenario
Table 6 High Growth Case Scenario
Table 7 Global Advanced Therapy Medicinal Products CDMO Revenue (USD Million) And CAGR (%) By Type (2018-2030)
Table 8 Global Advanced Therapy Medicinal Products CDMO Revenue (USD Million) And CAGR (%) By Applications (2018-2030)
Table 9 Global Advanced Therapy Medicinal Products CDMO Revenue (USD Million) And CAGR (%) By Regions (2018-2030)
Table 10 Global Advanced Therapy Medicinal Products CDMO Revenue (USD Million) By Type (2018-2022)
Table 11 Global Advanced Therapy Medicinal Products CDMO Revenue Market Share (%) By Type (2018-2022)
Table 12 Global Advanced Therapy Medicinal Products CDMO Revenue (USD Million) By Applications (2018-2022)
Table 13 Global Advanced Therapy Medicinal Products CDMO Revenue Market Share (%) By Applications (2018-2022)
Table 14 Global Advanced Therapy Medicinal Products CDMO Market Revenue (USD Million) By Regions (2018-2022)
Table 15 Global Advanced Therapy Medicinal Products CDMO Market Share (%) By Regions (2018-2022)
Table 16 North America Advanced Therapy Medicinal Products CDMO Revenue (USD Million) By Country (2018-2022)
Table 17 North America Advanced Therapy Medicinal Products CDMO Revenue (USD Million) By Type (2018-2022)
Table 18 North America Advanced Therapy Medicinal Products CDMO Revenue (USD Million) By Applications (2018-2022)
Table 19 Europe Advanced Therapy Medicinal Products CDMO Revenue (USD Million) By Country (2018-2022)
Table 20 Europe Advanced Therapy Medicinal Products CDMO Revenue (USD Million) By Type (2018-2022)
Table 21 Europe Advanced Therapy Medicinal Products CDMO Revenue (USD Million) By Applications (2018-2022)
Table 22 Asia Pacific Advanced Therapy Medicinal Products CDMO Revenue (USD Million) By Country (2018-2022)
Table 23 Asia Pacific Advanced Therapy Medicinal Products CDMO Revenue (USD Million) By Type (2018-2022)
Table 24 Asia Pacific Advanced Therapy Medicinal Products CDMO Revenue (USD Million) By Applications (2018-2022)
Table 25 South America Advanced Therapy Medicinal Products CDMO Revenue (USD Million) By Country (2018-2022)
Table 26 South America Advanced Therapy Medicinal Products CDMO Revenue (USD Million) By Type (2018-2022)
Table 27 South America Advanced Therapy Medicinal Products CDMO Revenue (USD Million) By Applications (2018-2022)
Table 28 Middle East and Africa Advanced Therapy Medicinal Products CDMO Revenue (USD Million) By Region (2018-2022)
Table 29 Middle East and Africa Advanced Therapy Medicinal Products CDMO Revenue (USD Million) By Type (2018-2022)
Table 30 Middle East and Africa Advanced Therapy Medicinal Products CDMO Revenue (USD Million) By Applications (2018-2022)
Table 31 Financial Analysis
Table 32 Global Advanced Therapy Medicinal Products CDMO Revenue (USD Million) By Type (2023-2030)
Table 33 Global Advanced Therapy Medicinal Products CDMO Revenue Market Share (%) By Type (2023-2030)
Table 34 Global Advanced Therapy Medicinal Products CDMO Revenue (USD Million) By Applications (2023-2030)
Table 35 Global Advanced Therapy Medicinal Products CDMO Revenue Market Share (%) By Applications (2023-2030)
Table 36 Global Advanced Therapy Medicinal Products CDMO Market Revenue (USD Million), And Revenue (USD Million) By Regions (2023-2030)
Table 37 North America Advanced Therapy Medicinal Products CDMO Revenue (USD)By Country (2023-2030)
Table 38 North America Advanced Therapy Medicinal Products CDMO Revenue (USD Million) By Type (2023-2030)
Table 39 North America Advanced Therapy Medicinal Products CDMO Revenue (USD Million) By Applications (2023-2030)
Table 40 Europe Advanced Therapy Medicinal Products CDMO Revenue (USD Million) By Country (2023-2030)
Table 41 Europe Advanced Therapy Medicinal Products CDMO Revenue (USD Million) By Type (2023-2030)
Table 42 Europe Advanced Therapy Medicinal Products CDMO Revenue (USD Million) By Applications (2023-2030)
Table 43 Asia Pacific Advanced Therapy Medicinal Products CDMO Revenue (USD Million) By Country (2023-2030)
Table 44 Asia Pacific Advanced Therapy Medicinal Products CDMO Revenue (USD Million) By Type (2023-2030)
Table 45 Asia Pacific Advanced Therapy Medicinal Products CDMO Revenue (USD Million) By Applications (2023-2030)
Table 46 South America Advanced Therapy Medicinal Products CDMO Revenue (USD Million) By Country (2023-2030)
Table 47 South America Advanced Therapy Medicinal Products CDMO Revenue (USD Million) By Type (2023-2030)
Table 48 South America Advanced Therapy Medicinal Products CDMO Revenue (USD Million) By Applications (2023-2030)
Table 49 Middle East and Africa Advanced Therapy Medicinal Products CDMO Revenue (USD Million) By Region (2023-2030)
Table 50 Middle East and Africa Advanced Therapy Medicinal Products CDMO Revenue (USD Million) By Region (2023-2030)
Table 51 Middle East and Africa Advanced Therapy Medicinal Products CDMO Revenue (USD Million) By Type (2023-2030)
Table 52 Middle East and Africa Advanced Therapy Medicinal Products CDMO Revenue (USD Million) By Applications (2023-2030)
Table 53 Research Programs/Design for This Report
Table 54 Key Data Information from Secondary Sources
Table 55 Key Data Information from Primary Sources
List of Figures
Figure 1 Market Scope
Figure 2 Porter’s Five Forces
Figure 3 Global Advanced Therapy Medicinal Products CDMO Revenue (USD Million) By Type (2018-2022)
Figure 4 Global Advanced Therapy Medicinal Products CDMO Revenue Market Share (%) By Type (2022)
Figure 5 Global Advanced Therapy Medicinal Products CDMO Revenue (USD Million) By Applications (2018-2022)
Figure 6 Global Advanced Therapy Medicinal Products CDMO Revenue Market Share (%) By Applications (2022)
Figure 7 Global Advanced Therapy Medicinal Products CDMO Market Revenue (USD Million) By Regions (2018-2022)
Figure 8 Global Advanced Therapy Medicinal Products CDMO Market Share (%) By Regions (2022)
Figure 9 North America Advanced Therapy Medicinal Products CDMO Revenue (USD Million) By Country (2018-2022)
Figure 10 North America Advanced Therapy Medicinal Products CDMO Revenue (USD Million) By Type (2018-2022)
Figure 11 North America Advanced Therapy Medicinal Products CDMO Revenue (USD Million) By Applications (2018-2022)
Figure 12 Europe Advanced Therapy Medicinal Products CDMO Revenue (USD Million) By Country (2018-2022)
Figure 13 Europe Advanced Therapy Medicinal Products CDMO Revenue (USD Million) By Type (2018-2022)
Figure 14 Europe Advanced Therapy Medicinal Products CDMO Revenue (USD Million) By Applications (2018-2022)
Figure 15 Asia Pacific Advanced Therapy Medicinal Products CDMO Revenue (USD Million) By Country (2018-2022)
Figure 16 Asia Pacific Advanced Therapy Medicinal Products CDMO Revenue (USD Million) By Type (2018-2022)
Figure 17 Asia Pacific Advanced Therapy Medicinal Products CDMO Revenue (USD Million) By Applications (2018-2022)
Figure 18 South America Advanced Therapy Medicinal Products CDMO Revenue (USD Million) By Country (2018-2022)
Figure 19 South America Advanced Therapy Medicinal Products CDMO Revenue (USD Million) By Type (2018-2022)
Figure 20 South America Advanced Therapy Medicinal Products CDMO Revenue (USD Million) By Applications (2018-2022)
Figure 21 Middle East and Africa Advanced Therapy Medicinal Products CDMO Revenue (USD Million) By Region (2018-2022)
Figure 22 Middle East and Africa Advanced Therapy Medicinal Products CDMO Revenue (USD Million) By Type (2018-2022)
Figure 23 Middle East and Africa Advanced Therapy Medicinal Products CDMO Revenue (USD Million) By Applications (2018-2022)
Figure 24 Global Advanced Therapy Medicinal Products CDMO Revenue (USD Million) By Type (2023-2030)
Figure 25 Global Advanced Therapy Medicinal Products CDMO Revenue Market Share (%) By Type (2030)
Figure 26 Global Advanced Therapy Medicinal Products CDMO Revenue (USD Million) By Applications (2023-2030)
Figure 27 Global Advanced Therapy Medicinal Products CDMO Revenue Market Share (%) By Applications (2030)
Figure 28 Global Advanced Therapy Medicinal Products CDMO Market Revenue (USD Million) By Regions (2023-2030)
Figure 29 North America Advanced Therapy Medicinal Products CDMO Revenue (USD Million) By Country (2023-2030)
Figure 30 North America Advanced Therapy Medicinal Products CDMO Revenue (USD Million) By Type (2023-2030)
Figure 31 North America Advanced Therapy Medicinal Products CDMO Revenue (USD Million) By Applications (2023-2030)
Figure 32 Europe Advanced Therapy Medicinal Products CDMO Revenue (USD Million) By Country (2023-2030)
Figure 33 Europe Advanced Therapy Medicinal Products CDMO Revenue (USD Million) By Type (2023-2030)
Figure 34 Europe Advanced Therapy Medicinal Products CDMO Revenue (USD Million) By Applications (2023-2030)
Figure 35 Asia Pacific Advanced Therapy Medicinal Products CDMO Revenue (USD Million) By Country (2023-2030)
Figure 36 Asia Pacific Advanced Therapy Medicinal Products CDMO Revenue (USD Million) By Type (2023-2030)
Figure 37 Asia Pacific Advanced Therapy Medicinal Products CDMO Revenue (USD Million) By Applications (2023-2030)
Figure 38 South America Advanced Therapy Medicinal Products CDMO Revenue (USD Million) By Country (2023-2030)
Figure 39 South America Advanced Therapy Medicinal Products CDMO Revenue (USD Million) By Type (2023-2030)
Figure 40 South America Advanced Therapy Medicinal Products CDMO Revenue (USD Million) By Applications (2023-2030)
Figure 41 Middle East and Africa Advanced Therapy Medicinal Products CDMO Revenue (USD Million) By Region (2023-2030)
Figure 42 Middle East and Africa Advanced Therapy Medicinal Products CDMO Revenue (USD Million) By Region (2023-2030)
Figure 43 Middle East and Africa Advanced Therapy Medicinal Products CDMO Revenue (USD Million) By Type (2023-2030)
Figure 44 Middle East and Africa Advanced Therapy Medicinal Products CDMO Revenue (USD Million) By Applications (2023-2030)
Figure 45 Bottom-Up and Top-Down Approaches For This Report
Figure 46 Data Triangulation
