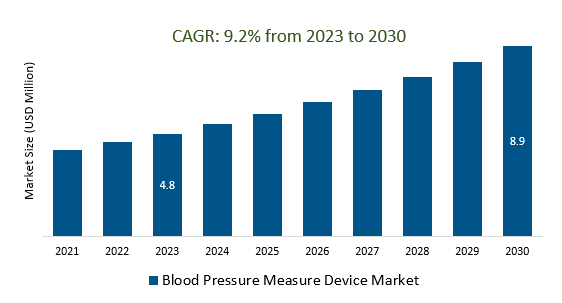
The Global Blood Pressure Measure Device Market Size is estimated to be US 4.8 Billion in 2023 and is poised to register 9.2% growth over the forecast period from 2023 to 2030 to reach US $ 8.9 billion in 2030.
The market growth is driven by the increasing awareness of the importance of monitoring blood pressure and maintaining cardiovascular health is driving consumer demand for these devices. Leading companies that are focused on Technological Advancements, Telemedicine and Remote Monitoring, Home Healthcare, Global Healthcare Initiatives, Data Integration and Health Records, and others to boost market shares in the industry.
Market Overview
The Blood Pressure Measurement Device Market is experiencing steady growth globally, driven by factors such as the rising prevalence of hypertension and cardiovascular diseases, the trend toward home blood pressure monitoring, the growth of telemedicine and remote monitoring, and continuous technological advancements. Key players in the market include Omron Healthcare, A&D Medical, Welch Allyn (now part of Hillrom), Philips Healthcare, and Nihon Kohden. Future prospects include the increased prominence of wearable and connected devices, global market expansion, and greater integration with healthcare systems and data analytics for improved patient management.
Market Dynamics
Market Trends - Home blood pressure monitoring is becoming increasingly popular due to its many benefits
Home blood pressure monitoring is increasingly popular due to its convenience, empowerment of individuals in managing their health, and the ability to provide a more comprehensive view of blood pressure patterns. This trend is driven by advancements in user-friendly and connected monitoring devices, enabling individuals to regularly track their blood pressure without the need for frequent clinic visits. The benefits include early detection of hypertension, personalized treatment plans, and improved cardiovascular health awareness. As technology continues to evolve, home blood pressure monitoring is poised to play an even more significant role in proactive healthcare management.
Market Driver- The demand for smart safes is increasing due to digitalization and data integration trends
The surge in the demand for smart safes is primarily fueled by the imperative for enhanced security in an increasingly digital world, where businesses and individuals alike seek to safeguard valuable assets and data. These safes offer advanced features such as biometric authentication and real-time monitoring, making them pivotal in protecting against theft and unauthorized access. Moreover, smart safes seamlessly integrate with digital systems like point-of-sale (POS) and inventory management software, optimizing cash-handling processes and reducing errors. Businesses benefit from real-time data tracking, allowing for improved financial management and compliance with regulatory requirements. The transition to digital payments is underway, but cash remains prevalent in many regions, and smart safes facilitate the secure management of cash assets during this transition.
Market Opportunity-Introduction of Increasing Prevalence of Hypertension
The increasing prevalence of hypertension, or high blood pressure, is a global health concern linked to unhealthy lifestyles, obesity, aging populations, stress, and genetics. It is a major risk factor for cardiovascular diseases. Addressing this issue requires public health efforts, lifestyle changes, regular blood pressure monitoring, and medical intervention as needed to mitigate the rising burden of hypertension-related health problems.
Market Share Analysis- Automated/Digital Blood Pressure Monitor Blood Pressure Measure Device Market will register the fastest growth
The Global Blood Pressure Measure Device Market is analyzed across Sphygmomanometer/Aneroid BP Monitors, Automated/Digital Blood Pressure Monitors, Ambulatory Blood Pressure Monitor, Transducers, Instruments and Accessories, and others. Automated/Digital Blood Pressure monitors are poised to register the fastest growth. The market for automated and digital blood pressure monitors has experienced substantial growth, driven by increasing awareness of hypertension, an aging population, and the demand for convenient home healthcare devices. These monitors offer accurate blood pressure measurements and come in various models with advanced features such as smartphone connectivity. With hypertension prevalence and remote patient monitoring on the rise, the market is expected to continue expanding in the healthcare sector.
Market Share Analysis- Homecare held a significant market share in 2023
The Global Blood Pressure Measure Device Market is analyzed across various End Users including Hospitals, Ambulatory Surgical Centers and clinics, home care, and others. Of these, Homecare held a significant market share in 2023. The homecare market for blood pressure measurement devices is on the rise due to the aging population, the prevalence of hypertension, and the convenience of home monitoring. These devices range from basic digital models to advanced ones with smartphone connectivity and data tracking features, making them essential for modern healthcare, especially in the context of remote patient monitoring and telehealth services.
Blood Pressure Measure Device Market Segmentation
By Type
- Sphygmomanometer/Aneroid BP Monitor
- Automated/Digital Blood Pressure Monitor
- Ambulatory Blood Pressure Monitor
- Transducers
- Instruments and Accessories
- Others
By End-User
- Hospitals
- Ambulatory Surgical Centers & Clinics
- Homecare
By Region
- North America (United States, Canada, Mexico)
- Europe (Germany, France, United Kingdom, Spain, Italy, Others)
- Asia Pacific (China, India, Japan, South Korea, Australia, Others)
- Latin America (Brazil, Argentina, Others)
- Middle East and Africa (Saudi Arabia, UAE, Kuwait, Other Middle East, South Africa, Nigeria, Other Africa)
Blood Pressure Measure Device Market Companies
- SunTech Medical Inc
- A&D Medical Inc.
- American Diagnostics Corp.
- Withings
- Omron Healthcare Welch Allyn Inc
- GE Healthcare
- Contec
- Microlife AG
- Rossmax International Ltd.
- GF Health Products Inc.
- Biobeat
- Spacelabs Healthcare Inc
- Philips Healthcare
- Braun Healthcare
- Kaz Inc
- Hill-Rom Services Inc
- Briggs Healthcare
*List not exhaustive
Blood Pressure Measure Device Market Outlook 2023
1 Market Overview
1.1 Introduction to the Blood Pressure Measure Device Market
1.2 Scope of the Study
1.3 Research Objective
1.3.1 Key Market Scope and Segments
1.3.2 Players Covered
1.3.3 Years Considered
2 Executive Summary
2.1 2023 Blood Pressure Measure Device Industry- Market Statistics
3 Market Dynamics
3.1 Market Drivers
3.2 Market Challenges
3.3 Market Opportunities
3.4 Market Trends
4 Market Factor Analysis
4.1 Porter’s Five Forces
4.2 Market Entropy
4.2.1 Global Blood Pressure Measure Device Market Companies with Area Served
4.2.2 Products Offerings Global Blood Pressure Measure Device Market
5 COVID-19 Impact Analysis and Outlook Scenarios
5.1.1 Covid-19 Impact Analysis
5.1.2 Post-COVID-19 Scenario- Low Growth Case
5.1.3 Post-COVID-19 Scenario- Reference Growth Case
5.1.4 Post-COVID-19 Scenario- Low Growth Case
6 Global Blood Pressure Measure Device Market Trends
6.1 Global Blood Pressure Measure Device Revenue (USD Million) and CAGR (%) by Type (2018-2030)
6.2 Global Blood Pressure Measure Device Revenue (USD Million) and CAGR (%) by Applications (2018-2030)
6.3 Global Blood Pressure Measure Device Revenue (USD Million) and CAGR (%) by Regions (2018-2030)
7 Global Blood Pressure Measure Device Market Revenue (USD Million) by Type, and Applications (2018-2022)
7.1 Global Blood Pressure Measure Device Revenue (USD Million) by Type (2018-2022)
7.1.1 Global Blood Pressure Measure Device Revenue (USD Million), Market Share (%) by Type (2018-2022)
7.2 Global Blood Pressure Measure Device Revenue (USD Million) by Applications (2018-2022)
7.2.1 Global Blood Pressure Measure Device Revenue (USD Million), Market Share (%) by Applications (2018-2022)
8 Global Blood Pressure Measure Device Development Regional Status and Outlook
8.1 Global Blood Pressure Measure Device Revenue (USD Million) By Regions (2018-2022)
8.2 North America Blood Pressure Measure Device Revenue (USD Million) by Type, and Application (2018-2022)
8.2.1 North America Blood Pressure Measure Device Revenue (USD Million) by Country (2018-2022)
8.2.2 North America Blood Pressure Measure Device Revenue (USD Million) by Type (2018-2022)
8.2.3 North America Blood Pressure Measure Device Revenue (USD Million) by Applications (2018-2022)
8.3 Europe Blood Pressure Measure Device Revenue (USD Million), by Type, and Applications (USD Million) (2018-2022)
8.3.1 Europe Blood Pressure Measure Device Revenue (USD Million), by Country (2018-2022)
8.3.2 Europe Blood Pressure Measure Device Revenue (USD Million) by Type (2018-2022)
8.3.3 Europe Blood Pressure Measure Device Revenue (USD Million) by Applications (2018-2022)
8.4 Asia Pacific Blood Pressure Measure Device Revenue (USD Million), and Revenue (USD Million) by Type, and Applications (2018-2022)
8.4.1 Asia Pacific Blood Pressure Measure Device Revenue (USD Million) by Country (2018-2022)
8.4.2 Asia Pacific Blood Pressure Measure Device Revenue (USD Million) by Type (2018-2022)
8.4.3 Asia Pacific Blood Pressure Measure Device Revenue (USD Million) by Applications (2018-2022)
8.5 South America Blood Pressure Measure Device Revenue (USD Million), by Type, and Applications (2018-2022)
8.5.1 South America Blood Pressure Measure Device Revenue (USD Million), by Country (2018-2022)
8.5.2 South America Blood Pressure Measure Device Revenue (USD Million) by Type (2018-2022)
8.5.3 South America Blood Pressure Measure Device Revenue (USD Million) by Applications (2018-2022)
8.6 Middle East and Africa Blood Pressure Measure Device Revenue (USD Million), by Type, Technology, Application, Thickness (2018-2022)
8.6.1 Middle East and Africa Blood Pressure Measure Device Revenue (USD Million) by Country (2018-2022)
8.6.2 Middle East and Africa Blood Pressure Measure Device Revenue (USD Million) by Type (2018-2022)
8.6.3 Middle East and Africa Blood Pressure Measure Device Revenue (USD Million) by Applications (2018-2022)
9 Company Profiles
10 Global Blood Pressure Measure Device Market Revenue (USD Million), by Type, and Applications (2023-2030)
10.1 Global Blood Pressure Measure Device Revenue (USD Million) and Market Share (%) by Type (2023-2030)
10.1.1 Global Blood Pressure Measure Device Revenue (USD Million), and Market Share (%) by Type (2023-2030)
10.2 Global Blood Pressure Measure Device Revenue (USD Million) and Market Share (%) by Applications (2023-2030)
10.2.1 Global Blood Pressure Measure Device Revenue (USD Million), and Market Share (%) by Applications (2023-2030)
11 Global Blood Pressure Measure Device Development Regional Status and Outlook Forecast
11.1 Global Blood Pressure Measure Device Revenue (USD Million) By Regions (2023-2030)
11.2 North America Blood Pressure Measure Device Revenue (USD Million) by Type, and Applications (2023-2030)
11.2.1 North America Blood Pressure Measure Device Revenue (USD) Million by Country (2023-2030)
11.2.2 North America Blood Pressure Measure Device Revenue (USD Million), by Type (2023-2030)
11.2.3 North America Blood Pressure Measure Device Revenue (USD Million), Market Share (%) by Applications (2023-2030)
11.3 Europe Blood Pressure Measure Device Revenue (USD Million), by Type, and Applications (2023-2030)
11.3.1 Europe Blood Pressure Measure Device Revenue (USD Million), by Country (2023-2030)
11.3.2 Europe Blood Pressure Measure Device Revenue (USD Million), by Type (2023-2030)
11.3.3 Europe Blood Pressure Measure Device Revenue (USD Million), by Applications (2023-2030)
11.4 Asia Pacific Blood Pressure Measure Device Revenue (USD Million) by Type, and Applications (2023-2030)
11.4.1 Asia Pacific Blood Pressure Measure Device Revenue (USD Million), by Country (2023-2030)
11.4.2 Asia Pacific Blood Pressure Measure Device Revenue (USD Million), by Type (2023-2030)
11.4.3 Asia Pacific Blood Pressure Measure Device Revenue (USD Million), by Applications (2023-2030)
11.5 South America Blood Pressure Measure Device Revenue (USD Million), by Type, and Applications (2023-2030)
11.5.1 South America Blood Pressure Measure Device Revenue (USD Million), by Country (2023-2030)
11.5.2 South America Blood Pressure Measure Device Revenue (USD Million), by Type (2023-2030)
11.5.3 South America Blood Pressure Measure Device Revenue (USD Million), by Applications (2023-2030)
11.6 Middle East and Africa Blood Pressure Measure Device Revenue (USD Million), by Type, and Applications (2023-2030)
11.6.1 Middle East and Africa Blood Pressure Measure Device Revenue (USD Million), by Region (2023-2030)
11.6.2 Middle East and Africa Blood Pressure Measure Device Revenue (USD Million), by Type (2023-2030)
11.6.3 Middle East and Africa Blood Pressure Measure Device Revenue (USD Million), by Applications (2023-2030)
12 Methodology and Data Sources
12.1 Methodology/Research Approach
12.1.1 Research Programs/Design
12.1.2 Market Size Estimation
12.1.3 Market Breakdown and Data Triangulation
12.2 Data Sources
12.2.1 Secondary Sources
12.2.2 Primary Sources
12.3 Disclaimer
List of Tables
Table 1 Market Segmentation Analysis
Table 2 Global Blood Pressure Measure Device Market Companies with Areas Served
Table 3 Products Offerings Global Blood Pressure Measure Device Market
Table 4 Low Growth Scenario Forecasts
Table 5 Reference Case Growth Scenario
Table 6 High Growth Case Scenario
Table 7 Global Blood Pressure Measure Device Revenue (USD Million) And CAGR (%) By Type (2018-2030)
Table 8 Global Blood Pressure Measure Device Revenue (USD Million) And CAGR (%) By Applications (2018-2030)
Table 9 Global Blood Pressure Measure Device Revenue (USD Million) And CAGR (%) By Regions (2018-2030)
Table 10 Global Blood Pressure Measure Device Revenue (USD Million) By Type (2018-2022)
Table 11 Global Blood Pressure Measure Device Revenue Market Share (%) By Type (2018-2022)
Table 12 Global Blood Pressure Measure Device Revenue (USD Million) By Applications (2018-2022)
Table 13 Global Blood Pressure Measure Device Revenue Market Share (%) By Applications (2018-2022)
Table 14 Global Blood Pressure Measure Device Market Revenue (USD Million) By Regions (2018-2022)
Table 15 Global Blood Pressure Measure Device Market Share (%) By Regions (2018-2022)
Table 16 North America Blood Pressure Measure Device Revenue (USD Million) By Country (2018-2022)
Table 17 North America Blood Pressure Measure Device Revenue (USD Million) By Type (2018-2022)
Table 18 North America Blood Pressure Measure Device Revenue (USD Million) By Applications (2018-2022)
Table 19 Europe Blood Pressure Measure Device Revenue (USD Million) By Country (2018-2022)
Table 20 Europe Blood Pressure Measure Device Revenue (USD Million) By Type (2018-2022)
Table 21 Europe Blood Pressure Measure Device Revenue (USD Million) By Applications (2018-2022)
Table 22 Asia Pacific Blood Pressure Measure Device Revenue (USD Million) By Country (2018-2022)
Table 23 Asia Pacific Blood Pressure Measure Device Revenue (USD Million) By Type (2018-2022)
Table 24 Asia Pacific Blood Pressure Measure Device Revenue (USD Million) By Applications (2018-2022)
Table 25 South America Blood Pressure Measure Device Revenue (USD Million) By Country (2018-2022)
Table 26 South America Blood Pressure Measure Device Revenue (USD Million) By Type (2018-2022)
Table 27 South America Blood Pressure Measure Device Revenue (USD Million) By Applications (2018-2022)
Table 28 Middle East and Africa Blood Pressure Measure Device Revenue (USD Million) By Region (2018-2022)
Table 29 Middle East and Africa Blood Pressure Measure Device Revenue (USD Million) By Type (2018-2022)
Table 30 Middle East and Africa Blood Pressure Measure Device Revenue (USD Million) By Applications (2018-2022)
Table 31 Financial Analysis
Table 32 Global Blood Pressure Measure Device Revenue (USD Million) By Type (2023-2030)
Table 33 Global Blood Pressure Measure Device Revenue Market Share (%) By Type (2023-2030)
Table 34 Global Blood Pressure Measure Device Revenue (USD Million) By Applications (2023-2030)
Table 35 Global Blood Pressure Measure Device Revenue Market Share (%) By Applications (2023-2030)
Table 36 Global Blood Pressure Measure Device Market Revenue (USD Million), And Revenue (USD Million) By Regions (2023-2030)
Table 37 North America Blood Pressure Measure Device Revenue (USD)By Country (2023-2030)
Table 38 North America Blood Pressure Measure Device Revenue (USD Million) By Type (2023-2030)
Table 39 North America Blood Pressure Measure Device Revenue (USD Million) By Applications (2023-2030)
Table 40 Europe Blood Pressure Measure Device Revenue (USD Million) By Country (2023-2030)
Table 41 Europe Blood Pressure Measure Device Revenue (USD Million) By Type (2023-2030)
Table 42 Europe Blood Pressure Measure Device Revenue (USD Million) By Applications (2023-2030)
Table 43 Asia Pacific Blood Pressure Measure Device Revenue (USD Million) By Country (2023-2030)
Table 44 Asia Pacific Blood Pressure Measure Device Revenue (USD Million) By Type (2023-2030)
Table 45 Asia Pacific Blood Pressure Measure Device Revenue (USD Million) By Applications (2023-2030)
Table 46 South America Blood Pressure Measure Device Revenue (USD Million) By Country (2023-2030)
Table 47 South America Blood Pressure Measure Device Revenue (USD Million) By Type (2023-2030)
Table 48 South America Blood Pressure Measure Device Revenue (USD Million) By Applications (2023-2030)
Table 49 Middle East and Africa Blood Pressure Measure Device Revenue (USD Million) By Region (2023-2030)
Table 50 Middle East and Africa Blood Pressure Measure Device Revenue (USD Million) By Region (2023-2030)
Table 51 Middle East and Africa Blood Pressure Measure Device Revenue (USD Million) By Type (2023-2030)
Table 52 Middle East and Africa Blood Pressure Measure Device Revenue (USD Million) By Applications (2023-2030)
Table 53 Research Programs/Design for This Report
Table 54 Key Data Information from Secondary Sources
Table 55 Key Data Information from Primary Sources
List of Figures
Figure 1 Market Scope
Figure 2 Porter’s Five Forces
Figure 3 Global Blood Pressure Measure Device Revenue (USD Million) By Type (2018-2022)
Figure 4 Global Blood Pressure Measure Device Revenue Market Share (%) By Type (2022)
Figure 5 Global Blood Pressure Measure Device Revenue (USD Million) By Applications (2018-2022)
Figure 6 Global Blood Pressure Measure Device Revenue Market Share (%) By Applications (2022)
Figure 7 Global Blood Pressure Measure Device Market Revenue (USD Million) By Regions (2018-2022)
Figure 8 Global Blood Pressure Measure Device Market Share (%) By Regions (2022)
Figure 9 North America Blood Pressure Measure Device Revenue (USD Million) By Country (2018-2022)
Figure 10 North America Blood Pressure Measure Device Revenue (USD Million) By Type (2018-2022)
Figure 11 North America Blood Pressure Measure Device Revenue (USD Million) By Applications (2018-2022)
Figure 12 Europe Blood Pressure Measure Device Revenue (USD Million) By Country (2018-2022)
Figure 13 Europe Blood Pressure Measure Device Revenue (USD Million) By Type (2018-2022)
Figure 14 Europe Blood Pressure Measure Device Revenue (USD Million) By Applications (2018-2022)
Figure 15 Asia Pacific Blood Pressure Measure Device Revenue (USD Million) By Country (2018-2022)
Figure 16 Asia Pacific Blood Pressure Measure Device Revenue (USD Million) By Type (2018-2022)
Figure 17 Asia Pacific Blood Pressure Measure Device Revenue (USD Million) By Applications (2018-2022)
Figure 18 South America Blood Pressure Measure Device Revenue (USD Million) By Country (2018-2022)
Figure 19 South America Blood Pressure Measure Device Revenue (USD Million) By Type (2018-2022)
Figure 20 South America Blood Pressure Measure Device Revenue (USD Million) By Applications (2018-2022)
Figure 21 Middle East and Africa Blood Pressure Measure Device Revenue (USD Million) By Region (2018-2022)
Figure 22 Middle East and Africa Blood Pressure Measure Device Revenue (USD Million) By Type (2018-2022)
Figure 23 Middle East and Africa Blood Pressure Measure Device Revenue (USD Million) By Applications (2018-2022)
Figure 24 Global Blood Pressure Measure Device Revenue (USD Million) By Type (2023-2030)
Figure 25 Global Blood Pressure Measure Device Revenue Market Share (%) By Type (2030)
Figure 26 Global Blood Pressure Measure Device Revenue (USD Million) By Applications (2023-2030)
Figure 27 Global Blood Pressure Measure Device Revenue Market Share (%) By Applications (2030)
Figure 28 Global Blood Pressure Measure Device Market Revenue (USD Million) By Regions (2023-2030)
Figure 29 North America Blood Pressure Measure Device Revenue (USD Million) By Country (2023-2030)
Figure 30 North America Blood Pressure Measure Device Revenue (USD Million) By Type (2023-2030)
Figure 31 North America Blood Pressure Measure Device Revenue (USD Million) By Applications (2023-2030)
Figure 32 Europe Blood Pressure Measure Device Revenue (USD Million) By Country (2023-2030)
Figure 33 Europe Blood Pressure Measure Device Revenue (USD Million) By Type (2023-2030)
Figure 34 Europe Blood Pressure Measure Device Revenue (USD Million) By Applications (2023-2030)
Figure 35 Asia Pacific Blood Pressure Measure Device Revenue (USD Million) By Country (2023-2030)
Figure 36 Asia Pacific Blood Pressure Measure Device Revenue (USD Million) By Type (2023-2030)
Figure 37 Asia Pacific Blood Pressure Measure Device Revenue (USD Million) By Applications (2023-2030)
Figure 38 South America Blood Pressure Measure Device Revenue (USD Million) By Country (2023-2030)
Figure 39 South America Blood Pressure Measure Device Revenue (USD Million) By Type (2023-2030)
Figure 40 South America Blood Pressure Measure Device Revenue (USD Million) By Applications (2023-2030)
Figure 41 Middle East and Africa Blood Pressure Measure Device Revenue (USD Million) By Region (2023-2030)
Figure 42 Middle East and Africa Blood Pressure Measure Device Revenue (USD Million) By Region (2023-2030)
Figure 43 Middle East and Africa Blood Pressure Measure Device Revenue (USD Million) By Type (2023-2030)
Figure 44 Middle East and Africa Blood Pressure Measure Device Revenue (USD Million) By Applications (2023-2030)
Figure 45 Bottom-Up and Top-Down Approaches For This Report
Figure 46 Data Triangulation
