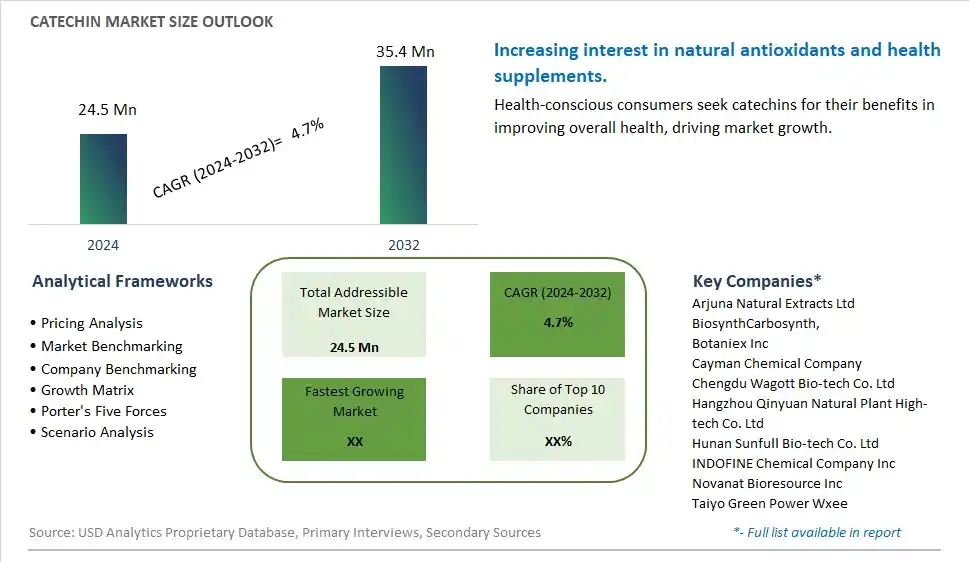
Global Catechin Market Size is valued at $24.5 Million in 2024 and is forecast to register a growth rate (CAGR) of 4.7% to reach $35.4 Million by 2032.
The global Catechin Market Comprehensive Study analyzes and forecasts the market size across 6 regions and 24 countries for diverse segments -By Type (Epigallocatechin (EGC), Epigallocatechin-3- Gallate (EGCG), Others), By Source (Tea, Fruits, Vegetables, Others), By End-User (Nutraceuticals, Beverages, Pharmaceuticals, Mouth Rinsing Agents, Others)
An Introduction to Catechin Market
In 2024, the catechin market is thriving, fueled by the demand for natural antioxidants with health benefits. Catechins, found in tea, cocoa, and certain fruits, offer powerful antioxidant properties and are used in dietary supplements, functional foods, and beverages. The market benefits from advancements in extraction and formulation technologies that enhance the stability and efficacy of catechins. The trend towards clean label and natural ingredients is influencing product development. Increasing consumer interest in health and wellness, supported by the popularity of antioxidant-rich products, is further supporting market growth.
Catechin Competitive Landscape
The market report analyses the leading companies in the industry including Arjuna Natural Extracts Ltd, BiosynthCarbosynth,, Botaniex Inc, Cayman Chemical Company, Chengdu Wagott Bio-tech Co. Ltd, Hangzhou Qinyuan Natural Plant High-tech Co. Ltd, Hunan Sunfull Bio-tech Co. Ltd, INDOFINE Chemical Company Inc, Novanat Bioresource Inc, Taiyo Green Power Wxee, and Others.
Catechin Market Dynamics
Catechin Market Trend: Increasing Use in Functional Foods and Beverages
The most prominent trend in the Catechin Market is the increasing use in functional foods and beverages. Catechins, known for their antioxidant properties, are being incorporated into a variety of health products, such as teas, dietary supplements, and fortified foods. This trend is driven by the demand for ingredients that enhance the nutritional profile and offer health benefits.
Catechin Market Driver: Health Consciousness and Demand for Antioxidants
A key driver in the Catechin Market is health consciousness and the demand for antioxidants. As more individuals focus on improving their health and preventing chronic diseases, there is a rising demand for catechins that provide antioxidant protection and support overall wellness. This demand supports market growth as consumers seek natural and effective health solutions.
Catechin Market Opportunity: Innovation in Nutraceutical and Cosmetic Applications
One significant opportunity in the Catechin Market lies in innovation in nutraceutical and cosmetic applications. Companies can develop new products that utilize catechins in various formulations, such as anti-aging skincare products and immune-boosting supplements, offering consumers convenient and health-focused options. By highlighting the benefits and versatility of catechins, manufacturers can attract a broader consumer base and drive market growth.
Catechin Market Share Analysis- Largest Segment by Type
In the Catechin Market, Epigallocatechin-3-Gallate (EGCG) is the largest segment. EGCG's dominance stems from its well-documented health benefits, including antioxidant, anti-inflammatory, and potential anticancer properties. Found primarily in green tea, EGCG has garnered significant attention in both the nutraceutical and pharmaceutical industries for its therapeutic potential. The extensive research supporting EGCG's efficacy in managing weight, reducing the risk of cardiovascular diseases, and enhancing overall health drives its substantial market presence. Additionally, the robust consumer awareness and demand for natural and functional ingredients that promote wellness further reinforce EGCG's leading position in the catechin market.
Catechin Market Share Analysis- Poised to Grow Fastest Over the Next Five Years by Source
The Tea source segment in the Catechin Market is poised to grow the fastest over the next five years. This growth is fueled by the increasing consumption of tea, particularly green tea, which is a rich source of catechins, including EGCG. The rising global health and wellness trend, coupled with a growing awareness of the antioxidant properties of tea, is driving consumers to incorporate tea into their daily routines. Additionally, tea's established presence in traditional and modern health practices, along with the introduction of new tea-based products and innovations, supports its projected growth. The robust supply chain and well-developed market infrastructure for tea also contribute to its dominant growth trajectory in the catechin market.
Catechin Market Share Analysis- Largest Segment by End-User
The Nutraceuticals end-user segment is the largest in the Catechin Market. This prominence is due to the increasing consumer demand for dietary supplements that offer health benefits and enhance well-being. Catechins, particularly EGCG, are widely used in nutraceutical formulations for their antioxidant, anti-inflammatory, and potential disease-preventive properties. The rising trend of preventive healthcare and the growing awareness of the benefits of functional foods and supplements drive the demand for catechin-based nutraceutical products. Additionally, the extensive use of catechins in dietary supplements and functional foods, combined with ongoing research and development to explore their health benefits, solidifies this segment's leading market position.
Catechin Market Segmentation
By Type
Epigallocatechin (EGC)
Epigallocatechin-3- Gallate (EGCG)
Others
By Source
Tea
Fruits
Vegetables
Others
By End-User
Nutraceuticals
Beverages
Pharmaceuticals
Mouth Rinsing Agents
Others
Countries Analyzed
North America (US, Canada, Mexico)
Europe (Germany, UK, France, Spain, Italy, Russia, Rest of Europe)
Asia Pacific (China, India, Japan, South Korea, Australia, South East Asia, Rest of Asia)
South America (Brazil, Argentina, Rest of South America)
Middle East and Africa (Saudi Arabia, UAE, Rest of Middle East, South Africa, Egypt, Rest of Africa)
Catechin Companies Profiled in the Study
Arjuna Natural Extracts Ltd
BiosynthCarbosynth,
Botaniex Inc
Cayman Chemical Company
Chengdu Wagott Bio-tech Co. Ltd
Hangzhou Qinyuan Natural Plant High-tech Co. Ltd
Hunan Sunfull Bio-tech Co. Ltd
INDOFINE Chemical Company Inc
Novanat Bioresource Inc
Taiyo Green Power Wxee
*- List Not Exhaustive
Chapter 1. TABLE OF CONTENTS
Chapter 2. Introduction to Catechin Market
2.1. Market Overview
2.2. Key Statistics and Report Highlights
2.3. Scope of the Comprehensive Study
2.3.1. Market Definition
2.3.2 Countries and Regions Covered
2.3.3 Research Objective
2.3.4 Units, Currency, and Conversions
2.3.5 Industry Value Chain
2.4. Key Market Segments
2.5. Key Companies
2.6. Study Period
Chapter 3. Strategic Analysis Review
3.1. Catechin Pricing Analysis and Forecast
3.2. Porter’s Five Forces
3.3. Market Ecosystem
3.4. SWOT Analysis
3.5. Regulatory Scenario
3.3. Effects of Inflation, Russia-Ukraine War, moderating economic growth, and other macroeconomic factors
Chapter 4. Competitive Landscape
4.1. Market Share Analysis
4.1.1. Global Catechin Market Share by Company, 2023
4.1.2. Product Offerings of Leading Catechin Companies
4.2. Market Entropy
4.2.1. New Product Launches in the Industry
4.2.2. Mergers, Acquisitions, Joint ventures, and Partnerships
4.3. Key Strategies and Best Practices
Chapter 5. Global Market Projections: Best, Reference, and Low Case Scenarios
5.1. Growth Analysis- Case Scenario Definitions
5.2. Low Growth Case Scenario Forecasts
5.3. Reference Growth Case Scenario Forecasts
5.4. High Growth Case Scenario Forecasts
Chapter 6. Market Dynamics
6.1. Catechin Market Drivers
6.2. Catechin Market Challenges
6.6. Catechin Market Opportunities
6.4. Catechin Market Trends
Chapter 7. Global Catechin Market Outlook Trends
7.1. Global Catechin Revenue (USD Million) and CAGR (%) by Type (2021-2032)
7.2. Global Catechin Revenue (USD Million) and CAGR (%) by Application (2021-2032)
7.3. Global Catechin Revenue (USD Million) and CAGR (%) by Product (2021-2032)
By Type
Epigallocatechin (EGC)
Epigallocatechin-3- Gallate (EGCG)
Others
By Source
Tea
Fruits
Vegetables
Others
By End-User
Nutraceuticals
Beverages
Pharmaceuticals
Mouth Rinsing Agents
Others
Chapter 8. Global Catechin Regional Analysis and Outlook
8.1. Global Catechin Revenue (USD Million) By Regions (2021- 2032)
8.2. North America Catechin Revenue (USD Million) by Country (2021-2032)
8.2.1. United States Catechin Regional Analysis and Outlook
8.2.2. Canada Catechin Regional Analysis and Outlook
8.2.3. Mexico Catechin Regional Analysis and Outlook
8.3. Europe Catechin Revenue (USD Million), by Country (2021-2032)
8.3.1. Germany Catechin Regional Analysis and Outlook
8.3.2. France Catechin Regional Analysis and Outlook
8.3.3. United Kingdom Catechin Regional Analysis and Outlook
8.3.4. Spain Catechin Regional Analysis and Outlook
8.3.5. Italy Catechin Regional Analysis and Outlook
8.3.6. Russia Catechin Regional Analysis and Outlook
8.3.7. Rest of Europe Catechin Regional Analysis and Outlook
8.4. Asia Pacific Catechin Revenue (USD Million) by Country (2021-2032)
8.4.1. China Catechin Regional Analysis and Outlook
8.4.2. Japan Catechin Regional Analysis and Outlook
8.4.3. India Catechin Regional Analysis and Outlook
8.4.4. South Korea Catechin Regional Analysis and Outlook
8.4.5. Australia Catechin Regional Analysis and Outlook
8.4.6. South East Asia Catechin Regional Analysis and Outlook
8.4.7. Rest of Asia Pacific Catechin Regional Analysis and Outlook
8.5. South America Catechin Revenue (USD Million), by Country (2021-2032)
8.5.1. Brazil Catechin Regional Analysis and Outlook
8.5.2. Argentina Catechin Regional Analysis and Outlook
8.5.3. Rest of South America Catechin Regional Analysis and Outlook
8.6. Middle East and Africa Catechin Revenue (USD Million) by Country (2021-2032)
8.6.1. Middle East Catechin Regional Analysis and Outlook
8.6.2. Africa Catechin Regional Analysis and Outlook
Chapter 9. North America Catechin Analysis and Outlook
9.1. North America Catechin Revenue (USD Million) by Segments (2021-2032)
9.1.1. North America Catechin Revenue (USD Million) by Type (2021-2032)
9.1.2. North America Catechin Revenue (USD Million) by Application (2021-2032)
9.1.3. North America Catechin Revenue (USD Million) by Product (2021-2032)
By Type
Epigallocatechin (EGC)
Epigallocatechin-3- Gallate (EGCG)
Others
By Source
Tea
Fruits
Vegetables
Others
By End-User
Nutraceuticals
Beverages
Pharmaceuticals
Mouth Rinsing Agents
Others
Chapter 10. Europe Catechin Analysis and Outlook
10.1. Europe Catechin Revenue (USD Million), by Segments (USD Million) (2021-2032)
10.1.1. Europe Catechin Revenue (USD Million) by Type (2021-2032)
10.1.2. Europe Catechin Revenue (USD Million) by Application (2021-2032)
10.1.3. Europe Catechin Revenue (USD Million) by Product (2021-2032)
By Type
Epigallocatechin (EGC)
Epigallocatechin-3- Gallate (EGCG)
Others
By Source
Tea
Fruits
Vegetables
Others
By End-User
Nutraceuticals
Beverages
Pharmaceuticals
Mouth Rinsing Agents
Others
Chapter 11. Asia Pacific Catechin Analysis and Outlook
11.1. Asia Pacific Catechin Revenue (USD Million), and Revenue (USD Million) by Segments (2021-2032)
11.1.1. Asia Pacific Catechin Revenue (USD Million) by Type (2021-2032)
11.1.2. Asia Pacific Catechin Revenue (USD Million) by Application (2021-2032)
11.1.3. Asia Pacific Catechin Revenue (USD Million) by Product (2021-2032)
By Type
Epigallocatechin (EGC)
Epigallocatechin-3- Gallate (EGCG)
Others
By Source
Tea
Fruits
Vegetables
Others
By End-User
Nutraceuticals
Beverages
Pharmaceuticals
Mouth Rinsing Agents
Others
Chapter 12. South America Catechin Analysis and Outlook
12.1. South America Catechin Revenue (USD Million), by Segments (2021-2032)
12.1.1. South America Catechin Revenue (USD Million) by Type (2021-2032)
12.1.2. South America Catechin Revenue (USD Million) by Application (2021-2032)
12.1.3. South America Catechin Revenue (USD Million) by Product (2021-2032)
By Type
Epigallocatechin (EGC)
Epigallocatechin-3- Gallate (EGCG)
Others
By Source
Tea
Fruits
Vegetables
Others
By End-User
Nutraceuticals
Beverages
Pharmaceuticals
Mouth Rinsing Agents
Others
Chapter 13. Middle East and Africa Catechin Analysis and Outlook
13.1. Middle East and Africa Catechin Revenue (USD Million), by Segments (2021-2032)
13.1.1. Middle East and Africa Catechin Revenue (USD Million) by Type (2021-2032)
13.1.2. Middle East and Africa Catechin Revenue (USD Million) by Application (2021-2032)
13.1.3. Middle East and Africa Catechin Revenue (USD Million) by Product (2021-2032)
By Type
Epigallocatechin (EGC)
Epigallocatechin-3- Gallate (EGCG)
Others
By Source
Tea
Fruits
Vegetables
Others
By End-User
Nutraceuticals
Beverages
Pharmaceuticals
Mouth Rinsing Agents
Others
Chapter 14. Catechin Company Profiles
14.1 Business Overview
14.2 Product Profiles
14.3 SWOT Profiles
14.5 Recent Developments
14.6 Financial Profile
List of Companies
Arjuna Natural Extracts Ltd
BiosynthCarbosynth,
Botaniex Inc
Cayman Chemical Company
Chengdu Wagott Bio-tech Co. Ltd
Hangzhou Qinyuan Natural Plant High-tech Co. Ltd
Hunan Sunfull Bio-tech Co. Ltd
INDOFINE Chemical Company Inc
Novanat Bioresource Inc
Taiyo Green Power Wxee
15. Methodology and Data Sources
15.1 Customization Offerings
15.2 Subscription Services
15.3 Related Reports
15.4 Publisher Expertise
LIST OF TABLES
Table 1 Market Segmentation Analysis
Table 2 Global Catechin Market Share of Leading Companies, 2023
Table 3 Product Offerings of Leading Companies
Table 4 Low Growth Scenario Forecasts
Table 5 Reference Case Growth Scenario
Table 6 High Growth Case Scenario
Table 7 Global Catechin Revenue (USD Million) And CAGR (%) By Type (2021-2032)
Table 8 Global Catechin Revenue (USD Million) And CAGR (%) By Application (2021-2032)
Table 9 Global Catechin Revenue (USD Million) And CAGR (%) By Product (2021-2032)
Table 10 Global Catechin Market Revenue (USD Million) By Regions (2021-2032)
Table 11 Global Catechin Market Share (%) By Regions (2021-2032)
Table 12 North America Catechin Revenue (USD Million) By Country (2021-2032)
Table 13 Europe Catechin Revenue (USD Million) By Country (2021-2032)
Table 14 Asia Pacific Catechin Revenue (USD Million) By Country (2021-2032)
Table 15 South America Catechin Revenue (USD Million) By Country (2021-2032)
Table 16 Middle East and Africa Catechin Revenue (USD Million) By Region (2021-2032)
Table 17 North America Catechin Revenue (USD Million) By Type (2021-2032)
Table 18 North America Catechin Revenue (USD Million) By Application (2021-2032)
Table 19 North America Catechin Revenue (USD Million) By Product (2021-2032)
Table 20 Europe Catechin Revenue (USD Million) By Type (2021-2032)
Table 21 Europe Catechin Revenue (USD Million) By Application (2021-2032)
Table 22 Europe Catechin Revenue (USD Million) By Product (2021-2032)
Table 23 Asia Pacific Catechin Revenue (USD Million) By Type (2021-2032)
Table 24 Asia Pacific Catechin Revenue (USD Million) By Application (2021-2032)
Table 25 Asia Pacific Catechin Revenue (USD Million) By Product (2021-2032)
Table 26 South America Catechin Revenue (USD Million) By Type (2021-2032)
Table 27 South America Catechin Revenue (USD Million) By Application (2021-2032)
Table 28 South America Catechin Revenue (USD Million) By Product (2021-2032)
Table 29 Middle East and Africa Catechin Revenue (USD Million) By Type (2021-2032)
Table 30 Middle East and Africa Catechin Revenue (USD Million) By Application (2021-2032)
Table 31 Middle East and Africa Catechin Revenue (USD Million) By Product (2021-2032)
LIST OF FIGURES
Figure 1. Market Scope
Figure 2. Pricing Forecasts Per Unit, 2023- 2032
Figure 3. Porter’s Five Forces
Figure 4. Global Catechin Market Revenue (USD Million) By Regions (2021-2032)
Figure 5. Global Catechin Market Share (%) By Regions (2023)
Figure 6. North America Catechin Revenue (USD Million) By Country (2021-2032)
Figure 7. United States Catechin Revenue (USD Million) By Country (2021-2032)
Figure 8. Canada Catechin Revenue (USD Million) By Country (2021-2032)
Figure 9. Mexico Catechin Revenue (USD Million) By Country (2021-2032)
Figure 10. Europe Catechin Revenue (USD Million) By Country (2021-2032)
Figure 11. Germany Catechin Revenue (USD Million) By Country (2021-2032)
Figure 12. France Catechin Revenue (USD Million) By Country (2021-2032)
Figure 13. United Kingdom Catechin Revenue (USD Million) By Country (2021-2032)
Figure 14. Spain Catechin Revenue (USD Million) By Country (2021-2032)
Figure 15. Italy Catechin Revenue (USD Million) By Country (2021-2032)
Figure 16. Russia Catechin Revenue (USD Million) By Country (2021-2032)
Figure 17. Rest of Europe Catechin Revenue (USD Million) By Country (2021-2032)
Figure 11. Asia Pacific Catechin Revenue (USD Million) By Country (2021-2032)
Figure 12. China Catechin Revenue (USD Million) By Country (2021-2032)
Figure 13. Japan Catechin Revenue (USD Million) By Country (2021-2032)
Figure 14. India Catechin Revenue (USD Million) By Country (2021-2032)
Figure 15. South Korea Catechin Revenue (USD Million) By Country (2021-2032)
Figure 16. Australia Catechin Revenue (USD Million) By Country (2021-2032)
Figure 17. South East Asia Catechin Revenue (USD Million) By Country (2021-2032)
Figure 18. South America Catechin Revenue (USD Million) By Country (2021-2032)
Figure 19. Brazil Catechin Revenue (USD Million) By Country (2021-2032)
Figure 20. Argentina Catechin Revenue (USD Million) By Country (2021-2032)
Figure 21. Rest of Asia Pacific Catechin Revenue (USD Million) By Country (2021-2032)
Figure 22. Middle East and Africa Catechin Revenue (USD Million) By Region (2021-2032)
Figure 23. Saudi Arabia Catechin Revenue (USD Million) By Region (2021-2032)
Figure 24. The UAE Catechin Revenue (USD Million) By Region (2021-2032)
Figure 25. Rest of Middle East Catechin Revenue (USD Million) By Region (2021-2032)
Figure 26. South Africa Catechin Revenue (USD Million) By Region (2021-2032)
Figure 27. Africa Catechin Revenue (USD Million) By Region (2021-2032)
Figure 28. North America Catechin Revenue (USD Million) By Type (2021-2032)
Figure 29. North America Catechin Revenue (USD Million) By Application (2021-2032)
Figure 30. North America Catechin Revenue (USD Million) By Product (2021-2032)
Figure 31. Europe Catechin Revenue (USD Million) By Type (2021-2032)
Figure 32. Europe Catechin Revenue (USD Million) By Application (2021-2032)
Figure 33. Europe Catechin Revenue (USD Million) By Product (2021-2032)
Figure 34. Asia Pacific Catechin Revenue (USD Million) By Type (2021-2032)
Figure 35. Asia Pacific Catechin Revenue (USD Million) By Application (2021-2032)
Figure 36. Asia Pacific Catechin Revenue (USD Million) By Product (2021-2032)
Figure 37. South America Catechin Revenue (USD Million) By Type (2021-2032)
Figure 38. South America Catechin Revenue (USD Million) By Application (2021-2032)
Figure 39. South America Catechin Revenue (USD Million) By Product (2021-2032)
Figure 40. Middle East and Africa Catechin Revenue (USD Million) By Type (2021-2032)
Figure 41. Middle East and Africa Catechin Revenue (USD Million) By Application (2021-2032)
Figure 42. Middle East and Africa Catechin Revenue (USD Million) By Product (2021-2032)
By Type
Epigallocatechin (EGC)
Epigallocatechin-3- Gallate (EGCG)
Others
By Source
Tea
Fruits
Vegetables
Others
By End-User
Nutraceuticals
Beverages
Pharmaceuticals
Mouth Rinsing Agents
Others
Countries Analyzed
North America (US, Canada, Mexico)
Europe (Germany, UK, France, Spain, Italy, Russia, Rest of Europe)
Asia Pacific (China, India, Japan, South Korea, Australia, South East Asia, Rest of Asia)
South America (Brazil, Argentina, Rest of South America)
Middle East and Africa (Saudi Arabia, UAE, Rest of Middle East, South Africa, Egypt, Rest of Africa)
