
The market growth is driven by increasing Urbanization is driving the demand for various infrastructure projects worldwide, including construction, transportation, and energy infrastructure. Copper strips find extensive use in electrical wiring, plumbing, HVAC systems, and architectural applications. As urban populations continue to grow, the need for modern infrastructure drives the demand for copper strips, particularly in emerging economies undergoing rapid urbanization and industrialization. Leading Companies focusing on Expansion in Electric Vehicles (EVs) Sector, Advancements in 5G and IoT Infrastructure, and others to boost market shares in the industry.
The Copper Strips Market encompasses the production, distribution, and utilization of thin, flat copper pieces across various industries such as electronics, automotive, and construction. Key drivers include industry growth, technological advancements, and sustainability initiatives, while challenges include price volatility and environmental concerns. Regional dynamics and technological innovations further shape the market, with trends including integration into renewable energy infrastructure and expansion in electric vehicles and 5G infrastructure. Major players engage in strategies like mergers and acquisitions to strengthen their market position. Overall, the market's trajectory is influenced by a complex interplay of factors, with opportunities for growth and innovation in line with evolving industry demands.
The growing electronics industry is fueling demand for copper strips, driving advancements in electronic devices. Copper's superior conductivity and thermal properties make it essential for PCBs, connectors, and semiconductors, enabling miniaturization and enhancing performance and reliability in devices like smartphones and wearables. This demand extends to emerging technologies such as electric vehicles and 5G networks. Additionally, copper's recyclability aligns with sustainability goals, further boosting its appeal in electronic manufacturing.
The increasing emphasis on energy efficiency and sustainability is driving a significant surge in demand for copper strips across diverse industries. Renowned for its superior thermal and electrical conductivity, copper plays a vital role in numerous energy-efficient applications. In construction, for instance, copper strips are pivotal in the development of energy-efficient building systems like HVAC, leveraging copper's conductivity for optimal heat transfer. Furthermore, the renewable energy sector heavily relies on copper strips in critical components such as solar panels, wind turbines, and energy storage systems, capitalizing on copper's efficacy in transmitting and converting renewable energy sources. Additionally, the recyclability of copper aligns seamlessly with sustainability objectives, minimizing the need for new material extraction and reducing environmental impact. With industries increasingly prioritizing carbon footprint reduction and energy conservation, the demand for copper strips is anticipated to maintain its upward trajectory, given their indispensable role in fostering energy-efficient and sustainable technologies.
Advancements in manufacturing processes are propelling a surge in the copper strips market, with continuous casting and rolling technologies, innovations in alloying techniques, and advanced surface treatment methods enhancing product quality and performance. These advancements not only improve mechanical strength, corrosion resistance, and conductivity but also increase production efficiency and reduce costs through automation and process optimization. Moreover, they enable market expansion and diversification by catering to emerging industries such as renewable energy and electric vehicles, driving the demand for copper strips in line with evolving technological and sustainability trends.
The Global Copper Strips Market is analyzed across the Machinery Industry, Electronic Industry, Architecture and Art, and others. Electronic Industry is poised to register the fastest growth. The Copper Strips Market within the electronics industry is crucial for manufacturing components like PCBs and semiconductors. With the rise of electronic devices such as smartphones and IoT gadgets, coupled with emerging technologies like EVs and 5G, the demand for copper strips remains high. Key drivers include technological advancements, product miniaturization, and sustainability efforts. As the electronics industry evolves, the copper strips market is expected to witness continuous growth, driven by its essential role in enabling efficient electronic devices and systems.
The Global Copper Strips Market is analyzed across various materials including Copper, Copper Alloy, and others. Of these, Copper held a significant market share in 2024. The Copper Strips Market involves the production and distribution of thin copper strips used across industries for their conductivity and malleability. Key sectors include electronics, automotive, construction, and telecommunications. Market dynamics are driven by industry growth, technological advancements, and sustainability initiatives, with major players adopting strategies like mergers and acquisitions for market expansion. Overall, the market's trajectory is influenced by factors such as economic conditions and evolving industry demands, offering opportunities for growth and innovation.
|
Parameter |
Details |
|
Market Size (2024) |
$7.9 Billion |
|
Market Size (2034) |
$11.8 Billion |
|
Market Growth Rate |
4.1% |
|
Segments |
By Type (Below 6 mm, 6 to 10mm, Above 10mm), By Application (Machinery Industry, Electronic Industry, Architecture and Art, Others), By Material (Copper, Copper Alloy) |
|
Study Period |
2019- 2024 and 2025-2034 |
|
Units |
Revenue (USD) |
|
Qualitative Analysis |
Porter’s Five Forces, SWOT Profile, Market Share, Scenario Forecasts, Market Ecosystem, Company Ranking, Market Dynamics, Industry Benchmarking |
|
Companies |
Anhui Xinke, Aurubis, CHALCO, CNMC Albetter Copper Co Ltd, EGM Group, Furukawa, GB Holding, Jintian Group, KME GERMANY GMBH, KME Group, Mitsubishi Shindoh, Poongsan, Poongsan, Wieland, and Others. |
|
Countries |
US, Canada, Mexico, Germany, France, Spain, Italy, UK, Russia, China, India, Japan, South Korea, Australia, South East Asia, Brazil, Argentina, Middle East, Africa |
By Type
By Application
By Material
By Region
*List not exhaustive
Copper Strips Market Outlook 2024
1 Market Overview
1.1 Introduction to the Copper Strips Market
1.2 Scope of the Study
1.3 Research Objective
1.3.1 Key Market Scope and Segments
1.3.2 Players Covered
1.3.3 Years Considered
2 Executive Summary
2.1 2024 Copper Strips Industry- Market Statistics
3 Market Dynamics
3.1 Market Drivers
3.2 Market Challenges
3.3 Market Opportunities
3.4 Market Trends
4 Market Factor Analysis
4.1 Porter’s Five Forces
4.2 Market Entropy
4.2.1 Global Copper Strips Market Companies with Area Served
4.2.2 Products Offerings Global Copper Strips Market
5 Recession Impact Analysis and Outlook Scenarios
5.1.1 Recission Impact Analysis
5.1.2 Market Growth Scenario- Base Case
5.1.3 Market Growth Scenario- Reference Case
5.1.4 Market Growth Scenario- High Case
6 Global Copper Strips Market Trends
6.1 Global Copper Strips Revenue (USD Million) and CAGR (%) by Type (2018-2032)
6.2 Global Copper Strips Revenue (USD Million) and CAGR (%) by Applications (2018-2032)
6.3 Global Copper Strips Revenue (USD Million) and CAGR (%) by Regions (2018-2032)
7 Global Copper Strips Market Revenue (USD Million) by Type, and Applications (2018-2023)
7.1 Global Copper Strips Revenue (USD Million) by Type (2018-2023)
7.1.1 Global Copper Strips Revenue (USD Million), Market Share (%) by Type (2018-2023)
7.2 Global Copper Strips Revenue (USD Million) by Applications (2018-2023)
7.2.1 Global Copper Strips Revenue (USD Million), Market Share (%) by Applications (2018-2023)
8 Global Copper Strips Development Regional Status and Outlook
8.1 Global Copper Strips Revenue (USD Million) By Regions (2018-2023)
8.2 North America Copper Strips Revenue (USD Million) by Type, and Application (2018-2023)
8.2.1 North America Copper Strips Revenue (USD Million) by Country (2018-2023)
8.2.2 North America Copper Strips Revenue (USD Million) by Type (2018-2023)
8.2.3 North America Copper Strips Revenue (USD Million) by Applications (2018-2023)
8.3 Europe Copper Strips Revenue (USD Million), by Type, and Applications (USD Million) (2018-2023)
8.3.1 Europe Copper Strips Revenue (USD Million), by Country (2018-2023)
8.3.2 Europe Copper Strips Revenue (USD Million) by Type (2018-2023)
8.3.3 Europe Copper Strips Revenue (USD Million) by Applications (2018-2023)
8.4 Asia Pacific Copper Strips Revenue (USD Million), and Revenue (USD Million) by Type, and Applications (2018-2023)
8.4.1 Asia Pacific Copper Strips Revenue (USD Million) by Country (2018-2023)
8.4.2 Asia Pacific Copper Strips Revenue (USD Million) by Type (2018-2023)
8.4.3 Asia Pacific Copper Strips Revenue (USD Million) by Applications (2018-2023)
8.5 South America Copper Strips Revenue (USD Million), by Type, and Applications (2018-2023)
8.5.1 South America Copper Strips Revenue (USD Million), by Country (2018-2023)
8.5.2 South America Copper Strips Revenue (USD Million) by Type (2018-2023)
8.5.3 South America Copper Strips Revenue (USD Million) by Applications (2018-2023)
8.6 Middle East and Africa Copper Strips Revenue (USD Million), by Type, Technology, Application, Thickness (2018-2023)
8.6.1 Middle East and Africa Copper Strips Revenue (USD Million) by Country (2018-2023)
8.6.2 Middle East and Africa Copper Strips Revenue (USD Million) by Type (2018-2023)
8.6.3 Middle East and Africa Copper Strips Revenue (USD Million) by Applications (2018-2023)
9 Company Profiles
10 Global Copper Strips Market Revenue (USD Million), by Type, and Applications (2024-2032)
10.1 Global Copper Strips Revenue (USD Million) and Market Share (%) by Type (2024-2032)
10.1.1 Global Copper Strips Revenue (USD Million), and Market Share (%) by Type (2024-2032)
10.2 Global Copper Strips Revenue (USD Million) and Market Share (%) by Applications (2024-2032)
10.2.1 Global Copper Strips Revenue (USD Million), and Market Share (%) by Applications (2024-2032)
11 Global Copper Strips Development Regional Status and Outlook Forecast
11.1 Global Copper Strips Revenue (USD Million) By Regions (2024-2032)
11.2 North America Copper Strips Revenue (USD Million) by Type, and Applications (2024-2032)
11.2.1 North America Copper Strips Revenue (USD) Million by Country (2024-2032)
11.2.2 North America Copper Strips Revenue (USD Million), by Type (2024-2032)
11.2.3 North America Copper Strips Revenue (USD Million), Market Share (%) by Applications (2024-2032)
11.3 Europe Copper Strips Revenue (USD Million), by Type, and Applications (2024-2032)
11.3.1 Europe Copper Strips Revenue (USD Million), by Country (2024-2032)
11.3.2 Europe Copper Strips Revenue (USD Million), by Type (2024-2032)
11.3.3 Europe Copper Strips Revenue (USD Million), by Applications (2024-2032)
11.4 Asia Pacific Copper Strips Revenue (USD Million) by Type, and Applications (2024-2032)
11.4.1 Asia Pacific Copper Strips Revenue (USD Million), by Country (2024-2032)
11.4.2 Asia Pacific Copper Strips Revenue (USD Million), by Type (2024-2032)
11.4.3 Asia Pacific Copper Strips Revenue (USD Million), by Applications (2024-2032)
11.5 South America Copper Strips Revenue (USD Million), by Type, and Applications (2024-2032)
11.5.1 South America Copper Strips Revenue (USD Million), by Country (2024-2032)
11.5.2 South America Copper Strips Revenue (USD Million), by Type (2024-2032)
11.5.3 South America Copper Strips Revenue (USD Million), by Applications (2024-2032)
11.6 Middle East and Africa Copper Strips Revenue (USD Million), by Type, and Applications (2024-2032)
11.6.1 Middle East and Africa Copper Strips Revenue (USD Million), by region (2024-2032)
11.6.2 Middle East and Africa Copper Strips Revenue (USD Million), by Type (2024-2032)
11.6.3 Middle East and Africa Copper Strips Revenue (USD Million), by Applications (2024-2032)
12 Methodology and Data Sources
12.1 Methodology/Research Approach
12.1.1 Research Programs/Design
12.1.2 Market Size Estimation
12.1.3 Market Breakdown and Data Triangulation
12.2 Data Sources
12.2.1 Secondary Sources
12.2.2 Primary Sources
12.3 Disclaimer
List of Tables
Table 1 Market Segmentation Analysis
Table 2 Global Copper Strips Market Companies with Areas Served
Table 3 Products Offerings Global Copper Strips Market
Table 4 Low Growth Scenario Forecasts
Table 5 Reference Case Growth Scenario
Table 6 High Growth Case Scenario
Table 7 Global Copper Strips Revenue (USD Million) And CAGR (%) By Type (2018-2032)
Table 8 Global Copper Strips Revenue (USD Million) And CAGR (%) By Applications (2018-2032)
Table 9 Global Copper Strips Revenue (USD Million) And CAGR (%) By Regions (2018-2032)
Table 10 Global Copper Strips Revenue (USD Million) By Type (2018-2023)
Table 11 Global Copper Strips Revenue Market Share (%) By Type (2018-2023)
Table 12 Global Copper Strips Revenue (USD Million) By Applications (2018-2023)
Table 13 Global Copper Strips Revenue Market Share (%) By Applications (2018-2023)
Table 14 Global Copper Strips Market Revenue (USD Million) By Regions (2018-2023)
Table 15 Global Copper Strips Market Share (%) By Regions (2018-2023)
Table 16 North America Copper Strips Revenue (USD Million) By Country (2018-2023)
Table 17 North America Copper Strips Revenue (USD Million) By Type (2018-2023)
Table 18 North America Copper Strips Revenue (USD Million) By Applications (2018-2023)
Table 19 Europe Copper Strips Revenue (USD Million) By Country (2018-2023)
Table 20 Europe Copper Strips Revenue (USD Million) By Type (2018-2023)
Table 21 Europe Copper Strips Revenue (USD Million) By Applications (2018-2023)
Table 22 Asia Pacific Copper Strips Revenue (USD Million) By Country (2018-2023)
Table 23 Asia Pacific Copper Strips Revenue (USD Million) By Type (2018-2023)
Table 24 Asia Pacific Copper Strips Revenue (USD Million) By Applications (2018-2023)
Table 25 South America Copper Strips Revenue (USD Million) By Country (2018-2023)
Table 26 South America Copper Strips Revenue (USD Million) By Type (2018-2023)
Table 27 South America Copper Strips Revenue (USD Million) By Applications (2018-2023)
Table 28 Middle East and Africa Copper Strips Revenue (USD Million) By Region (2018-2023)
Table 29 Middle East and Africa Copper Strips Revenue (USD Million) By Type (2018-2023)
Table 30 Middle East and Africa Copper Strips Revenue (USD Million) By Applications (2018-2023)
Table 31 Financial Analysis
Table 32 Global Copper Strips Revenue (USD Million) By Type (2024-2032)
Table 33 Global Copper Strips Revenue Market Share (%) By Type (2024-2032)
Table 34 Global Copper Strips Revenue (USD Million) By Applications (2024-2032)
Table 35 Global Copper Strips Revenue Market Share (%) By Applications (2024-2032)
Table 36 Global Copper Strips Market Revenue (USD Million), And Revenue (USD Million) By Regions (2024-2032)
Table 37 North America Copper Strips Revenue (USD)By Country (2024-2032)
Table 38 North America Copper Strips Revenue (USD Million) By Type (2024-2032)
Table 39 North America Copper Strips Revenue (USD Million) By Applications (2024-2032)
Table 40 Europe Copper Strips Revenue (USD Million) By Country (2024-2032)
Table 41 Europe Copper Strips Revenue (USD Million) By Type (2024-2032)
Table 42 Europe Copper Strips Revenue (USD Million) By Applications (2024-2032)
Table 43 Asia Pacific Copper Strips Revenue (USD Million) By Country (2024-2032)
Table 44 Asia Pacific Copper Strips Revenue (USD Million) By Type (2024-2032)
Table 45 Asia Pacific Copper Strips Revenue (USD Million) By Applications (2024-2032)
Table 46 South America Copper Strips Revenue (USD Million) By Country (2024-2032)
Table 47 South America Copper Strips Revenue (USD Million) By Type (2024-2032)
Table 48 South America Copper Strips Revenue (USD Million) By Applications (2024-2032)
Table 49 Middle East and Africa Copper Strips Revenue (USD Million) By Region (2024-2032)
Table 50 Middle East and Africa Copper Strips Revenue (USD Million) By Region (2024-2032)
Table 51 Middle East and Africa Copper Strips Revenue (USD Million) By Type (2024-2032)
Table 52 Middle East and Africa Copper Strips Revenue (USD Million) By Applications (2024-2032)
Table 53 Research Programs/Design for This Report
Table 54 Key Data Information from Secondary Sources
Table 55 Key Data Information from Primary Sources
List of Figures
Figure 1 Market Scope
Figure 2 Porter’s Five Forces
Figure 3 Global Copper Strips Revenue (USD Million) By Type (2018-2023)
Figure 4 Global Copper Strips Revenue Market Share (%) By Type (2023)
Figure 5 Global Copper Strips Revenue (USD Million) By Applications (2018-2023)
Figure 6 Global Copper Strips Revenue Market Share (%) By Applications (2023)
Figure 7 Global Copper Strips Market Revenue (USD Million) By Regions (2018-2023)
Figure 8 Global Copper Strips Market Share (%) By Regions (2023)
Figure 9 North America Copper Strips Revenue (USD Million) By Country (2018-2023)
Figure 10 North America Copper Strips Revenue (USD Million) By Type (2018-2023)
Figure 11 North America Copper Strips Revenue (USD Million) By Applications (2018-2023)
Figure 12 Europe Copper Strips Revenue (USD Million) By Country (2018-2023)
Figure 13 Europe Copper Strips Revenue (USD Million) By Type (2018-2023)
Figure 14 Europe Copper Strips Revenue (USD Million) By Applications (2018-2023)
Figure 15 Asia Pacific Copper Strips Revenue (USD Million) By Country (2018-2023)
Figure 16 Asia Pacific Copper Strips Revenue (USD Million) By Type (2018-2023)
Figure 17 Asia Pacific Copper Strips Revenue (USD Million) By Applications (2018-2023)
Figure 18 South America Copper Strips Revenue (USD Million) By Country (2018-2023)
Figure 19 South America Copper Strips Revenue (USD Million) By Type (2018-2023)
Figure 20 South America Copper Strips Revenue (USD Million) By Applications (2018-2023)
Figure 21 Middle East and Africa Copper Strips Revenue (USD Million) By Region (2018-2023)
Figure 22 Middle East and Africa Copper Strips Revenue (USD Million) By Type (2018-2023)
Figure 23 Middle East and Africa Copper Strips Revenue (USD Million) By Applications (2018-2023)
Figure 24 Global Copper Strips Revenue (USD Million) By Type (2024-2032)
Figure 25 Global Copper Strips Revenue Market Share (%) By Type (2030)
Figure 26 Global Copper Strips Revenue (USD Million) By Applications (2024-2032)
Figure 27 Global Copper Strips Revenue Market Share (%) By Applications (2030)
Figure 28 Global Copper Strips Market Revenue (USD Million) By Regions (2024-2032)
Figure 29 North America Copper Strips Revenue (USD Million) By Country (2024-2032)
Figure 30 North America Copper Strips Revenue (USD Million) By Type (2024-2032)
Figure 31 North America Copper Strips Revenue (USD Million) By Applications (2024-2032)
Figure 32 Europe Copper Strips Revenue (USD Million) By Country (2024-2032)
Figure 33 Europe Copper Strips Revenue (USD Million) By Type (2024-2032)
Figure 34 Europe Copper Strips Revenue (USD Million) By Applications (2024-2032)
Figure 35 Asia Pacific Copper Strips Revenue (USD Million) By Country (2024-2032)
Figure 36 Asia Pacific Copper Strips Revenue (USD Million) By Type (2024-2032)
Figure 37 Asia Pacific Copper Strips Revenue (USD Million) By Applications (2024-2032)
Figure 38 South America Copper Strips Revenue (USD Million) By Country (2024-2032)
Figure 39 South America Copper Strips Revenue (USD Million) By Type (2024-2032)
Figure 40 South America Copper Strips Revenue (USD Million) By Applications (2024-2032)
Figure 41 Middle East and Africa Copper Strips Revenue (USD Million) By Region (2024-2032)
Figure 42 Middle East and Africa Copper Strips Revenue (USD Million) By Region (2024-2032)
Figure 43 Middle East and Africa Copper Strips Revenue (USD Million) By Type (2024-2032)
Figure 44 Middle East and Africa Copper Strips Revenue (USD Million) By Applications (2024-2032)
Figure 45 Bottom-Up and Top-Down Approaches for This Report
Figure 46 Data Triangulation
By Type
By Application
By Material
By Region
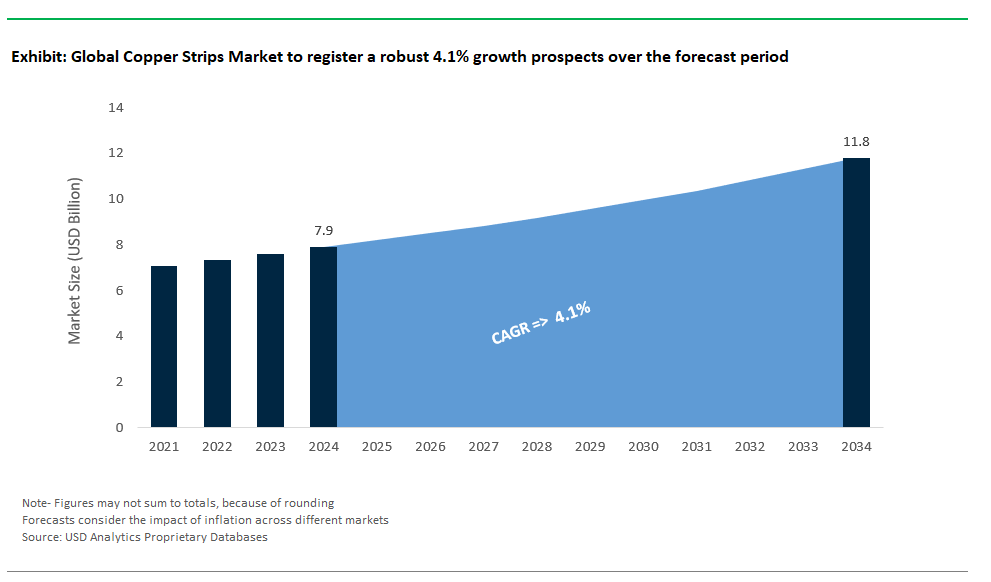
Copper Strips Market Size is valued at $7.9 Billion in 2024 and is forecast to register a growth rate (CAGR) of 4.1% to reach $11.8 Billion by 2034.
Emerging Markets across Asia Pacific, Europe, and Americas present robust growth prospects.
Anhui Xinke, Aurubis, CHALCO, CNMC Albetter Copper Co Ltd, EGM Group, Furukawa, GB Holding, Jintian Group, KME GERMANY GMBH, KME Group, Mitsubishi Shindoh, Poongsan, Poongsan, Wieland
Base Year- 2024; Estimated Year- 2025; Historic Period- 2019-2024; Forecast period- 2025 to 2034; Currency: Revenue (USD); Volume