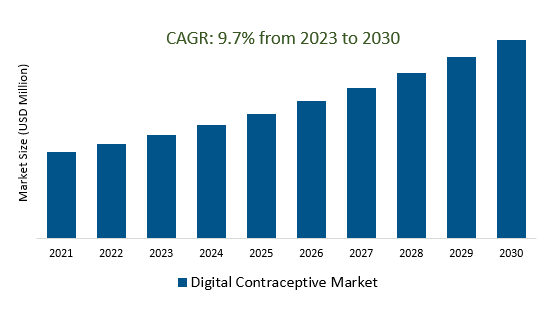
The Global Digital Contraceptive Market Size is estimated to register 9.7% growth over the forecast period from 2023 to 2030.
The market growth is driven by the Increasing awareness about sexual health and family planning, especially in emerging economies, which is driving the demand for digital contraceptives. Digital solutions provide an avenue for education and information dissemination. Leading companies that are focused on Technological Advancements, Personalization and Precision, Integration with Telehealth, Regulatory Frameworks, Health Insurance Coverage, Behavioral Insights and Education, and others to boost market shares in the industry.
Market Overview
The Digital Contraceptive Market, a niche within healthcare and digital health, encompasses digital tools like apps, wearables, and connected devices to assist with family planning and contraception. Key drivers include growing awareness, technological advancements, and user convenience. Challenges include regulatory complexities and data accuracy. The market's future growth hinges on factors like user acceptance and data privacy, but its potential remains promising as technology advances and awareness continues to rise.
Market Dynamics
Market Trends - AI-Powered Contraceptive Apps for Personalized Guidance and Support
AI-powered contraceptive apps are a growing segment within the Digital Contraceptive Market, leveraging artificial intelligence to offer personalized guidance and support for family planning. These apps utilize AI algorithms to analyze user data, including menstrual cycles, hormone levels, and lifestyle factors, to provide precise fertility predictions and contraceptive recommendations. They enhance user engagement by tailoring information and reminders, making them user-specific. The integration of AI enhances the effectiveness and convenience of digital contraceptives, aligning with the market's focus on technology-driven solutions and user-centered design.
Market Driver- Privacy and Data Security Concerns Demand Digital Contraceptive Market
Privacy and data security concerns are a significant driving force behind the Digital Contraceptive Market. Users are increasingly worried about the safeguarding of their sensitive health data within digital contraceptive solutions, underscoring the need for robust data protection measures and strict adherence to privacy regulations to instill confidence among consumers and support the growth of this market.
Market Opportunity-Introduction of Technological Advancements
Technological advancements, encompassing sensors, AI, IoT, and data analytics, are driving the Digital Contraceptive Market by enhancing the accuracy and effectiveness of contraceptive solutions. AI algorithms enable personalized fertility predictions, wearable sensors monitor physiological data, and IoT connectivity allows real-time analysis, improving user convenience and reliability, thereby boosting market growth.
Market Share Analysis- Consumer Digital Contraceptive Market will register the fastest growth
The Global Digital Contraceptive Market is analyzed across Consumer, Clinical, and others. Of these, Consumers are poised to register the fastest growth. Consumers in the Digital Contraceptive Market are individuals using or considering digital contraceptive technologies, such as mobile apps and wearable devices, to monitor fertility, track menstrual cycles, and manage contraception. These solutions offer a data-driven and personalized approach to family planning, aligning with modern preferences for tech-enabled reproductive health solutions.
Market Share Analysis- Online held a significant market share in 2023
The Global Digital Contraceptive Market is analyzed across a wide range of applications including Pharmacies, Online, and others. Of these, online held a significant market share in 2023. In the Digital Contraceptive Market, 'online' signifies the digital platforms, including websites, mobile apps, e-commerce sites, and telehealth services, used by consumers to access information, purchase, and manage digital contraceptive solutions. These online channels provide convenient and private means for individuals seeking modern contraceptive options like fertility tracking apps and telemedicine consultations for birth control, contributing to the rise of digital solutions in family planning.
Digital Contraceptive Market Segmentation
By Grade
By Application
By Region
- North America (United States, Canada, Mexico)
- Europe (Germany, France, United Kingdom, Spain, Italy, Others)
- Asia Pacific (China, India, Japan, South Korea, Australia, Others)
- Latin America (Brazil, Argentina, Others)
- Middle East and Africa (Saudi Arabia, UAE, Kuwait, Other Middle East, South Africa, Nigeria, Other Africa)
Digital Contraceptive Market Companies
- Natural Cycles
- Clue Birth Control
- Oura
- AvaWomen
- Inne.io
- Cirqle Biomedical
- Flo Health
*List not exhaustive
Digital Contraceptive Market Outlook 2023
1 Market Overview
1.1 Introduction to the Digital Contraceptive Market
1.2 Scope of the Study
1.3 Research Objective
1.3.1 Key Market Scope and Segments
1.3.2 Players Covered
1.3.3 Years Considered
2 Executive Summary
2.1 2023 Digital Contraceptive Industry- Market Statistics
3 Market Dynamics
3.1 Market Drivers
3.2 Market Challenges
3.3 Market Opportunities
3.4 Market Trends
4 Market Factor Analysis
4.1 Porter’s Five Forces
4.2 Market Entropy
4.2.1 Global Digital Contraceptive Market Companies with Area Served
4.2.2 Products Offerings Global Digital Contraceptive Market
5 COVID-19 Impact Analysis and Outlook Scenarios
5.1.1 Covid-19 Impact Analysis
5.1.2 Post-COVID-19 Scenario- Low Growth Case
5.1.3 Post-COVID-19 Scenario- Reference Growth Case
5.1.4 Post-COVID-19 Scenario- Low Growth Case
6 Global Digital Contraceptive Market Trends
6.1 Global Digital Contraceptive Revenue (USD Million) and CAGR (%) by Type (2018-2030)
6.2 Global Digital Contraceptive Revenue (USD Million) and CAGR (%) by Applications (2018-2030)
6.3 Global Digital Contraceptive Revenue (USD Million) and CAGR (%) by Regions (2018-2030)
7 Global Digital Contraceptive Market Revenue (USD Million) by Type, and Applications (2018-2022)
7.1 Global Digital Contraceptive Revenue (USD Million) by Type (2018-2022)
7.1.1 Global Digital Contraceptive Revenue (USD Million), Market Share (%) by Type (2018-2022)
7.2 Global Digital Contraceptive Revenue (USD Million) by Applications (2018-2022)
7.2.1 Global Digital Contraceptive Revenue (USD Million), Market Share (%) by Applications (2018-2022)
8 Global Digital Contraceptive Development Regional Status and Outlook
8.1 Global Digital Contraceptive Revenue (USD Million) By Regions (2018-2022)
8.2 North America Digital Contraceptive Revenue (USD Million) by Type, and Application (2018-2022)
8.2.1 North America Digital Contraceptive Revenue (USD Million) by Country (2018-2022)
8.2.2 North America Digital Contraceptive Revenue (USD Million) by Type (2018-2022)
8.2.3 North America Digital Contraceptive Revenue (USD Million) by Applications (2018-2022)
8.3 Europe Digital Contraceptive Revenue (USD Million), by Type, and Applications (USD Million) (2018-2022)
8.3.1 Europe Digital Contraceptive Revenue (USD Million), by Country (2018-2022)
8.3.2 Europe Digital Contraceptive Revenue (USD Million) by Type (2018-2022)
8.3.3 Europe Digital Contraceptive Revenue (USD Million) by Applications (2018-2022)
8.4 Asia Pacific Digital Contraceptive Revenue (USD Million), and Revenue (USD Million) by Type, and Applications (2018-2022)
8.4.1 Asia Pacific Digital Contraceptive Revenue (USD Million) by Country (2018-2022)
8.4.2 Asia Pacific Digital Contraceptive Revenue (USD Million) by Type (2018-2022)
8.4.3 Asia Pacific Digital Contraceptive Revenue (USD Million) by Applications (2018-2022)
8.5 South America Digital Contraceptive Revenue (USD Million), by Type, and Applications (2018-2022)
8.5.1 South America Digital Contraceptive Revenue (USD Million), by Country (2018-2022)
8.5.2 South America Digital Contraceptive Revenue (USD Million) by Type (2018-2022)
8.5.3 South America Digital Contraceptive Revenue (USD Million) by Applications (2018-2022)
8.6 Middle East and Africa Digital Contraceptive Revenue (USD Million), by Type, Technology, Application, Thickness (2018-2022)
8.6.1 Middle East and Africa Digital Contraceptive Revenue (USD Million) by Country (2018-2022)
8.6.2 Middle East and Africa Digital Contraceptive Revenue (USD Million) by Type (2018-2022)
8.6.3 Middle East and Africa Digital Contraceptive Revenue (USD Million) by Applications (2018-2022)
9 Company Profiles
10 Global Digital Contraceptive Market Revenue (USD Million), by Type, and Applications (2023-2030)
10.1 Global Digital Contraceptive Revenue (USD Million) and Market Share (%) by Type (2023-2030)
10.1.1 Global Digital Contraceptive Revenue (USD Million), and Market Share (%) by Type (2023-2030)
10.2 Global Digital Contraceptive Revenue (USD Million) and Market Share (%) by Applications (2023-2030)
10.2.1 Global Digital Contraceptive Revenue (USD Million), and Market Share (%) by Applications (2023-2030)
11 Global Digital Contraceptive Development Regional Status and Outlook Forecast
11.1 Global Digital Contraceptive Revenue (USD Million) By Regions (2023-2030)
11.2 North America Digital Contraceptive Revenue (USD Million) by Type, and Applications (2023-2030)
11.2.1 North America Digital Contraceptive Revenue (USD) Million by Country (2023-2030)
11.2.2 North America Digital Contraceptive Revenue (USD Million), by Type (2023-2030)
11.2.3 North America Digital Contraceptive Revenue (USD Million), Market Share (%) by Applications (2023-2030)
11.3 Europe Digital Contraceptive Revenue (USD Million), by Type, and Applications (2023-2030)
11.3.1 Europe Digital Contraceptive Revenue (USD Million), by Country (2023-2030)
11.3.2 Europe Digital Contraceptive Revenue (USD Million), by Type (2023-2030)
11.3.3 Europe Digital Contraceptive Revenue (USD Million), by Applications (2023-2030)
11.4 Asia Pacific Digital Contraceptive Revenue (USD Million) by Type, and Applications (2023-2030)
11.4.1 Asia Pacific Digital Contraceptive Revenue (USD Million), by Country (2023-2030)
11.4.2 Asia Pacific Digital Contraceptive Revenue (USD Million), by Type (2023-2030)
11.4.3 Asia Pacific Digital Contraceptive Revenue (USD Million), by Applications (2023-2030)
11.5 South America Digital Contraceptive Revenue (USD Million), by Type, and Applications (2023-2030)
11.5.1 South America Digital Contraceptive Revenue (USD Million), by Country (2023-2030)
11.5.2 South America Digital Contraceptive Revenue (USD Million), by Type (2023-2030)
11.5.3 South America Digital Contraceptive Revenue (USD Million), by Applications (2023-2030)
11.6 Middle East and Africa Digital Contraceptive Revenue (USD Million), by Type, and Applications (2023-2030)
11.6.1 Middle East and Africa Digital Contraceptive Revenue (USD Million), by Region (2023-2030)
11.6.2 Middle East and Africa Digital Contraceptive Revenue (USD Million), by Type (2023-2030)
11.6.3 Middle East and Africa Digital Contraceptive Revenue (USD Million), by Applications (2023-2030)
12 Methodology and Data Sources
12.1 Methodology/Research Approach
12.1.1 Research Programs/Design
12.1.2 Market Size Estimation
12.1.3 Market Breakdown and Data Triangulation
12.2 Data Sources
12.2.1 Secondary Sources
12.2.2 Primary Sources
12.3 Disclaimer
List of Tables
Table 1 Market Segmentation Analysis
Table 2 Global Digital Contraceptive Market Companies with Areas Served
Table 3 Products Offerings Global Digital Contraceptive Market
Table 4 Low Growth Scenario Forecasts
Table 5 Reference Case Growth Scenario
Table 6 High Growth Case Scenario
Table 7 Global Digital Contraceptive Revenue (USD Million) And CAGR (%) By Type (2018-2030)
Table 8 Global Digital Contraceptive Revenue (USD Million) And CAGR (%) By Applications (2018-2030)
Table 9 Global Digital Contraceptive Revenue (USD Million) And CAGR (%) By Regions (2018-2030)
Table 10 Global Digital Contraceptive Revenue (USD Million) By Type (2018-2022)
Table 11 Global Digital Contraceptive Revenue Market Share (%) By Type (2018-2022)
Table 12 Global Digital Contraceptive Revenue (USD Million) By Applications (2018-2022)
Table 13 Global Digital Contraceptive Revenue Market Share (%) By Applications (2018-2022)
Table 14 Global Digital Contraceptive Market Revenue (USD Million) By Regions (2018-2022)
Table 15 Global Digital Contraceptive Market Share (%) By Regions (2018-2022)
Table 16 North America Digital Contraceptive Revenue (USD Million) By Country (2018-2022)
Table 17 North America Digital Contraceptive Revenue (USD Million) By Type (2018-2022)
Table 18 North America Digital Contraceptive Revenue (USD Million) By Applications (2018-2022)
Table 19 Europe Digital Contraceptive Revenue (USD Million) By Country (2018-2022)
Table 20 Europe Digital Contraceptive Revenue (USD Million) By Type (2018-2022)
Table 21 Europe Digital Contraceptive Revenue (USD Million) By Applications (2018-2022)
Table 22 Asia Pacific Digital Contraceptive Revenue (USD Million) By Country (2018-2022)
Table 23 Asia Pacific Digital Contraceptive Revenue (USD Million) By Type (2018-2022)
Table 24 Asia Pacific Digital Contraceptive Revenue (USD Million) By Applications (2018-2022)
Table 25 South America Digital Contraceptive Revenue (USD Million) By Country (2018-2022)
Table 26 South America Digital Contraceptive Revenue (USD Million) By Type (2018-2022)
Table 27 South America Digital Contraceptive Revenue (USD Million) By Applications (2018-2022)
Table 28 Middle East and Africa Digital Contraceptive Revenue (USD Million) By Region (2018-2022)
Table 29 Middle East and Africa Digital Contraceptive Revenue (USD Million) By Type (2018-2022)
Table 30 Middle East and Africa Digital Contraceptive Revenue (USD Million) By Applications (2018-2022)
Table 31 Financial Analysis
Table 32 Global Digital Contraceptive Revenue (USD Million) By Type (2023-2030)
Table 33 Global Digital Contraceptive Revenue Market Share (%) By Type (2023-2030)
Table 34 Global Digital Contraceptive Revenue (USD Million) By Applications (2023-2030)
Table 35 Global Digital Contraceptive Revenue Market Share (%) By Applications (2023-2030)
Table 36 Global Digital Contraceptive Market Revenue (USD Million), And Revenue (USD Million) By Regions (2023-2030)
Table 37 North America Digital Contraceptive Revenue (USD)By Country (2023-2030)
Table 38 North America Digital Contraceptive Revenue (USD Million) By Type (2023-2030)
Table 39 North America Digital Contraceptive Revenue (USD Million) By Applications (2023-2030)
Table 40 Europe Digital Contraceptive Revenue (USD Million) By Country (2023-2030)
Table 41 Europe Digital Contraceptive Revenue (USD Million) By Type (2023-2030)
Table 42 Europe Digital Contraceptive Revenue (USD Million) By Applications (2023-2030)
Table 43 Asia Pacific Digital Contraceptive Revenue (USD Million) By Country (2023-2030)
Table 44 Asia Pacific Digital Contraceptive Revenue (USD Million) By Type (2023-2030)
Table 45 Asia Pacific Digital Contraceptive Revenue (USD Million) By Applications (2023-2030)
Table 46 South America Digital Contraceptive Revenue (USD Million) By Country (2023-2030)
Table 47 South America Digital Contraceptive Revenue (USD Million) By Type (2023-2030)
Table 48 South America Digital Contraceptive Revenue (USD Million) By Applications (2023-2030)
Table 49 Middle East and Africa Digital Contraceptive Revenue (USD Million) By Region (2023-2030)
Table 50 Middle East and Africa Digital Contraceptive Revenue (USD Million) By Region (2023-2030)
Table 51 Middle East and Africa Digital Contraceptive Revenue (USD Million) By Type (2023-2030)
Table 52 Middle East and Africa Digital Contraceptive Revenue (USD Million) By Applications (2023-2030)
Table 53 Research Programs/Design for This Report
Table 54 Key Data Information from Secondary Sources
Table 55 Key Data Information from Primary Sources
List of Figures
Figure 1 Market Scope
Figure 2 Porter’s Five Forces
Figure 3 Global Digital Contraceptive Revenue (USD Million) By Type (2018-2022)
Figure 4 Global Digital Contraceptive Revenue Market Share (%) By Type (2022)
Figure 5 Global Digital Contraceptive Revenue (USD Million) By Applications (2018-2022)
Figure 6 Global Digital Contraceptive Revenue Market Share (%) By Applications (2022)
Figure 7 Global Digital Contraceptive Market Revenue (USD Million) By Regions (2018-2022)
Figure 8 Global Digital Contraceptive Market Share (%) By Regions (2022)
Figure 9 North America Digital Contraceptive Revenue (USD Million) By Country (2018-2022)
Figure 10 North America Digital Contraceptive Revenue (USD Million) By Type (2018-2022)
Figure 11 North America Digital Contraceptive Revenue (USD Million) By Applications (2018-2022)
Figure 12 Europe Digital Contraceptive Revenue (USD Million) By Country (2018-2022)
Figure 13 Europe Digital Contraceptive Revenue (USD Million) By Type (2018-2022)
Figure 14 Europe Digital Contraceptive Revenue (USD Million) By Applications (2018-2022)
Figure 15 Asia Pacific Digital Contraceptive Revenue (USD Million) By Country (2018-2022)
Figure 16 Asia Pacific Digital Contraceptive Revenue (USD Million) By Type (2018-2022)
Figure 17 Asia Pacific Digital Contraceptive Revenue (USD Million) By Applications (2018-2022)
Figure 18 South America Digital Contraceptive Revenue (USD Million) By Country (2018-2022)
Figure 19 South America Digital Contraceptive Revenue (USD Million) By Type (2018-2022)
Figure 20 South America Digital Contraceptive Revenue (USD Million) By Applications (2018-2022)
Figure 21 Middle East and Africa Digital Contraceptive Revenue (USD Million) By Region (2018-2022)
Figure 22 Middle East and Africa Digital Contraceptive Revenue (USD Million) By Type (2018-2022)
Figure 23 Middle East and Africa Digital Contraceptive Revenue (USD Million) By Applications (2018-2022)
Figure 24 Global Digital Contraceptive Revenue (USD Million) By Type (2023-2030)
Figure 25 Global Digital Contraceptive Revenue Market Share (%) By Type (2030)
Figure 26 Global Digital Contraceptive Revenue (USD Million) By Applications (2023-2030)
Figure 27 Global Digital Contraceptive Revenue Market Share (%) By Applications (2030)
Figure 28 Global Digital Contraceptive Market Revenue (USD Million) By Regions (2023-2030)
Figure 29 North America Digital Contraceptive Revenue (USD Million) By Country (2023-2030)
Figure 30 North America Digital Contraceptive Revenue (USD Million) By Type (2023-2030)
Figure 31 North America Digital Contraceptive Revenue (USD Million) By Applications (2023-2030)
Figure 32 Europe Digital Contraceptive Revenue (USD Million) By Country (2023-2030)
Figure 33 Europe Digital Contraceptive Revenue (USD Million) By Type (2023-2030)
Figure 34 Europe Digital Contraceptive Revenue (USD Million) By Applications (2023-2030)
Figure 35 Asia Pacific Digital Contraceptive Revenue (USD Million) By Country (2023-2030)
Figure 36 Asia Pacific Digital Contraceptive Revenue (USD Million) By Type (2023-2030)
Figure 37 Asia Pacific Digital Contraceptive Revenue (USD Million) By Applications (2023-2030)
Figure 38 South America Digital Contraceptive Revenue (USD Million) By Country (2023-2030)
Figure 39 South America Digital Contraceptive Revenue (USD Million) By Type (2023-2030)
Figure 40 South America Digital Contraceptive Revenue (USD Million) By Applications (2023-2030)
Figure 41 Middle East and Africa Digital Contraceptive Revenue (USD Million) By Region (2023-2030)
Figure 42 Middle East and Africa Digital Contraceptive Revenue (USD Million) By Region (2023-2030)
Figure 43 Middle East and Africa Digital Contraceptive Revenue (USD Million) By Type (2023-2030)
Figure 44 Middle East and Africa Digital Contraceptive Revenue (USD Million) By Applications (2023-2030)
Figure 45 Bottom-Up and Top-Down Approaches For This Report
Figure 46 Data Triangulation
