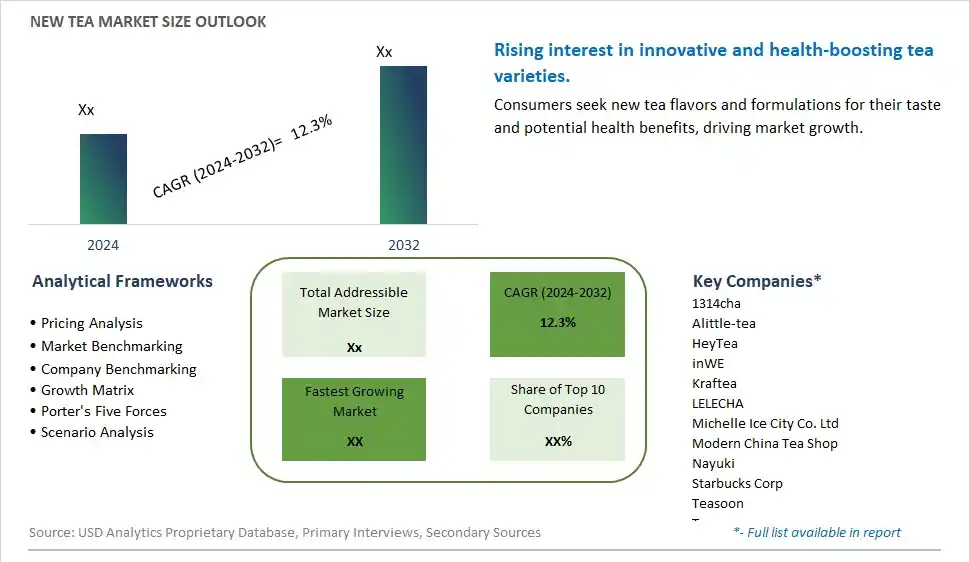
Global New Tea Market Size is valued at $XX Million in 2024 and is forecast to register a growth rate (CAGR) of 12.3% to reach $XX Million by 2032.
The global New Tea Market Comprehensive Study analyzes and forecasts the market size across 6 regions and 24 countries for diverse segments -By Type (Cheese Tea, Fruit-based Tea, Others), By Sales Channel (Online, Offline)
An Introduction to New Tea Market
The New Tea Market involves the production and sale of innovative tea products, including new blends, flavors, and formats. These products cater to consumers seeking unique and high-quality tea experiences. The market is driven by increasing consumer interest in health and wellness, rising demand for premium and artisanal beverages, and growing awareness about the benefits of tea. Additionally, innovations in tea formulations and packaging designs support market growth.
New Tea Competitive Landscape
The market report analyses the leading companies in the industry including 1314cha, Alittle-tea, HeyTea, inWE, Kraftea, LELECHA, Michelle Ice City Co. Ltd, Modern China Tea Shop, Nayuki, Starbucks Corp, Teasoon, Teasure, Zhengzhou Siwu Ke Catering Management Co. Ltd, and Others.
New Tea Market Dynamics
New Tea Market Trend: Rising Popularity of Specialty and Functional Teas
The most prominent trend in the New Tea Market is the rising popularity of specialty and functional teas. Consumers are increasingly seeking teas that offer unique flavors and health benefits, such as detox, relaxation, and energy-boosting properties, driven by the demand for wellness beverages.
New Tea Market Driver: Growing Health Consciousness
A key driver in the New Tea Market is growing health consciousness. As more individuals focus on improving their overall health and wellness, there is a rising demand for teas that provide additional health benefits, such as antioxidants, vitamins, and herbal extracts.
New Tea Market Opportunity: Innovation in Tea Blends and Packaging
One significant opportunity in the New Tea Market lies in innovation in tea blends and packaging. Companies can develop new tea products with unique combinations of herbs, spices, and natural flavors, and offer convenient packaging formats such as single-serve pods and ready-to-drink bottles, catering to diverse consumer preferences and driving market growth.
New Tea Market Share Analysis- Largest Segment by Type
In the New Tea Market, Fruit-Based Tea is the largest segment. Fruit-based teas appeal to a broad audience due to their refreshing flavors and perceived health benefits. They are often marketed as natural and flavorful alternatives to traditional teas, aligning with the growing consumer trend towards healthier beverage options. The versatility in flavor profiles and the ability to cater to various tastes make fruit-based teas a dominant choice in the market.
New Tea Market Share Analysis- Fastest Growing Segment by Sales Channel
The Online sales channel is expected to grow the fastest in the New Tea Market over the next five years. The rise of e-commerce platforms and direct-to-consumer models offers convenience and a broader selection of new tea products. Online retailing allows for easy access to niche and specialty tea varieties that might not be available in physical stores. The convenience of online shopping, combined with targeted marketing and subscription models, is driving the rapid growth of this segment.
New Tea Market Segmentation
By Type
Cheese Tea
Fruit-based Tea
Others
By Sales Channel
Online
Offline
Countries Analyzed
North America (US, Canada, Mexico)
Europe (Germany, UK, France, Spain, Italy, Russia, Rest of Europe)
Asia Pacific (China, India, Japan, South Korea, Australia, South East Asia, Rest of Asia)
South America (Brazil, Argentina, Rest of South America)
Middle East and Africa (Saudi Arabia, UAE, Rest of Middle East, South Africa, Egypt, Rest of Africa)
New Tea Companies Profiled in the Study
1314cha
Alittle-tea
HeyTea
inWE
Kraftea
LELECHA
Michelle Ice City Co. Ltd
Modern China Tea Shop
Nayuki
Starbucks Corp
Teasoon
Teasure
Zhengzhou Siwu Ke Catering Management Co. Ltd
*- List Not Exhaustive
Chapter 1. TABLE OF CONTENTS
Chapter 2. Introduction to New Tea Market
2.1. Market Overview
2.2. Key Statistics and Report Highlights
2.3. Scope of the Comprehensive Study
2.3.1. Market Definition
2.3.2 Countries and Regions Covered
2.3.3 Research Objective
2.3.4 Units, Currency, and Conversions
2.3.5 Industry Value Chain
2.4. Key Market Segments
2.5. Key Companies
2.6. Study Period
Chapter 3. Strategic Analysis Review
3.1. New Tea Pricing Analysis and Forecast
3.2. Porter’s Five Forces
3.3. Market Ecosystem
3.4. SWOT Analysis
3.5. Regulatory Scenario
3.3. Effects of Inflation, Russia-Ukraine War, moderating economic growth, and other macroeconomic factors
Chapter 4. Competitive Landscape
4.1. Market Share Analysis
4.1.1. Global New Tea Market Share by Company, 2023
4.1.2. Product Offerings of Leading New Tea Companies
4.2. Market Entropy
4.2.1. New Product Launches in the Industry
4.2.2. Mergers, Acquisitions, Joint ventures, and Partnerships
4.3. Key Strategies and Best Practices
Chapter 5. Global Market Projections: Best, Reference, and Low Case Scenarios
5.1. Growth Analysis- Case Scenario Definitions
5.2. Low Growth Case Scenario Forecasts
5.3. Reference Growth Case Scenario Forecasts
5.4. High Growth Case Scenario Forecasts
Chapter 6. Market Dynamics
6.1. New Tea Market Drivers
6.2. New Tea Market Challenges
6.6. New Tea Market Opportunities
6.4. New Tea Market Trends
Chapter 7. Global New Tea Market Outlook Trends
7.1. Global New Tea Revenue (USD Million) and CAGR (%) by Type (2021-2032)
7.2. Global New Tea Revenue (USD Million) and CAGR (%) by Application (2021-2032)
7.3. Global New Tea Revenue (USD Million) and CAGR (%) by Product (2021-2032)
By Type
Cheese Tea
Fruit-based Tea
Others
By Sales Channel
Online
Offline
Chapter 8. Global New Tea Regional Analysis and Outlook
8.1. Global New Tea Revenue (USD Million) By Regions (2021- 2032)
8.2. North America New Tea Revenue (USD Million) by Country (2021-2032)
8.2.1. United States New Tea Regional Analysis and Outlook
8.2.2. Canada New Tea Regional Analysis and Outlook
8.2.3. Mexico New Tea Regional Analysis and Outlook
8.3. Europe New Tea Revenue (USD Million), by Country (2021-2032)
8.3.1. Germany New Tea Regional Analysis and Outlook
8.3.2. France New Tea Regional Analysis and Outlook
8.3.3. United Kingdom New Tea Regional Analysis and Outlook
8.3.4. Spain New Tea Regional Analysis and Outlook
8.3.5. Italy New Tea Regional Analysis and Outlook
8.3.6. Russia New Tea Regional Analysis and Outlook
8.3.7. Rest of Europe New Tea Regional Analysis and Outlook
8.4. Asia Pacific New Tea Revenue (USD Million) by Country (2021-2032)
8.4.1. China New Tea Regional Analysis and Outlook
8.4.2. Japan New Tea Regional Analysis and Outlook
8.4.3. India New Tea Regional Analysis and Outlook
8.4.4. South Korea New Tea Regional Analysis and Outlook
8.4.5. Australia New Tea Regional Analysis and Outlook
8.4.6. South East Asia New Tea Regional Analysis and Outlook
8.4.7. Rest of Asia Pacific New Tea Regional Analysis and Outlook
8.5. South America New Tea Revenue (USD Million), by Country (2021-2032)
8.5.1. Brazil New Tea Regional Analysis and Outlook
8.5.2. Argentina New Tea Regional Analysis and Outlook
8.5.3. Rest of South America New Tea Regional Analysis and Outlook
8.6. Middle East and Africa New Tea Revenue (USD Million) by Country (2021-2032)
8.6.1. Middle East New Tea Regional Analysis and Outlook
8.6.2. Africa New Tea Regional Analysis and Outlook
Chapter 9. North America New Tea Analysis and Outlook
9.1. North America New Tea Revenue (USD Million) by Segments (2021-2032)
9.1.1. North America New Tea Revenue (USD Million) by Type (2021-2032)
9.1.2. North America New Tea Revenue (USD Million) by Application (2021-2032)
9.1.3. North America New Tea Revenue (USD Million) by Product (2021-2032)
By Type
Cheese Tea
Fruit-based Tea
Others
By Sales Channel
Online
Offline
Chapter 10. Europe New Tea Analysis and Outlook
10.1. Europe New Tea Revenue (USD Million), by Segments (USD Million) (2021-2032)
10.1.1. Europe New Tea Revenue (USD Million) by Type (2021-2032)
10.1.2. Europe New Tea Revenue (USD Million) by Application (2021-2032)
10.1.3. Europe New Tea Revenue (USD Million) by Product (2021-2032)
By Type
Cheese Tea
Fruit-based Tea
Others
By Sales Channel
Online
Offline
Chapter 11. Asia Pacific New Tea Analysis and Outlook
11.1. Asia Pacific New Tea Revenue (USD Million), and Revenue (USD Million) by Segments (2021-2032)
11.1.1. Asia Pacific New Tea Revenue (USD Million) by Type (2021-2032)
11.1.2. Asia Pacific New Tea Revenue (USD Million) by Application (2021-2032)
11.1.3. Asia Pacific New Tea Revenue (USD Million) by Product (2021-2032)
By Type
Cheese Tea
Fruit-based Tea
Others
By Sales Channel
Online
Offline
Chapter 12. South America New Tea Analysis and Outlook
12.1. South America New Tea Revenue (USD Million), by Segments (2021-2032)
12.1.1. South America New Tea Revenue (USD Million) by Type (2021-2032)
12.1.2. South America New Tea Revenue (USD Million) by Application (2021-2032)
12.1.3. South America New Tea Revenue (USD Million) by Product (2021-2032)
By Type
Cheese Tea
Fruit-based Tea
Others
By Sales Channel
Online
Offline
Chapter 13. Middle East and Africa New Tea Analysis and Outlook
13.1. Middle East and Africa New Tea Revenue (USD Million), by Segments (2021-2032)
13.1.1. Middle East and Africa New Tea Revenue (USD Million) by Type (2021-2032)
13.1.2. Middle East and Africa New Tea Revenue (USD Million) by Application (2021-2032)
13.1.3. Middle East and Africa New Tea Revenue (USD Million) by Product (2021-2032)
By Type
Cheese Tea
Fruit-based Tea
Others
By Sales Channel
Online
Offline
Chapter 14. New Tea Company Profiles
14.1 Business Overview
14.2 Product Profiles
14.3 SWOT Profiles
14.5 Recent Developments
14.6 Financial Profile
List of Companies
1314cha
Alittle-tea
HeyTea
inWE
Kraftea
LELECHA
Michelle Ice City Co. Ltd
Modern China Tea Shop
Nayuki
Starbucks Corp
Teasoon
Teasure
Zhengzhou Siwu Ke Catering Management Co. Ltd
15. Methodology and Data Sources
15.1 Customization Offerings
15.2 Subscription Services
15.3 Related Reports
15.4 Publisher Expertise
LIST OF TABLES
Table 1 Market Segmentation Analysis
Table 2 Global New Tea Market Share of Leading Companies, 2023
Table 3 Product Offerings of Leading Companies
Table 4 Low Growth Scenario Forecasts
Table 5 Reference Case Growth Scenario
Table 6 High Growth Case Scenario
Table 7 Global New Tea Revenue (USD Million) And CAGR (%) By Type (2021-2032)
Table 8 Global New Tea Revenue (USD Million) And CAGR (%) By Application (2021-2032)
Table 9 Global New Tea Revenue (USD Million) And CAGR (%) By Product (2021-2032)
Table 10 Global New Tea Market Revenue (USD Million) By Regions (2021-2032)
Table 11 Global New Tea Market Share (%) By Regions (2021-2032)
Table 12 North America New Tea Revenue (USD Million) By Country (2021-2032)
Table 13 Europe New Tea Revenue (USD Million) By Country (2021-2032)
Table 14 Asia Pacific New Tea Revenue (USD Million) By Country (2021-2032)
Table 15 South America New Tea Revenue (USD Million) By Country (2021-2032)
Table 16 Middle East and Africa New Tea Revenue (USD Million) By Region (2021-2032)
Table 17 North America New Tea Revenue (USD Million) By Type (2021-2032)
Table 18 North America New Tea Revenue (USD Million) By Application (2021-2032)
Table 19 North America New Tea Revenue (USD Million) By Product (2021-2032)
Table 20 Europe New Tea Revenue (USD Million) By Type (2021-2032)
Table 21 Europe New Tea Revenue (USD Million) By Application (2021-2032)
Table 22 Europe New Tea Revenue (USD Million) By Product (2021-2032)
Table 23 Asia Pacific New Tea Revenue (USD Million) By Type (2021-2032)
Table 24 Asia Pacific New Tea Revenue (USD Million) By Application (2021-2032)
Table 25 Asia Pacific New Tea Revenue (USD Million) By Product (2021-2032)
Table 26 South America New Tea Revenue (USD Million) By Type (2021-2032)
Table 27 South America New Tea Revenue (USD Million) By Application (2021-2032)
Table 28 South America New Tea Revenue (USD Million) By Product (2021-2032)
Table 29 Middle East and Africa New Tea Revenue (USD Million) By Type (2021-2032)
Table 30 Middle East and Africa New Tea Revenue (USD Million) By Application (2021-2032)
Table 31 Middle East and Africa New Tea Revenue (USD Million) By Product (2021-2032)
LIST OF FIGURES
Figure 1. Market Scope
Figure 2. Pricing Forecasts Per Unit, 2023- 2032
Figure 3. Porter’s Five Forces
Figure 4. Global New Tea Market Revenue (USD Million) By Regions (2021-2032)
Figure 5. Global New Tea Market Share (%) By Regions (2023)
Figure 6. North America New Tea Revenue (USD Million) By Country (2021-2032)
Figure 7. United States New Tea Revenue (USD Million) By Country (2021-2032)
Figure 8. Canada New Tea Revenue (USD Million) By Country (2021-2032)
Figure 9. Mexico New Tea Revenue (USD Million) By Country (2021-2032)
Figure 10. Europe New Tea Revenue (USD Million) By Country (2021-2032)
Figure 11. Germany New Tea Revenue (USD Million) By Country (2021-2032)
Figure 12. France New Tea Revenue (USD Million) By Country (2021-2032)
Figure 13. United Kingdom New Tea Revenue (USD Million) By Country (2021-2032)
Figure 14. Spain New Tea Revenue (USD Million) By Country (2021-2032)
Figure 15. Italy New Tea Revenue (USD Million) By Country (2021-2032)
Figure 16. Russia New Tea Revenue (USD Million) By Country (2021-2032)
Figure 17. Rest of Europe New Tea Revenue (USD Million) By Country (2021-2032)
Figure 11. Asia Pacific New Tea Revenue (USD Million) By Country (2021-2032)
Figure 12. China New Tea Revenue (USD Million) By Country (2021-2032)
Figure 13. Japan New Tea Revenue (USD Million) By Country (2021-2032)
Figure 14. India New Tea Revenue (USD Million) By Country (2021-2032)
Figure 15. South Korea New Tea Revenue (USD Million) By Country (2021-2032)
Figure 16. Australia New Tea Revenue (USD Million) By Country (2021-2032)
Figure 17. South East Asia New Tea Revenue (USD Million) By Country (2021-2032)
Figure 18. South America New Tea Revenue (USD Million) By Country (2021-2032)
Figure 19. Brazil New Tea Revenue (USD Million) By Country (2021-2032)
Figure 20. Argentina New Tea Revenue (USD Million) By Country (2021-2032)
Figure 21. Rest of Asia Pacific New Tea Revenue (USD Million) By Country (2021-2032)
Figure 22. Middle East and Africa New Tea Revenue (USD Million) By Region (2021-2032)
Figure 23. Saudi Arabia New Tea Revenue (USD Million) By Region (2021-2032)
Figure 24. The UAE New Tea Revenue (USD Million) By Region (2021-2032)
Figure 25. Rest of Middle East New Tea Revenue (USD Million) By Region (2021-2032)
Figure 26. South Africa New Tea Revenue (USD Million) By Region (2021-2032)
Figure 27. Africa New Tea Revenue (USD Million) By Region (2021-2032)
Figure 28. North America New Tea Revenue (USD Million) By Type (2021-2032)
Figure 29. North America New Tea Revenue (USD Million) By Application (2021-2032)
Figure 30. North America New Tea Revenue (USD Million) By Product (2021-2032)
Figure 31. Europe New Tea Revenue (USD Million) By Type (2021-2032)
Figure 32. Europe New Tea Revenue (USD Million) By Application (2021-2032)
Figure 33. Europe New Tea Revenue (USD Million) By Product (2021-2032)
Figure 34. Asia Pacific New Tea Revenue (USD Million) By Type (2021-2032)
Figure 35. Asia Pacific New Tea Revenue (USD Million) By Application (2021-2032)
Figure 36. Asia Pacific New Tea Revenue (USD Million) By Product (2021-2032)
Figure 37. South America New Tea Revenue (USD Million) By Type (2021-2032)
Figure 38. South America New Tea Revenue (USD Million) By Application (2021-2032)
Figure 39. South America New Tea Revenue (USD Million) By Product (2021-2032)
Figure 40. Middle East and Africa New Tea Revenue (USD Million) By Type (2021-2032)
Figure 41. Middle East and Africa New Tea Revenue (USD Million) By Application (2021-2032)
Figure 42. Middle East and Africa New Tea Revenue (USD Million) By Product (2021-2032)
By Type
Cheese Tea
Fruit-based Tea
Others
By Sales Channel
Online
Offline
Countries Analyzed
North America (US, Canada, Mexico)
Europe (Germany, UK, France, Spain, Italy, Russia, Rest of Europe)
Asia Pacific (China, India, Japan, South Korea, Australia, South East Asia, Rest of Asia)
South America (Brazil, Argentina, Rest of South America)
Middle East and Africa (Saudi Arabia, UAE, Rest of Middle East, South Africa, Egypt, Rest of Africa)
