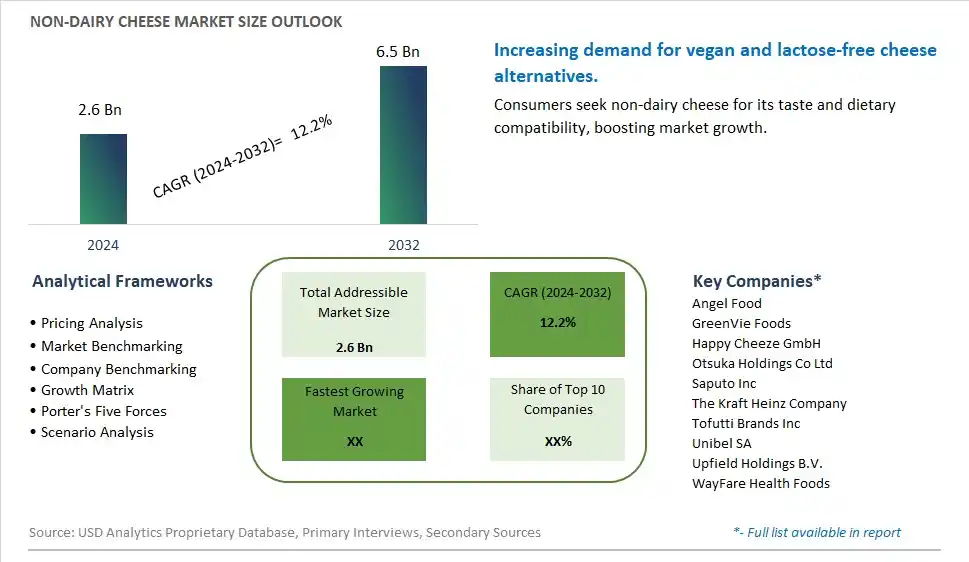
Global Non-Dairy Cheese Market Size is valued at $2.6 Billion in 2024 and is forecast to register a growth rate (CAGR) of 12.2% to reach $6.5 Billion by 2032.
The global Non-Dairy Cheese Market Comprehensive Study analyzes and forecasts the market size across 6 regions and 24 countries for diverse segments -By Source (Soy Milk, Almond Milk, Coconut Milk, Others), By Product (Mozzarella, Parmesan, Cheddar, Others), By Distribution Channel (Specialty Stores, Supermarkets/Hypermarkets, Convenience Store, Online Retail Stores, Others)
An Introduction to Non-Dairy Cheese Market
The Non-Dairy Cheese Market focuses on the production and sale of cheese alternatives made from plant-based ingredients, catering to consumers seeking vegan, lactose-free, and dairy-free options. The market is driven by increasing prevalence of lactose intolerance and dairy allergies, rising popularity of vegan and plant-based diets, and growing awareness about the environmental impact of dairy production. Additionally, innovations in cheese formulations and the expansion of product offerings support market growth.
Non Dairy Cheese Competitive Landscape
The market report analyses the leading companies in the industry including Angel Food, GreenVie Foods, Happy Cheeze GmbH, Otsuka Holdings Co Ltd, Saputo Inc, The Kraft Heinz Company, Tofutti Brands Inc, Unibel SA, Upfield Holdings B.V., WayFare Health Foods, and Others.
Non Dairy Cheese Market Dynamics
Non-Dairy Cheese Market Trend: Increasing Popularity of Plant-Based Diets
The most prominent trend in the Non-Dairy Cheese Market is the increasing popularity of plant-based diets. Consumers are seeking dairy-free alternatives to traditional cheese, driven by dietary restrictions, ethical considerations, and health concerns. This trend is fueled by the growing interest in veganism and the desire for sustainable and cruelty-free food products.
Non-Dairy Cheese Market Driver: Health Consciousness and Lactose Intolerance
A key driver in the Non-Dairy Cheese Market is health consciousness and lactose intolerance. As more individuals focus on improving their health and managing lactose intolerance, there is a rising demand for non-dairy cheese that provides similar taste and texture without the digestive issues associated with dairy. This demand supports market growth as consumers seek dairy-free and health-enhancing cheese alternatives.
Non-Dairy Cheese Market Opportunity: Innovation in Flavor and Texture
One significant opportunity in the Non-Dairy Cheese Market lies in innovation in flavor and texture. Companies can develop new non-dairy cheese products that closely mimic the taste and mouthfeel of traditional cheese, catering to consumers seeking authentic cheese experiences. By offering diverse and high-quality non-dairy cheese options, manufacturers can attract a broader consumer base and drive market growth.
Non-Dairy Cheese Market Share Analysis- Largest Segment by Source
In the Non-Dairy Cheese Market, Almond Milk is the largest segment by source. This dominance is due to the widespread popularity of almond milk among consumers seeking dairy alternatives. Almond milk-based cheese is favored for its nutty flavor and creamy texture, which closely mimics traditional dairy cheese. The high demand for almond milk as a base for non-dairy cheese, coupled with the growing trend of plant-based diets, positions it as the largest segment in the non-dairy cheese market.
Non-Dairy Cheese Market Share Analysis- Poised to Grow Fastest Over the Next Five Years by Product
In the Non-Dairy Cheese Market, Mozzarella is poised to grow the fastest over the next five years. This growth is driven by the increasing demand for versatile and familiar cheese alternatives that can be used in a variety of dishes, such as pizzas and salads. Mozzarella, with its melty texture and mild flavor, is a popular choice among consumers transitioning to non-dairy diets. Innovations in dairy-free mozzarella that closely replicate the taste and texture of traditional cheese are expected to further accelerate its growth, making it the fastest-growing product segment in the market.
Non-Dairy Cheese Market Share Analysis- Largest Segment by Distribution Channel
In the Non-Dairy Cheese Market, Supermarkets/Hypermarkets is the largest distribution channel segment. This dominance is due to the high foot traffic and extensive product selection that supermarkets and hypermarkets offer. These retail outlets provide consumers with convenient access to a wide range of non-dairy cheese products, from established brands to new market entrants. The large-scale distribution capabilities and the ability to cater to diverse consumer needs make supermarkets and hypermarkets the largest distribution channel in the non-dairy cheese market.
Non Dairy Cheese Market Segmentation
By Source
Soy Milk
Almond Milk
Coconut Milk
Others
By Product
Mozzarella
Parmesan
Cheddar
Others
By Distribution Channel
Specialty Stores
Supermarkets/Hypermarkets
Convenience Store
Online Retail Stores
Others
Countries Analyzed
North America (US, Canada, Mexico)
Europe (Germany, UK, France, Spain, Italy, Russia, Rest of Europe)
Asia Pacific (China, India, Japan, South Korea, Australia, South East Asia, Rest of Asia)
South America (Brazil, Argentina, Rest of South America)
Middle East and Africa (Saudi Arabia, UAE, Rest of Middle East, South Africa, Egypt, Rest of Africa)
Non Dairy Cheese Companies Profiled in the Study
Angel Food
GreenVie Foods
Happy Cheeze GmbH
Otsuka Holdings Co Ltd
Saputo Inc
The Kraft Heinz Company
Tofutti Brands Inc
Unibel SA
Upfield Holdings B.V.
WayFare Health Foods
*- List Not Exhaustive
Chapter 1. TABLE OF CONTENTS
Chapter 2. Introduction to Non Dairy Cheese Market
2.1. Market Overview
2.2. Key Statistics and Report Highlights
2.3. Scope of the Comprehensive Study
2.3.1. Market Definition
2.3.2 Countries and Regions Covered
2.3.3 Research Objective
2.3.4 Units, Currency, and Conversions
2.3.5 Industry Value Chain
2.4. Key Market Segments
2.5. Key Companies
2.6. Study Period
Chapter 3. Strategic Analysis Review
3.1. Non Dairy Cheese Pricing Analysis and Forecast
3.2. Porter’s Five Forces
3.3. Market Ecosystem
3.4. SWOT Analysis
3.5. Regulatory Scenario
3.3. Effects of Inflation, Russia-Ukraine War, moderating economic growth, and other macroeconomic factors
Chapter 4. Competitive Landscape
4.1. Market Share Analysis
4.1.1. Global Non Dairy Cheese Market Share by Company, 2023
4.1.2. Product Offerings of Leading Non Dairy Cheese Companies
4.2. Market Entropy
4.2.1. New Product Launches in the Industry
4.2.2. Mergers, Acquisitions, Joint ventures, and Partnerships
4.3. Key Strategies and Best Practices
Chapter 5. Global Market Projections: Best, Reference, and Low Case Scenarios
5.1. Growth Analysis- Case Scenario Definitions
5.2. Low Growth Case Scenario Forecasts
5.3. Reference Growth Case Scenario Forecasts
5.4. High Growth Case Scenario Forecasts
Chapter 6. Market Dynamics
6.1. Non Dairy Cheese Market Drivers
6.2. Non Dairy Cheese Market Challenges
6.6. Non Dairy Cheese Market Opportunities
6.4. Non Dairy Cheese Market Trends
Chapter 7. Global Non Dairy Cheese Market Outlook Trends
7.1. Global Non Dairy Cheese Revenue (USD Million) and CAGR (%) by Type (2021-2032)
7.2. Global Non Dairy Cheese Revenue (USD Million) and CAGR (%) by Application (2021-2032)
7.3. Global Non Dairy Cheese Revenue (USD Million) and CAGR (%) by Product (2021-2032)
By Source
Soy Milk
Almond Milk
Coconut Milk
Others
By Product
Mozzarella
Parmesan
Cheddar
Others
By Distribution Channel
Specialty Stores
Supermarkets/Hypermarkets
Convenience Store
Online Retail Stores
Others
Chapter 8. Global Non Dairy Cheese Regional Analysis and Outlook
8.1. Global Non Dairy Cheese Revenue (USD Million) By Regions (2021- 2032)
8.2. North America Non Dairy Cheese Revenue (USD Million) by Country (2021-2032)
8.2.1. United States Non Dairy Cheese Regional Analysis and Outlook
8.2.2. Canada Non Dairy Cheese Regional Analysis and Outlook
8.2.3. Mexico Non Dairy Cheese Regional Analysis and Outlook
8.3. Europe Non Dairy Cheese Revenue (USD Million), by Country (2021-2032)
8.3.1. Germany Non Dairy Cheese Regional Analysis and Outlook
8.3.2. France Non Dairy Cheese Regional Analysis and Outlook
8.3.3. United Kingdom Non Dairy Cheese Regional Analysis and Outlook
8.3.4. Spain Non Dairy Cheese Regional Analysis and Outlook
8.3.5. Italy Non Dairy Cheese Regional Analysis and Outlook
8.3.6. Russia Non Dairy Cheese Regional Analysis and Outlook
8.3.7. Rest of Europe Non Dairy Cheese Regional Analysis and Outlook
8.4. Asia Pacific Non Dairy Cheese Revenue (USD Million) by Country (2021-2032)
8.4.1. China Non Dairy Cheese Regional Analysis and Outlook
8.4.2. Japan Non Dairy Cheese Regional Analysis and Outlook
8.4.3. India Non Dairy Cheese Regional Analysis and Outlook
8.4.4. South Korea Non Dairy Cheese Regional Analysis and Outlook
8.4.5. Australia Non Dairy Cheese Regional Analysis and Outlook
8.4.6. South East Asia Non Dairy Cheese Regional Analysis and Outlook
8.4.7. Rest of Asia Pacific Non Dairy Cheese Regional Analysis and Outlook
8.5. South America Non Dairy Cheese Revenue (USD Million), by Country (2021-2032)
8.5.1. Brazil Non Dairy Cheese Regional Analysis and Outlook
8.5.2. Argentina Non Dairy Cheese Regional Analysis and Outlook
8.5.3. Rest of South America Non Dairy Cheese Regional Analysis and Outlook
8.6. Middle East and Africa Non Dairy Cheese Revenue (USD Million) by Country (2021-2032)
8.6.1. Middle East Non Dairy Cheese Regional Analysis and Outlook
8.6.2. Africa Non Dairy Cheese Regional Analysis and Outlook
Chapter 9. North America Non Dairy Cheese Analysis and Outlook
9.1. North America Non Dairy Cheese Revenue (USD Million) by Segments (2021-2032)
9.1.1. North America Non Dairy Cheese Revenue (USD Million) by Type (2021-2032)
9.1.2. North America Non Dairy Cheese Revenue (USD Million) by Application (2021-2032)
9.1.3. North America Non Dairy Cheese Revenue (USD Million) by Product (2021-2032)
By Source
Soy Milk
Almond Milk
Coconut Milk
Others
By Product
Mozzarella
Parmesan
Cheddar
Others
By Distribution Channel
Specialty Stores
Supermarkets/Hypermarkets
Convenience Store
Online Retail Stores
Others
Chapter 10. Europe Non Dairy Cheese Analysis and Outlook
10.1. Europe Non Dairy Cheese Revenue (USD Million), by Segments (USD Million) (2021-2032)
10.1.1. Europe Non Dairy Cheese Revenue (USD Million) by Type (2021-2032)
10.1.2. Europe Non Dairy Cheese Revenue (USD Million) by Application (2021-2032)
10.1.3. Europe Non Dairy Cheese Revenue (USD Million) by Product (2021-2032)
By Source
Soy Milk
Almond Milk
Coconut Milk
Others
By Product
Mozzarella
Parmesan
Cheddar
Others
By Distribution Channel
Specialty Stores
Supermarkets/Hypermarkets
Convenience Store
Online Retail Stores
Others
Chapter 11. Asia Pacific Non Dairy Cheese Analysis and Outlook
11.1. Asia Pacific Non Dairy Cheese Revenue (USD Million), and Revenue (USD Million) by Segments (2021-2032)
11.1.1. Asia Pacific Non Dairy Cheese Revenue (USD Million) by Type (2021-2032)
11.1.2. Asia Pacific Non Dairy Cheese Revenue (USD Million) by Application (2021-2032)
11.1.3. Asia Pacific Non Dairy Cheese Revenue (USD Million) by Product (2021-2032)
By Source
Soy Milk
Almond Milk
Coconut Milk
Others
By Product
Mozzarella
Parmesan
Cheddar
Others
By Distribution Channel
Specialty Stores
Supermarkets/Hypermarkets
Convenience Store
Online Retail Stores
Others
Chapter 12. South America Non Dairy Cheese Analysis and Outlook
12.1. South America Non Dairy Cheese Revenue (USD Million), by Segments (2021-2032)
12.1.1. South America Non Dairy Cheese Revenue (USD Million) by Type (2021-2032)
12.1.2. South America Non Dairy Cheese Revenue (USD Million) by Application (2021-2032)
12.1.3. South America Non Dairy Cheese Revenue (USD Million) by Product (2021-2032)
By Source
Soy Milk
Almond Milk
Coconut Milk
Others
By Product
Mozzarella
Parmesan
Cheddar
Others
By Distribution Channel
Specialty Stores
Supermarkets/Hypermarkets
Convenience Store
Online Retail Stores
Others
Chapter 13. Middle East and Africa Non Dairy Cheese Analysis and Outlook
13.1. Middle East and Africa Non Dairy Cheese Revenue (USD Million), by Segments (2021-2032)
13.1.1. Middle East and Africa Non Dairy Cheese Revenue (USD Million) by Type (2021-2032)
13.1.2. Middle East and Africa Non Dairy Cheese Revenue (USD Million) by Application (2021-2032)
13.1.3. Middle East and Africa Non Dairy Cheese Revenue (USD Million) by Product (2021-2032)
By Source
Soy Milk
Almond Milk
Coconut Milk
Others
By Product
Mozzarella
Parmesan
Cheddar
Others
By Distribution Channel
Specialty Stores
Supermarkets/Hypermarkets
Convenience Store
Online Retail Stores
Others
Chapter 14. Non Dairy Cheese Company Profiles
14.1 Business Overview
14.2 Product Profiles
14.3 SWOT Profiles
14.5 Recent Developments
14.6 Financial Profile
List of Companies
Angel Food
GreenVie Foods
Happy Cheeze GmbH
Otsuka Holdings Co Ltd
Saputo Inc
The Kraft Heinz Company
Tofutti Brands Inc
Unibel SA
Upfield Holdings B.V.
WayFare Health Foods
15. Methodology and Data Sources
15.1 Customization Offerings
15.2 Subscription Services
15.3 Related Reports
15.4 Publisher Expertise
LIST OF TABLES
Table 1 Market Segmentation Analysis
Table 2 Global Non Dairy Cheese Market Share of Leading Companies, 2023
Table 3 Product Offerings of Leading Companies
Table 4 Low Growth Scenario Forecasts
Table 5 Reference Case Growth Scenario
Table 6 High Growth Case Scenario
Table 7 Global Non Dairy Cheese Revenue (USD Million) And CAGR (%) By Type (2021-2032)
Table 8 Global Non Dairy Cheese Revenue (USD Million) And CAGR (%) By Application (2021-2032)
Table 9 Global Non Dairy Cheese Revenue (USD Million) And CAGR (%) By Product (2021-2032)
Table 10 Global Non Dairy Cheese Market Revenue (USD Million) By Regions (2021-2032)
Table 11 Global Non Dairy Cheese Market Share (%) By Regions (2021-2032)
Table 12 North America Non Dairy Cheese Revenue (USD Million) By Country (2021-2032)
Table 13 Europe Non Dairy Cheese Revenue (USD Million) By Country (2021-2032)
Table 14 Asia Pacific Non Dairy Cheese Revenue (USD Million) By Country (2021-2032)
Table 15 South America Non Dairy Cheese Revenue (USD Million) By Country (2021-2032)
Table 16 Middle East and Africa Non Dairy Cheese Revenue (USD Million) By Region (2021-2032)
Table 17 North America Non Dairy Cheese Revenue (USD Million) By Type (2021-2032)
Table 18 North America Non Dairy Cheese Revenue (USD Million) By Application (2021-2032)
Table 19 North America Non Dairy Cheese Revenue (USD Million) By Product (2021-2032)
Table 20 Europe Non Dairy Cheese Revenue (USD Million) By Type (2021-2032)
Table 21 Europe Non Dairy Cheese Revenue (USD Million) By Application (2021-2032)
Table 22 Europe Non Dairy Cheese Revenue (USD Million) By Product (2021-2032)
Table 23 Asia Pacific Non Dairy Cheese Revenue (USD Million) By Type (2021-2032)
Table 24 Asia Pacific Non Dairy Cheese Revenue (USD Million) By Application (2021-2032)
Table 25 Asia Pacific Non Dairy Cheese Revenue (USD Million) By Product (2021-2032)
Table 26 South America Non Dairy Cheese Revenue (USD Million) By Type (2021-2032)
Table 27 South America Non Dairy Cheese Revenue (USD Million) By Application (2021-2032)
Table 28 South America Non Dairy Cheese Revenue (USD Million) By Product (2021-2032)
Table 29 Middle East and Africa Non Dairy Cheese Revenue (USD Million) By Type (2021-2032)
Table 30 Middle East and Africa Non Dairy Cheese Revenue (USD Million) By Application (2021-2032)
Table 31 Middle East and Africa Non Dairy Cheese Revenue (USD Million) By Product (2021-2032)
LIST OF FIGURES
Figure 1. Market Scope
Figure 2. Pricing Forecasts Per Unit, 2023- 2032
Figure 3. Porter’s Five Forces
Figure 4. Global Non Dairy Cheese Market Revenue (USD Million) By Regions (2021-2032)
Figure 5. Global Non Dairy Cheese Market Share (%) By Regions (2023)
Figure 6. North America Non Dairy Cheese Revenue (USD Million) By Country (2021-2032)
Figure 7. United States Non Dairy Cheese Revenue (USD Million) By Country (2021-2032)
Figure 8. Canada Non Dairy Cheese Revenue (USD Million) By Country (2021-2032)
Figure 9. Mexico Non Dairy Cheese Revenue (USD Million) By Country (2021-2032)
Figure 10. Europe Non Dairy Cheese Revenue (USD Million) By Country (2021-2032)
Figure 11. Germany Non Dairy Cheese Revenue (USD Million) By Country (2021-2032)
Figure 12. France Non Dairy Cheese Revenue (USD Million) By Country (2021-2032)
Figure 13. United Kingdom Non Dairy Cheese Revenue (USD Million) By Country (2021-2032)
Figure 14. Spain Non Dairy Cheese Revenue (USD Million) By Country (2021-2032)
Figure 15. Italy Non Dairy Cheese Revenue (USD Million) By Country (2021-2032)
Figure 16. Russia Non Dairy Cheese Revenue (USD Million) By Country (2021-2032)
Figure 17. Rest of Europe Non Dairy Cheese Revenue (USD Million) By Country (2021-2032)
Figure 11. Asia Pacific Non Dairy Cheese Revenue (USD Million) By Country (2021-2032)
Figure 12. China Non Dairy Cheese Revenue (USD Million) By Country (2021-2032)
Figure 13. Japan Non Dairy Cheese Revenue (USD Million) By Country (2021-2032)
Figure 14. India Non Dairy Cheese Revenue (USD Million) By Country (2021-2032)
Figure 15. South Korea Non Dairy Cheese Revenue (USD Million) By Country (2021-2032)
Figure 16. Australia Non Dairy Cheese Revenue (USD Million) By Country (2021-2032)
Figure 17. South East Asia Non Dairy Cheese Revenue (USD Million) By Country (2021-2032)
Figure 18. South America Non Dairy Cheese Revenue (USD Million) By Country (2021-2032)
Figure 19. Brazil Non Dairy Cheese Revenue (USD Million) By Country (2021-2032)
Figure 20. Argentina Non Dairy Cheese Revenue (USD Million) By Country (2021-2032)
Figure 21. Rest of Asia Pacific Non Dairy Cheese Revenue (USD Million) By Country (2021-2032)
Figure 22. Middle East and Africa Non Dairy Cheese Revenue (USD Million) By Region (2021-2032)
Figure 23. Saudi Arabia Non Dairy Cheese Revenue (USD Million) By Region (2021-2032)
Figure 24. The UAE Non Dairy Cheese Revenue (USD Million) By Region (2021-2032)
Figure 25. Rest of Middle East Non Dairy Cheese Revenue (USD Million) By Region (2021-2032)
Figure 26. South Africa Non Dairy Cheese Revenue (USD Million) By Region (2021-2032)
Figure 27. Africa Non Dairy Cheese Revenue (USD Million) By Region (2021-2032)
Figure 28. North America Non Dairy Cheese Revenue (USD Million) By Type (2021-2032)
Figure 29. North America Non Dairy Cheese Revenue (USD Million) By Application (2021-2032)
Figure 30. North America Non Dairy Cheese Revenue (USD Million) By Product (2021-2032)
Figure 31. Europe Non Dairy Cheese Revenue (USD Million) By Type (2021-2032)
Figure 32. Europe Non Dairy Cheese Revenue (USD Million) By Application (2021-2032)
Figure 33. Europe Non Dairy Cheese Revenue (USD Million) By Product (2021-2032)
Figure 34. Asia Pacific Non Dairy Cheese Revenue (USD Million) By Type (2021-2032)
Figure 35. Asia Pacific Non Dairy Cheese Revenue (USD Million) By Application (2021-2032)
Figure 36. Asia Pacific Non Dairy Cheese Revenue (USD Million) By Product (2021-2032)
Figure 37. South America Non Dairy Cheese Revenue (USD Million) By Type (2021-2032)
Figure 38. South America Non Dairy Cheese Revenue (USD Million) By Application (2021-2032)
Figure 39. South America Non Dairy Cheese Revenue (USD Million) By Product (2021-2032)
Figure 40. Middle East and Africa Non Dairy Cheese Revenue (USD Million) By Type (2021-2032)
Figure 41. Middle East and Africa Non Dairy Cheese Revenue (USD Million) By Application (2021-2032)
Figure 42. Middle East and Africa Non Dairy Cheese Revenue (USD Million) By Product (2021-2032)
By Source
Soy Milk
Almond Milk
Coconut Milk
Others
By Product
Mozzarella
Parmesan
Cheddar
Others
By Distribution Channel
Specialty Stores
Supermarkets/Hypermarkets
Convenience Store
Online Retail Stores
Others
Countries Analyzed
North America (US, Canada, Mexico)
Europe (Germany, UK, France, Spain, Italy, Russia, Rest of Europe)
Asia Pacific (China, India, Japan, South Korea, Australia, South East Asia, Rest of Asia)
South America (Brazil, Argentina, Rest of South America)
Middle East and Africa (Saudi Arabia, UAE, Rest of Middle East, South Africa, Egypt, Rest of Africa)
