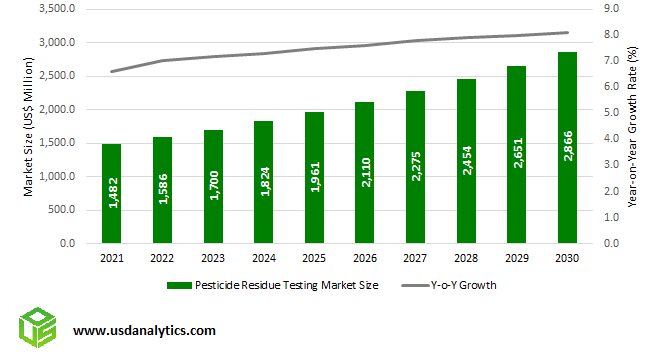
The global Pesticide Residue Testing Market Size is estimated to be $1.72 Billion in 2023 and is poised to register 7.18% growth for the forecast period from 2023 to 2030.
Advancements in Testing Technologies, Implementation of Stringent Food Safety Regulations, Consumer awareness towards food safety and quality issues, and others are among the main market trends
Pesticide Residue Testing Market Analysis
The pesticide residue testing process identifies the pesticide residue levels in food products through different chemical and microbiological analyses to minimize the risk of negative health impacts of foods consumed. The tests are designed to mitigate risks in the manufacturing process, enhance productivity across the value chain, and assist in overall improvement in quality. Food or feed may contain a pesticide chemical residue and testing the amount residue level of a specific pesticide chemical is required to ensure it is below the maximum levels permitted by governments.
Pesticides are widely used in agriculture for controlling pests. The chemical compounds used to kill, repel or control weeds, animals, and microorganisms are widely used on agricultural products, to maximize crop output and to protect produce during storage and transportation. However, the Overuse of pesticides can lead to dangerous levels of hazardous chemicals entering the food chain.
The rising concerns about food-borne illness have led to the constant evolution of regulations governing food safety standards. Further, as consumers shift towards eating a diet rich in fruits and vegetables, which is essential for developing and maintaining a healthy body, it is essential to ensure no illegal pesticide residues are included in foods.
According to the FAO – Food and Agricultural Organization, the global food system will need to meet an expected 35% rise in demand by 2030. As the global food supply increases, the demand for testing systems across the globe is becoming more important.
Sustainable food production requires the use of effective pest intervention practices. Fresh fruit and vegetables are being consumed in increasing quantities and it is this fresh produce that is most susceptible to pesticide residues. Beverages, Cereals, Grains, Legumes, Dairy, Fish, Fruit, Meat, and Vegetables are widely tested for the presence of pesticides.
Pesticide Residue Testing Market Outlook to 2030
Market Dynamics
Market Trend- Advancements in Testing Technologies
LC-MS/GC-MS, HPLC, gas chromatography, immunoassay, and other test kits are the key technologies widely used for testing residues of organochlorines, organophosphates, organonitrogens & carbamates, pyrethroids, fumigants, and others in food. The pesticide residues are usually analyzed by the following methods: Gas Chromatography–Mass Spectrometry Coupled (GC-MS), especially for volatile compounds in complex samples, and Liquid Chromatography – Mass Spectrometry Coupled (LC-MS), suitable for non-volatile compounds (thermally unstable molecules).
Of these, liquid chromatography with mass spectrometry (LC-MS) has high sensitivity and is useful across wide applications. Further, High-Performance Liquid Chromatography (HPLC) is also one of the largest technologies used for pesticide residue detection in food and beverages.
Companies are significantly investing in testing for residues of various types of insecticides, fungicides, herbicides, and acaricides across raw agricultural products, processed foods, plant tissues, spices, herbs, nutraceuticals, soils, and water. Significant R&D investment is being spent to generate accurate and timely service at the lowest cost possible. Tests using fewer samples for pesticide testing and analysis are widely being developed.
Companies such as Thermo Fischer offer start-to-finish workflows using methods such as liquid chromatography-mass spectrometry (LC-MS) solutions that offer enhanced productivity and improved efficiency for targeted and non-targeted screening of pesticide residues in food matrices. Further, they are widely marketing automated sample extraction techniques such as accelerated solvent extraction, automated solid phase extraction, and automated evaporation.
Market Driver- Implementation of Stringent Food Safety Regulations
Food safety regulations across countries are becoming stringent as governments emphasize more on healthy products for their citizens. Different countries have different pesticide regulations. Regulatory bodies such as the United States Department of Agriculture (USDA) and the European Food Safety Authority (EFSA) enforce stringent guidelines for food safety testing. MRL (Maximum residue limit/ maximum residue levels) is the maximum concentration of a pesticide residue (expressed as mg/kg), to be legally permitted in or in food commodities and animal feeds. However, international standard sources such as Codex Alimentarius, Global MRL database, New Zealand (Maximum Residue Limits of Agricultural Compounds) Food Standards, USEPA pesticide residue tolerances, and regional sources such as EU MRL database, Australia Agricultural and Veterinary Chemicals Code Instrument No. 4 (MRL Standard), others are widely used as standards in trading.
Market Segmentation
The global Pesticide Residue Testing Market is segmented into Types, Applications, and Countries.
Herbicides Residue testing is widely done worldwide, with a 41% share in 2022
Changing climatic conditions, increasing demand for foods, declining arable lands, and emphasis on yield are encouraging farmers to opt for herbicides widely. Used to kill or inhibit the growth of unwanted plants, herbicides are easy to spray and save labor costs during farming.
Herbicides such as glyphosate 2, 4-D, glufosinate-ammonium, paraquat, atrazine pendimethalin, dicamba, metolachlor, and others are widely used in the industry. Herbicides such as atrazine, simazine, linuron, diuron, clopyralid, fomesafen and others applied may still be active in the following season and accordingly, stringent testing must be conducted to assess the residue levels in end products.
Despite various government policies to control the usage of the pesticide, herbicides are widely used for boosting yield in crops. However, the excessive use of herbicides results in residues in raw and processed foods.
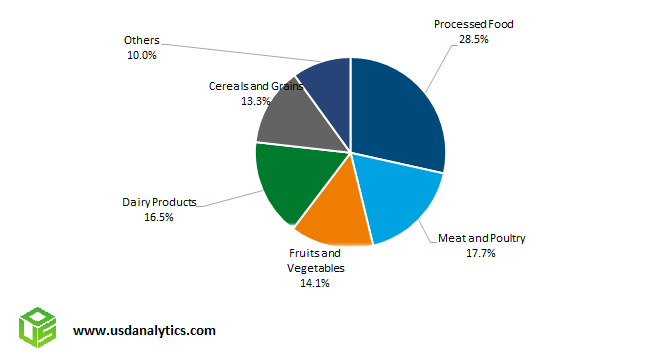
Processed Food is the fastest-growing industry in the Pesticide Residue Testing market worldwide
The processed foods market is one of the high-prospect markets in the food and beverages industry, driven by a growing middle-class population, consumer preference for quick meal solutions, clean labeling foods, and e-commerce growth. The trend towards these foods is influenced by macroeconomic factors such as disposable incomes, demographic factors such as young population growth, and food preferences.
The organized retail market continues to grow steadily despite the penetration of online channels. RTE dinner foods are largely made available through organized retail stores as most consumers find these stores convenient for shopping. Urbanization, and increasing disposable incomes in emerging countries coupled with the rapid expansion of supermarkets in these markets encourage market growth.
Among different product types, frozen foods continue to dominate the global market, driven by a wide range of products marketed in the category, the ability to retain freshness, and marketing in diverse flavors and ingredients.
Developing countries with a large youth population base are witnessing a tendency to snack frequently and interest in on-the-go foods. Further, millennial often prefers widely on protein-rich creamy new foods, which supports the consumption of dairy foods. Further, the working-class women population is increasing in the countries, and busy lifestyles support the consumption of prepared foods, which typically include dairy-based butter, cheese, and others.
By Region, North America accounts for the highest market size for the period 2023 to 2030
Driven by the US, North America dominates the global Pesticide Residue Testing market with a 34.7% market share.
United States- The Federal Environmental Protection Agency (EPA), the Food and Drug Administration (FDA), and the US Department of Agriculture (USDA) all play a role in regulating and measuring pesticides in food. In the country, food recalls often are observed due to which both producers and regulators emphasize more on food safety more, which supports the market for residue testing.
Major outbreaks of foodborne diseases, food recalls, health-conscious customers, and intense competition among food companies are resulting in the establishment of new food safety standards and stringent implementation during different stages of the value chain. Accordingly, the country has a high concentration of food testing companies.
Nutritious, and high-quality foods have strong demand in the country, and with the wide domination of processed foods, ready-to-consume products, fresh fruits, and meat, the demand for testing is significant in the country.
Segmentation
By Type
- Herbicides
- Insecticides
- Fungicides
- Others
By Application
- Processed Food
- Meat and Poultry
- Fruits and Vegetables
- Dairy Products
- Cereals and Grains
- Others
By Region
- North America (United States, Canada, Mexico)
- Europe (Germany, France, United Kingdom, Spain, Italy, Others)
- Asia Pacific (China, India, Japan, South Korea, Australia, Others)
- Latin America (Brazil, Argentina, Others)
- Middle East and Africa (Saudi Arabia, UAE, Kuwait, Other Middle East, South Africa, Nigeria, Other Africa)
Key Players
Leading companies profiled in the study include-
- SGS SA
- Bureau Veritas SA
- Eurofins Scientific SE
- Assure Quality Limited
- Intertek Group Plc.
- ALS Limited
- SCS Global Services
- Silliker Inc
- Symbio Laboratories
- Microbac Laboratories Inc
Pesticide Residue Testing Market Outlook 2023
1 Market Overview
1.1 Introduction to Pesticide Residue Testing Market
1.2 Scope of the Study
1.3 Research Objective
1.3.1 Key Market Scope and Segments
1.3.2 Players Covered
1.3.3 Years Considered
2 Executive Summary
2.1 2023 Pesticide Residue Testing Industry- Market Statistics
3 Market Dynamics
3.1 Market Drivers
3.2 Market Challenges
3.3 Market Opportunities
3.4 Market Trends
4 Market Factor Analysis
4.1 Porter’s Five Forces
4.2 Market Entropy
4.2.1 Global Pesticide Residue Testing Market Companies with Area Served
4.2.2 Products Offerings Global Pesticide Residue Testing Market
5 COVID-19 Impact Analysis and Outlook Scenarios
5.1.1 Covid-19 Impact Analysis
5.1.2 Post-COVID-19 Scenario- Low Growth Case
5.1.3 Post-COVID-19 Scenario- Reference Growth Case
5.1.4 Post-COVID-19 Scenario- Low Growth Case
6 Global Pesticide Residue Testing Market Trends
6.1 Global Pesticide Residue Testing Revenue (USD Million) and CAGR (%) by Type (2018-2028)
6.2 Global Pesticide Residue Testing Revenue (USD Million) and CAGR (%) by Applications (2018-2028)
6.3 Global Pesticide Residue Testing Revenue (USD Million) and CAGR (%) by Regions (2018-2028)
7 Global Pesticide Residue Testing Market Revenue (USD Million) by Type, and Applications (2018-2022)
7.1 Global Pesticide Residue Testing Revenue (USD Million) by Type (2018-2022)
7.1.1 Global Pesticide Residue Testing Revenue (USD Million), Market Share (%) by Type (2018-2022)
7.2 Global Pesticide Residue Testing Revenue (USD Million) by Applications (2018-2022)
7.2.1 Global Pesticide Residue Testing Revenue (USD Million), Market Share (%) by Applications (2018-2022)
8 Global Pesticide Residue Testing Development Regional Status and Outlook
8.1 Global Pesticide Residue Testing Revenue (USD Million) By Regions (2018-2022)
8.2 North America Pesticide Residue Testing Revenue (USD Million) by Type, and Application (2018-2022)
8.2.1 North America Pesticide Residue Testing Revenue (USD Million) by Country (2018-2022)
8.2.2 North America Pesticide Residue Testing Revenue (USD Million) by Type (2018-2022)
8.2.3 North America Pesticide Residue Testing Revenue (USD Million) by Applications (2018-2022)
8.3 Europe Pesticide Residue Testing Revenue (USD Million), by Type, and Applications (USD Million) (2018-2022)
8.3.1 Europe Pesticide Residue Testing Revenue (USD Million), by Country (2018-2022)
8.3.2 Europe Pesticide Residue Testing Revenue (USD Million) by Type (2018-2022)
8.3.3 Europe Pesticide Residue Testing Revenue (USD Million) by Applications (2018-2022)
8.4 Asia Pacific Pesticide Residue Testing Revenue (USD Million), and Revenue (USD Million) by Type, and Applications (2018-2022)
8.4.1 Asia Pacific Pesticide Residue Testing Revenue (USD Million) by Country (2018-2022)
8.4.2 Asia Pacific Pesticide Residue Testing Revenue (USD Million) by Type (2018-2022)
8.4.3 Asia Pacific Pesticide Residue Testing Revenue (USD Million) by Applications (2018-2022)
8.5 South America Pesticide Residue Testing Revenue (USD Million), by Type, and Applications (2018-2022)
8.5.1 South America Pesticide Residue Testing Revenue (USD Million), by Country (2018-2022)
8.5.2 South America Pesticide Residue Testing Revenue (USD Million) by Type (2018-2022)
8.5.3 South America Pesticide Residue Testing Revenue (USD Million) by Applications (2018-2022)
8.6 Middle East and Africa Pesticide Residue Testing Revenue (USD Million), by Type, Technology, Application, Thickness (2018-2022)
8.6.1 Middle East and Africa Pesticide Residue Testing Revenue (USD Million) by Country (2018-2022)
8.6.2 Middle East and Africa Pesticide Residue Testing Revenue (USD Million) by Type (2018-2022)
8.6.3 Middle East and Africa Pesticide Residue Testing Revenue (USD Million) by Applications (2018-2022)
9 Company Profiles
10 Global Pesticide Residue Testing Market Revenue (USD Million), by Type, and Applications (2023-2028)
10.1 Global Pesticide Residue Testing Revenue (USD Million) and Market Share (%) by Type (2023-2028)
10.1.1 Global Pesticide Residue Testing Revenue (USD Million), and Market Share (%) by Type (2023-2028)
10.2 Global Pesticide Residue Testing Revenue (USD Million) and Market Share (%) by Applications (2023-2028)
10.2.1 Global Pesticide Residue Testing Revenue (USD Million), and Market Share (%) by Applications (2023-2028)
11 Global Pesticide Residue Testing Development Regional Status and Outlook Forecast
11.1 Global Pesticide Residue Testing Revenue (USD Million) By Regions (2023-2028)
11.2 North America Pesticide Residue Testing Revenue (USD Million) by Type, and Applications (2023-2028)
11.2.1 North America Pesticide Residue Testing Revenue (USD) Million by Country (2023-2028)
11.2.2 North America Pesticide Residue Testing Revenue (USD Million), by Type (2023-2028)
11.2.3 North America Pesticide Residue Testing Revenue (USD Million), Market Share (%) by Applications (2023-2028)
11.3 Europe Pesticide Residue Testing Revenue (USD Million), by Type, and Applications (2023-2028)
11.3.1 Europe Pesticide Residue Testing Revenue (USD Million), by Country (2023-2028)
11.3.2 Europe Pesticide Residue Testing Revenue (USD Million), by Type (2023-2028)
11.3.3 Europe Pesticide Residue Testing Revenue (USD Million), by Applications (2023-2028)
11.4 Asia Pacific Pesticide Residue Testing Revenue (USD Million) by Type, and Applications (2023-2028)
11.4.1 Asia Pacific Pesticide Residue Testing Revenue (USD Million), by Country (2023-2028)
11.4.2 Asia Pacific Pesticide Residue Testing Revenue (USD Million), by Type (2023-2028)
11.4.3 Asia Pacific Pesticide Residue Testing Revenue (USD Million), by Applications (2023-2028)
11.5 South America Pesticide Residue Testing Revenue (USD Million), by Type, and Applications (2023-2028)
11.5.1 South America Pesticide Residue Testing Revenue (USD Million), by Country (2023-2028)
11.5.2 South America Pesticide Residue Testing Revenue (USD Million), by Type (2023-2028)
11.5.3 South America Pesticide Residue Testing Revenue (USD Million), by Applications (2023-2028)
11.6 Middle East and Africa Pesticide Residue Testing Revenue (USD Million), by Type, and Applications (2023-2028)
11.6.1 Middle East and Africa Pesticide Residue Testing Revenue (USD Million), by Region (2023-2028)
11.6.2 Middle East and Africa Pesticide Residue Testing Revenue (USD Million), by Type (2023-2028)
11.6.3 Middle East and Africa Pesticide Residue Testing Revenue (USD Million), by Applications (2023-2028)
12 Methodology and Data Sources
12.1 Methodology/Research Approach
12.1.1 Research Programs/Design
12.1.2 Market Size Estimation
12.1.3 Market Breakdown and Data Triangulation
12.2 Data Sources
12.2.1 Secondary Sources
12.2.2 Primary Sources
12.3 Disclaimer
List Of Tables
Table 1 Market Segmentation Analysis
Table 2 Global Pesticide Residue Testing Market Companies with Areas Served
Table 3 Products Offerings Global Pesticide Residue Testing Market
Table 4 Low Growth Scenario Forecasts
Table 5 Reference Case Growth Scenario
Table 6 High Growth Case Scenario
Table 7 Global Pesticide Residue Testing Revenue (USD Million) And CAGR (%) By Type (2018-2028)
Table 8 Global Pesticide Residue Testing Revenue (USD Million) And CAGR (%) By Applications (2018-2028)
Table 9 Global Pesticide Residue Testing Revenue (USD Million) And CAGR (%) By Regions (2018-2028)
Table 10 Global Pesticide Residue Testing Revenue (USD Million) By Type (2018-2022)
Table 11 Global Pesticide Residue Testing Revenue Market Share (%) By Type (2018-2022)
Table 12 Global Pesticide Residue Testing Revenue (USD Million) By Applications (2018-2022)
Table 13 Global Pesticide Residue Testing Revenue Market Share (%) By Applications (2018-2022)
Table 14 Global Pesticide Residue Testing Market Revenue (USD Million) By Regions (2018-2022)
Table 15 Global Pesticide Residue Testing Market Share (%) By Regions (2018-2022)
Table 16 North America Pesticide Residue Testing Revenue (USD Million) By Country (2018-2022)
Table 17 North America Pesticide Residue Testing Revenue (USD Million) By Type (2018-2022)
Table 18 North America Pesticide Residue Testing Revenue (USD Million) By Applications (2018-2022)
Table 19 Europe Pesticide Residue Testing Revenue (USD Million) By Country (2018-2022)
Table 20 Europe Pesticide Residue Testing Revenue (USD Million) By Type (2018-2022)
Table 21 Europe Pesticide Residue Testing Revenue (USD Million) By Applications (2018-2022)
Table 22 Asia Pacific Pesticide Residue Testing Revenue (USD Million) By Country (2018-2022)
Table 23 Asia Pacific Pesticide Residue Testing Revenue (USD Million) By Type (2018-2022)
Table 24 Asia Pacific Pesticide Residue Testing Revenue (USD Million) By Applications (2018-2022)
Table 25 South America Pesticide Residue Testing Revenue (USD Million) By Country (2018-2022)
Table 26 South America Pesticide Residue Testing Revenue (USD Million) By Type (2018-2022)
Table 27 South America Pesticide Residue Testing Revenue (USD Million) By Applications (2018-2022)
Table 28 Middle East and Africa Pesticide Residue Testing Revenue (USD Million) By Region (2018-2022)
Table 29 Middle East and Africa Pesticide Residue Testing Revenue (USD Million) By Type (2018-2022)
Table 30 Middle East and Africa Pesticide Residue Testing Revenue (USD Million) By Applications (2018-2022)
Table 31 Financial Analysis
Table 32 Global Pesticide Residue Testing Revenue (USD Million) By Type (2023-2028)
Table 33 Global Pesticide Residue Testing Revenue Market Share (%) By Type (2023-2028)
Table 34 Global Pesticide Residue Testing Revenue (USD Million) By Applications (2023-2028)
Table 35 Global Pesticide Residue Testing Revenue Market Share (%) By Applications (2023-2028)
Table 36 Global Pesticide Residue Testing Market Revenue (USD Million), And Revenue (USD Million) By Regions (2023-2028)
Table 37 North America Pesticide Residue Testing Revenue (USD)By Country (2023-2028)
Table 38 North America Pesticide Residue Testing Revenue (USD Million) By Type (2023-2028)
Table 39 North America Pesticide Residue Testing Revenue (USD Million) By Applications (2023-2028)
Table 40 Europe Pesticide Residue Testing Revenue (USD Million) By Country (2023-2028)
Table 41 Europe Pesticide Residue Testing Revenue (USD Million) By Type (2023-2028)
Table 42 Europe Pesticide Residue Testing Revenue (USD Million) By Applications (2023-2028)
Table 43 Asia Pacific Pesticide Residue Testing Revenue (USD Million) By Country (2023-2028)
Table 44 Asia Pacific Pesticide Residue Testing Revenue (USD Million) By Type (2023-2028)
Table 45 Asia Pacific Pesticide Residue Testing Revenue (USD Million) By Applications (2023-2028)
Table 46 South America Pesticide Residue Testing Revenue (USD Million) By Country (2023-2028)
Table 47 South America Pesticide Residue Testing Revenue (USD Million) By Type (2023-2028)
Table 48 South America Pesticide Residue Testing Revenue (USD Million) By Applications (2023-2028)
Table 49 Middle East and Africa Pesticide Residue Testing Revenue (USD Million) By Region (2023-2028)
Table 50 Middle East and Africa Pesticide Residue Testing Revenue (USD Million) By Region (2023-2028)
Table 51 Middle East and Africa Pesticide Residue Testing Revenue (USD Million) By Type (2023-2028)
Table 52 Middle East and Africa Pesticide Residue Testing Revenue (USD Million) By Applications (2023-2028)
Table 53 Research Programs/Design for This Report
Table 54 Key Data Information from Secondary Sources
Table 55 Key Data Information from Primary Sources
List Of Figures
Figure 1 Market Scope
Figure 2 Porter’s Five Forces
Figure 3 Global Pesticide Residue Testing Revenue (USD Million) By Type (2018-2022)
Figure 4 Global Pesticide Residue Testing Revenue Market Share (%) By Type (2022)
Figure 5 Global Pesticide Residue Testing Revenue (USD Million) By Applications (2018-2022)
Figure 6 Global Pesticide Residue Testing Revenue Market Share (%) By Applications (2022)
Figure 7 Global Pesticide Residue Testing Market Revenue (USD Million) By Regions (2018-2022)
Figure 8 Global Pesticide Residue Testing Market Share (%) By Regions (2022)
Figure 9 North America Pesticide Residue Testing Revenue (USD Million) By Country (2018-2022)
Figure 10 North America Pesticide Residue Testing Revenue (USD Million) By Type (2018-2022)
Figure 11 North America Pesticide Residue Testing Revenue (USD Million) By Applications (2018-2022)
Figure 12 Europe Pesticide Residue Testing Revenue (USD Million) By Country (2018-2022)
Figure 13 Europe Pesticide Residue Testing Revenue (USD Million) By Type (2018-2022)
Figure 14 Europe Pesticide Residue Testing Revenue (USD Million) By Applications (2018-2022)
Figure 15 Asia Pacific Pesticide Residue Testing Revenue (USD Million) By Country (2018-2022)
Figure 16 Asia Pacific Pesticide Residue Testing Revenue (USD Million) By Type (2018-2022)
Figure 17 Asia Pacific Pesticide Residue Testing Revenue (USD Million) By Applications (2018-2022)
Figure 18 South America Pesticide Residue Testing Revenue (USD Million) By Country (2018-2022)
Figure 19 South America Pesticide Residue Testing Revenue (USD Million) By Type (2018-2022)
Figure 20 South America Pesticide Residue Testing Revenue (USD Million) By Applications (2018-2022)
Figure 21 Middle East and Africa Pesticide Residue Testing Revenue (USD Million) By Region (2018-2022)
Figure 22 Middle East and Africa Pesticide Residue Testing Revenue (USD Million) By Type (2018-2022)
Figure 23 Middle East and Africa Pesticide Residue Testing Revenue (USD Million) By Applications (2018-2022)
Figure 24 Global Pesticide Residue Testing Revenue (USD Million) By Type (2023-2028)
Figure 25 Global Pesticide Residue Testing Revenue Market Share (%) By Type (2028)
Figure 26 Global Pesticide Residue Testing Revenue (USD Million) By Applications (2023-2028)
Figure 27 Global Pesticide Residue Testing Revenue Market Share (%) By Applications (2028)
Figure 28 Global Pesticide Residue Testing Market Revenue (USD Million) By Regions (2023-2028)
Figure 29 North America Pesticide Residue Testing Revenue (USD Million) By Country (2023-2028)
Figure 30 North America Pesticide Residue Testing Revenue (USD Million) By Type (2023-2028)
Figure 31 North America Pesticide Residue Testing Revenue (USD Million) By Applications (2023-2028)
Figure 32 Europe Pesticide Residue Testing Revenue (USD Million) By Country (2023-2028)
Figure 33 Europe Pesticide Residue Testing Revenue (USD Million) By Type (2023-2028)
Figure 34 Europe Pesticide Residue Testing Revenue (USD Million) By Applications (2023-2028)
Figure 35 Asia Pacific Pesticide Residue Testing Revenue (USD Million) By Country (2023-2028)
Figure 36 Asia Pacific Pesticide Residue Testing Revenue (USD Million) By Type (2023-2028)
Figure 37 Asia Pacific Pesticide Residue Testing Revenue (USD Million) By Applications (2023-2028)
Figure 38 South America Pesticide Residue Testing Revenue (USD Million) By Country (2023-2028)
Figure 39 South America Pesticide Residue Testing Revenue (USD Million) By Type (2023-2028)
Figure 40 South America Pesticide Residue Testing Revenue (USD Million) By Applications (2023-2028)
Figure 41 Middle East and Africa Pesticide Residue Testing Revenue (USD Million) By Region (2023-2028)
Figure 42 Middle East and Africa Pesticide Residue Testing Revenue (USD Million) By Region (2023-2028)
Figure 43 Middle East and Africa Pesticide Residue Testing Revenue (USD Million) By Type (2023-2028)
Figure 44 Middle East and Africa Pesticide Residue Testing Revenue (USD Million) By Applications (2023-2028)
Figure 45 Bottom-Up and Top-Down Approaches For This Report
Figure 46 Data Triangulation
