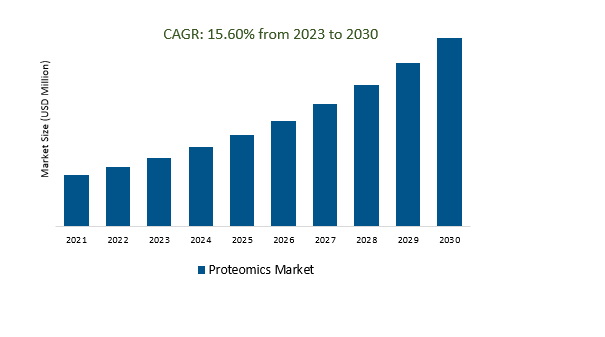
The Global Proteomics Market size is estimated at $43.4 Billion in 2025 and is forecast to register an annual growth rate (CAGR) of 15.6% to reach $160 Billion by 2034
The market growth is driven by the increasing innovations in mass spectrometry, liquid chromatography, sample preparation methods, and data analysis tools will continue to enhance the capabilities and efficiency of proteomics research. Leading companies that are focused on Clinical Applications, Pharmaceutical and Drug Development, Precision Medicine, Single-Cell Proteomics, AI and Machine Learning, Collaborations and Partnerships, and others to boost market shares in the industry.
Proteomics Market Overview
The global proteomics market, valued at several billion US dollars and characterized by strong growth, revolves around the comprehensive study of proteins in biological systems. Key drivers include technological advancements, clinical applications for disease diagnosis and treatment monitoring, drug discovery and development, personalized medicine, biomarker discovery, biopharmaceutical production, and applications in agriculture, food science, and environmental monitoring. Major players in the market include Thermo Fisher Scientific, Agilent Technologies, Bruker Corporation, Waters Corporation, and others.
Proteomics Market Dynamics
Market Trends - Pharmaceutical and Biotechnology Collaboration: Driving Innovation in the Proteomics Market
Collaboration between pharmaceutical and biotechnology industries is a catalyst for innovation in the proteomics market, accelerating drug discovery, development, and personalized medicine efforts. This partnership enables the identification of drug targets, exploration of drug-protein interactions, and the discovery of disease biomarkers. The collaboration expedites the practical application of proteomics research, leading to the development of new therapies and diagnostics. As precision medicine gains traction, this synergy is expected to drive further proteomics advancements, ultimately delivering more effective and tailored treatments to patients.
Market Driver- Advances in Bioinformatics Demand Proteomics Market
Advances in bioinformatics are driving growth in the proteomics market by providing essential tools for managing and analyzing the vast and complex data generated in proteomic studies. Bioinformatics facilitates protein identification, expression level quantification, and functional interaction understanding. It is also crucial for integrating proteomics data with other omics disciplines, enhancing the comprehensive understanding of biological systems, and supporting the continued expansion of the proteomics market.
Market Opportunity-Introduction of Technological Advancements
Technological advancements, particularly in mass spectrometry, liquid chromatography, and data analysis software, have significantly enhanced the proteomics market. These innovations enable more accurate and efficient protein analysis, benefiting areas like drug discovery, clinical diagnostics, and personalized medicine. Advanced sample preparation techniques further streamline proteomic workflows, positioning proteomics as a crucial tool in life sciences research and healthcare.
Market Share Analysis- Services the Proteomics Market will register the fastest growth
The Global Proteomics Market is analyzed across Instruments, Reagents and Consumables, Services, and others. Services is poised to register the fastest growth. Proteomics services encompass a range of specialized offerings that support research in protein analysis. These services include protein identification, quantification, characterization, biomarker discovery, protein-protein interaction studies, clinical applications, biopharmaceutical analysis, sample preparation, data analysis, custom projects, and training workshops. They serve diverse industries such as pharmaceuticals, biotechnology, clinical diagnostics, and environmental science, enabling researchers and organizations to access expertise and advanced tools for protein-focused investigations, ultimately accelerating scientific discoveries and applications.
Market Share Analysis- Drug Discovery held a significant market share in 2024
The Global Proteomics Market is analyzed across various applications including Drug Discovery, Clinical Diagnostics, and others. Of these, Drug Discovery held a significant market share in 2024. Proteomics plays a pivotal role in drug discovery by identifying and validating potential drug targets, optimizing lead compounds, studying drug-protein interactions, discovering biomarkers for patient stratification, and assessing toxicity. It aids in personalized medicine, enabling tailored drug treatments based on individual proteomic profiles. Additionally, proteomics is crucial in characterizing and ensuring the quality of biopharmaceuticals. This integration of proteomics with drug discovery processes accelerates target identification, enhances lead compound selection, and improves our understanding of drug mechanisms, driving innovation and efficiency in pharmaceutical research and development.
Proteomics Market Segmenttaion
By Product Type
- Instruments
- Reagents and Consumables
- Services
By Application
- Drug Discovery
- Clinical Diagnostics
- Others
By Technology
- Microarray Instruments
- X-Ray Crystallography
- Spectroscopy
- Chromatography
- Protein Fractionation Systems
- Electrophoresis
- Surface Plasma Resonance (SPR) Systems
By Region
- North America (United States, Canada, Mexico)
- Europe (Germany, France, United Kingdom, Spain, Italy, Others)
- Asia Pacific (China, India, Japan, South Korea, Australia, Others)
- Latin America (Brazil, Argentina, Others)
- Middle East and Africa (Saudi Arabia, UAE, Kuwait, Other Middle East, South Africa, Nigeria, Other Africa)
Proteomics Market Companies
- Thermo Fisher Scientific Inc
- Agilent Technologies Inc
- Illumina Inc
- Bio-Rad Laboratories Inc
- GE Healthcare
- Bruker Corporation
- Merck KGaA
- F. Hoffmann-La Roche Ltd
- Danaher
- Promega Corp
*List not exhaustive
Proteomics Market Outlook 2025
1 Market Overview
1.1 Introduction to the Proteomics Market
1.2 Scope of the Study
1.3 Research Objective
1.3.1 Key Market Scope and Segments
1.3.2 Players Covered
1.3.3 Years Considered
2 Executive Summary
2.1 2023 Proteomics Industry- Market Statistics
3 Market Dynamics
3.1 Market Drivers
3.2 Market Challenges
3.3 Market Opportunities
3.4 Market Trends
4 Market Factor Analysis
4.1 Porter’s Five Forces
4.2 Market Entropy
4.2.1 Global Proteomics Market Companies with Area Served
4.2.2 Products Offerings Global Proteomics Market
5 COVID-19 Impact Analysis and Outlook Scenarios
5.1.1 Covid-19 Impact Analysis
5.1.2 Post-COVID-19 Scenario- Low Growth Case
5.1.3 Post-COVID-19 Scenario- Reference Growth Case
5.1.4 Post-COVID-19 Scenario- Low Growth Case
6 Global Proteomics Market Trends
6.1 Global Proteomics Revenue (USD Million) and CAGR (%) by Type (2019-2032)
6.2 Global Proteomics Revenue (USD Million) and CAGR (%) by Applications (2019-2032)
6.3 Global Proteomics Revenue (USD Million) and CAGR (%) by Regions (2019-2032)
7 Global Proteomics Market Revenue (USD Million) by Type, and Applications (2019-2024)
7.1 Global Proteomics Revenue (USD Million) by Type (2019-2024)
7.1.1 Global Proteomics Revenue (USD Million), Market Share (%) by Type (2019-2024)
7.2 Global Proteomics Revenue (USD Million) by Applications (2019-2024)
7.2.1 Global Proteomics Revenue (USD Million), Market Share (%) by Applications (2019-2024)
8 Global Proteomics Development Regional Status and Outlook
8.1 Global Proteomics Revenue (USD Million) By Regions (2019-2024)
8.2 North America Proteomics Revenue (USD Million) by Type, and Application (2019-2024)
8.2.1 North America Proteomics Revenue (USD Million) by Country (2019-2024)
8.2.2 North America Proteomics Revenue (USD Million) by Type (2019-2024)
8.2.3 North America Proteomics Revenue (USD Million) by Applications (2019-2024)
8.3 Europe Proteomics Revenue (USD Million), by Type, and Applications (USD Million) (2019-2024)
8.3.1 Europe Proteomics Revenue (USD Million), by Country (2019-2024)
8.3.2 Europe Proteomics Revenue (USD Million) by Type (2019-2024)
8.3.3 Europe Proteomics Revenue (USD Million) by Applications (2019-2024)
8.4 Asia Pacific Proteomics Revenue (USD Million), and Revenue (USD Million) by Type, and Applications (2019-2024)
8.4.1 Asia Pacific Proteomics Revenue (USD Million) by Country (2019-2024)
8.4.2 Asia Pacific Proteomics Revenue (USD Million) by Type (2019-2024)
8.4.3 Asia Pacific Proteomics Revenue (USD Million) by Applications (2019-2024)
8.5 South America Proteomics Revenue (USD Million), by Type, and Applications (2019-2024)
8.5.1 South America Proteomics Revenue (USD Million), by Country (2019-2024)
8.5.2 South America Proteomics Revenue (USD Million) by Type (2019-2024)
8.5.3 South America Proteomics Revenue (USD Million) by Applications (2019-2024)
8.6 Middle East and Africa Proteomics Revenue (USD Million), by Type, Technology, Application, Thickness (2019-2024)
8.6.1 Middle East and Africa Proteomics Revenue (USD Million) by Country (2019-2024)
8.6.2 Middle East and Africa Proteomics Revenue (USD Million) by Type (2019-2024)
8.6.3 Middle East and Africa Proteomics Revenue (USD Million) by Applications (2019-2024)
9 Company Profiles
10 Global Proteomics Market Revenue (USD Million), by Type, and Applications (2025-2034)
10.1 Global Proteomics Revenue (USD Million) and Market Share (%) by Type (2025-2034)
10.1.1 Global Proteomics Revenue (USD Million), and Market Share (%) by Type (2025-2034)
10.2 Global Proteomics Revenue (USD Million) and Market Share (%) by Applications (2025-2034)
10.2.1 Global Proteomics Revenue (USD Million), and Market Share (%) by Applications (2025-2034)
11 Global Proteomics Development Regional Status and Outlook Forecast
11.1 Global Proteomics Revenue (USD Million) By Regions (2025-2034)
11.2 North America Proteomics Revenue (USD Million) by Type, and Applications (2025-2034)
11.2.1 North America Proteomics Revenue (USD) Million by Country (2025-2034)
11.2.2 North America Proteomics Revenue (USD Million), by Type (2025-2034)
11.2.3 North America Proteomics Revenue (USD Million), Market Share (%) by Applications (2025-2034)
11.3 Europe Proteomics Revenue (USD Million), by Type, and Applications (2025-2034)
11.3.1 Europe Proteomics Revenue (USD Million), by Country (2025-2034)
11.3.2 Europe Proteomics Revenue (USD Million), by Type (2025-2034)
11.3.3 Europe Proteomics Revenue (USD Million), by Applications (2025-2034)
11.4 Asia Pacific Proteomics Revenue (USD Million) by Type, and Applications (2025-2034)
11.4.1 Asia Pacific Proteomics Revenue (USD Million), by Country (2025-2034)
11.4.2 Asia Pacific Proteomics Revenue (USD Million), by Type (2025-2034)
11.4.3 Asia Pacific Proteomics Revenue (USD Million), by Applications (2025-2034)
11.5 South America Proteomics Revenue (USD Million), by Type, and Applications (2025-2034)
11.5.1 South America Proteomics Revenue (USD Million), by Country (2025-2034)
11.5.2 South America Proteomics Revenue (USD Million), by Type (2025-2034)
11.5.3 South America Proteomics Revenue (USD Million), by Applications (2025-2034)
11.6 Middle East and Africa Proteomics Revenue (USD Million), by Type, and Applications (2025-2034)
11.6.1 Middle East and Africa Proteomics Revenue (USD Million), by Region (2025-2034)
11.6.2 Middle East and Africa Proteomics Revenue (USD Million), by Type (2025-2034)
11.6.3 Middle East and Africa Proteomics Revenue (USD Million), by Applications (2025-2034)
12 Methodology and Data Sources
12.1 Methodology/Research Approach
12.1.1 Research Programs/Design
12.1.2 Market Size Estimation
12.1.3 Market Breakdown and Data Triangulation
12.2 Data Sources
12.2.1 Secondary Sources
12.2.2 Primary Sources
12.3 Disclaimer
List of Tables
Table 1 Market Segmentation Analysis
Table 2 Global Proteomics Market Companies with Areas Served
Table 3 Products Offerings Global Proteomics Market
Table 4 Low Growth Scenario Forecasts
Table 5 Reference Case Growth Scenario
Table 6 High Growth Case Scenario
Table 7 Global Proteomics Revenue (USD Million) And CAGR (%) By Type (2019-2032)
Table 8 Global Proteomics Revenue (USD Million) And CAGR (%) By Applications (2019-2032)
Table 9 Global Proteomics Revenue (USD Million) And CAGR (%) By Regions (2019-2032)
Table 10 Global Proteomics Revenue (USD Million) By Type (2019-2024)
Table 11 Global Proteomics Revenue Market Share (%) By Type (2019-2024)
Table 12 Global Proteomics Revenue (USD Million) By Applications (2019-2024)
Table 13 Global Proteomics Revenue Market Share (%) By Applications (2019-2024)
Table 14 Global Proteomics Market Revenue (USD Million) By Regions (2019-2024)
Table 15 Global Proteomics Market Share (%) By Regions (2019-2024)
Table 16 North America Proteomics Revenue (USD Million) By Country (2019-2024)
Table 17 North America Proteomics Revenue (USD Million) By Type (2019-2024)
Table 18 North America Proteomics Revenue (USD Million) By Applications (2019-2024)
Table 19 Europe Proteomics Revenue (USD Million) By Country (2019-2024)
Table 20 Europe Proteomics Revenue (USD Million) By Type (2019-2024)
Table 21 Europe Proteomics Revenue (USD Million) By Applications (2019-2024)
Table 22 Asia Pacific Proteomics Revenue (USD Million) By Country (2019-2024)
Table 23 Asia Pacific Proteomics Revenue (USD Million) By Type (2019-2024)
Table 24 Asia Pacific Proteomics Revenue (USD Million) By Applications (2019-2024)
Table 25 South America Proteomics Revenue (USD Million) By Country (2019-2024)
Table 26 South America Proteomics Revenue (USD Million) By Type (2019-2024)
Table 27 South America Proteomics Revenue (USD Million) By Applications (2019-2024)
Table 28 Middle East and Africa Proteomics Revenue (USD Million) By Region (2019-2024)
Table 29 Middle East and Africa Proteomics Revenue (USD Million) By Type (2019-2024)
Table 30 Middle East and Africa Proteomics Revenue (USD Million) By Applications (2019-2024)
Table 31 Financial Analysis
Table 32 Global Proteomics Revenue (USD Million) By Type (2025-2034)
Table 33 Global Proteomics Revenue Market Share (%) By Type (2025-2034)
Table 34 Global Proteomics Revenue (USD Million) By Applications (2025-2034)
Table 35 Global Proteomics Revenue Market Share (%) By Applications (2025-2034)
Table 36 Global Proteomics Market Revenue (USD Million), And Revenue (USD Million) By Regions (2025-2034)
Table 37 North America Proteomics Revenue (USD)By Country (2025-2034)
Table 38 North America Proteomics Revenue (USD Million) By Type (2025-2034)
Table 39 North America Proteomics Revenue (USD Million) By Applications (2025-2034)
Table 40 Europe Proteomics Revenue (USD Million) By Country (2025-2034)
Table 41 Europe Proteomics Revenue (USD Million) By Type (2025-2034)
Table 42 Europe Proteomics Revenue (USD Million) By Applications (2025-2034)
Table 43 Asia Pacific Proteomics Revenue (USD Million) By Country (2025-2034)
Table 44 Asia Pacific Proteomics Revenue (USD Million) By Type (2025-2034)
Table 45 Asia Pacific Proteomics Revenue (USD Million) By Applications (2025-2034)
Table 46 South America Proteomics Revenue (USD Million) By Country (2025-2034)
Table 47 South America Proteomics Revenue (USD Million) By Type (2025-2034)
Table 48 South America Proteomics Revenue (USD Million) By Applications (2025-2034)
Table 49 Middle East and Africa Proteomics Revenue (USD Million) By Region (2025-2034)
Table 50 Middle East and Africa Proteomics Revenue (USD Million) By Region (2025-2034)
Table 51 Middle East and Africa Proteomics Revenue (USD Million) By Type (2025-2034)
Table 52 Middle East and Africa Proteomics Revenue (USD Million) By Applications (2025-2034)
Table 53 Research Programs/Design for This Report
Table 54 Key Data Information from Secondary Sources
Table 55 Key Data Information from Primary Sources
List of Figures
Figure 1 Market Scope
Figure 2 Porter’s Five Forces
Figure 3 Global Proteomics Revenue (USD Million) By Type (2019-2024)
Figure 4 Global Proteomics Revenue Market Share (%) By Type (2022)
Figure 5 Global Proteomics Revenue (USD Million) By Applications (2019-2024)
Figure 6 Global Proteomics Revenue Market Share (%) By Applications (2022)
Figure 7 Global Proteomics Market Revenue (USD Million) By Regions (2019-2024)
Figure 8 Global Proteomics Market Share (%) By Regions (2022)
Figure 9 North America Proteomics Revenue (USD Million) By Country (2019-2024)
Figure 10 North America Proteomics Revenue (USD Million) By Type (2019-2024)
Figure 11 North America Proteomics Revenue (USD Million) By Applications (2019-2024)
Figure 12 Europe Proteomics Revenue (USD Million) By Country (2019-2024)
Figure 13 Europe Proteomics Revenue (USD Million) By Type (2019-2024)
Figure 14 Europe Proteomics Revenue (USD Million) By Applications (2019-2024)
Figure 15 Asia Pacific Proteomics Revenue (USD Million) By Country (2019-2024)
Figure 16 Asia Pacific Proteomics Revenue (USD Million) By Type (2019-2024)
Figure 17 Asia Pacific Proteomics Revenue (USD Million) By Applications (2019-2024)
Figure 18 South America Proteomics Revenue (USD Million) By Country (2019-2024)
Figure 19 South America Proteomics Revenue (USD Million) By Type (2019-2024)
Figure 20 South America Proteomics Revenue (USD Million) By Applications (2019-2024)
Figure 21 Middle East and Africa Proteomics Revenue (USD Million) By Region (2019-2024)
Figure 22 Middle East and Africa Proteomics Revenue (USD Million) By Type (2019-2024)
Figure 23 Middle East and Africa Proteomics Revenue (USD Million) By Applications (2019-2024)
Figure 24 Global Proteomics Revenue (USD Million) By Type (2025-2034)
Figure 25 Global Proteomics Revenue Market Share (%) By Type (2030)
Figure 26 Global Proteomics Revenue (USD Million) By Applications (2025-2034)
Figure 27 Global Proteomics Revenue Market Share (%) By Applications (2030)
Figure 28 Global Proteomics Market Revenue (USD Million) By Regions (2025-2034)
Figure 29 North America Proteomics Revenue (USD Million) By Country (2025-2034)
Figure 30 North America Proteomics Revenue (USD Million) By Type (2025-2034)
Figure 31 North America Proteomics Revenue (USD Million) By Applications (2025-2034)
Figure 32 Europe Proteomics Revenue (USD Million) By Country (2025-2034)
Figure 33 Europe Proteomics Revenue (USD Million) By Type (2025-2034)
Figure 34 Europe Proteomics Revenue (USD Million) By Applications (2025-2034)
Figure 35 Asia Pacific Proteomics Revenue (USD Million) By Country (2025-2034)
Figure 36 Asia Pacific Proteomics Revenue (USD Million) By Type (2025-2034)
Figure 37 Asia Pacific Proteomics Revenue (USD Million) By Applications (2025-2034)
Figure 38 South America Proteomics Revenue (USD Million) By Country (2025-2034)
Figure 39 South America Proteomics Revenue (USD Million) By Type (2025-2034)
Figure 40 South America Proteomics Revenue (USD Million) By Applications (2025-2034)
Figure 41 Middle East and Africa Proteomics Revenue (USD Million) By Region (2025-2034)
Figure 42 Middle East and Africa Proteomics Revenue (USD Million) By Region (2025-2034)
Figure 43 Middle East and Africa Proteomics Revenue (USD Million) By Type (2025-2034)
Figure 44 Middle East and Africa Proteomics Revenue (USD Million) By Applications (2025-2034)
Figure 45 Bottom-Up and Top-Down Approaches For This Report
Figure 46 Data Triangulation
