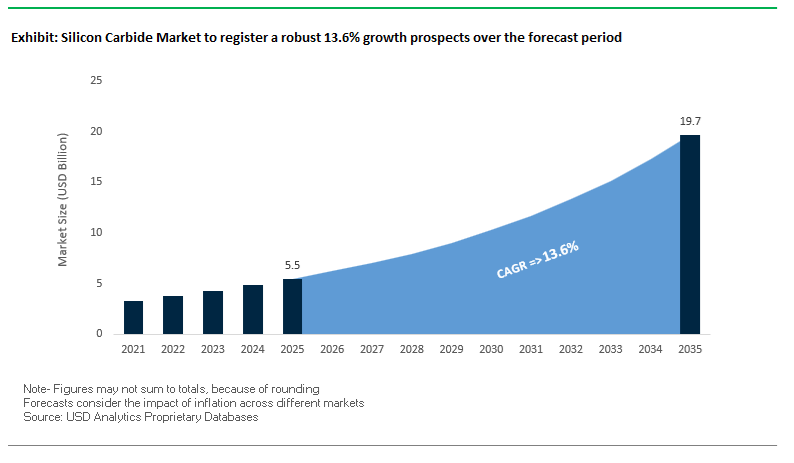
The Silicon Carbide (SiC) Market, valued at USD 5.5 billion in 2025, is set to reach USD 19.7 billion by 2035, expanding at a powerful CAGR of 13.6%. The acceleration reflects SiC’s rapid displacement of traditional silicon power semiconductors in electric vehicles (EVs), renewable energy systems, industrial drives, and AI data centers.
The year 2025 marks a pivotal acceleration of global SiC capacity, driven by strategic government incentives, major manufacturing investments, and a worldwide push toward 8-inch (200 mm) SiC wafers. In December 2025, ON Semiconductor secured a significant €450 million government grant from the Czech Republic, establishing Europe’s first vertically integrated 8-inch SiC fab, advancing regional reshoring initiatives and supplying EV, industrial, and data center markets. During the same month, ROHM Semiconductor began mass production of TOLL-package SiC MOSFETs, achieving 39% improved thermal performance and a 26% smaller footprint, addressing the form-factor constraints of AI server power modules and PV inverters.
Also in December 2025, Coherent Corp. announced its long-term transition from 200 mm to 300 mm (12-inch) SiC substrates, signaling major structural capacity for lowering wafer cost, improving material uniformity, and preparing for the next decade of SiC adoption. In the EV charging ecosystem, Infineon Technologies demonstrated a notable application win by enabling Electreon’s dynamic wireless EV charging system, showcasing SiC’s feasibility in high-frequency, high-reliability inductive power transfer systems.
Earlier in September 2025, Wolfspeed confirmed its emergence from financial restructuring, while simultaneously launching its first customer-qualification lots of 200 mm SiC wafers. The company’s receipt of a $698.6 million cash tax refund strengthened its operational liquidity and is expected to fuel its multi-site production ramp across Mohawk Valley and Durham. Strategic collaborations also shaped 2025, including the March 2025 US$3.2 billion STMicroelectronics–Sanan joint venture in Chongqing dedicated to automotive-grade 8-inch SiC device production, targeting 10,000 wafers per week and positioning China as an influential regional hub.
Parallel developments in AI infrastructure underscore SiC’s rising relevance: in February 2025, onsemi reported that SiC device power content in AI server racks is projected to rise from $2,500 to $9,500, driven by next-generation GPU accelerators requiring highly efficient power delivery and thermal performance. Collectively, these developments illustrate an industry aggressively transitioning toward larger wafer sizes, tighter integration, and scaled manufacturing ecosystems, cementing SiC’s foundational role across global electrification and digitalization efforts.
Industry professionals increasingly evaluate SiC based on quantifiable electrical, thermal, and switching metrics, making performance metrics including critical electric field strength, thermal conductivity, switching loss reduction, EV range gain, and high-temperature resilience central to procurement and design consideration.
- High-voltage capability is unmatched: SiC’s critical electric field strength of 2.8×10⁶ V/cm, approximately 10× that of silicon, enables thinner drift layers and more compact, higher-voltage devices used across 800V EV platforms.
- Superior heat dissipation: With thermal conductivity between 370–490 W/m·K, SiC dramatically reduces heatsink size and cooling complexity for EV inverters, PV inverters, and EV fast chargers.
- Switching efficiency drives adoption: Transitioning from silicon IGBTs to SiC MOSFETs reduces system losses by up to 89% at 30 kHz, essential for high-power-density industrial and renewable energy systems.
- Direct EV range benefits: SiC MOSFET–based powertrains can cut inverter losses by up to 80%, increasing EV driving range by up to 10%, a key metric for OEM competitiveness.
- Thermal resilience reduces system cost: SiC’s ability to operate at 175°C junction temperature reduces the need for complex cooling, allowing tighter packaging and lower system-level thermal management costs.
Vertically Integrated Supply Chains, 200mm Wafer Scaling, High-Frequency RF Innovation, and System-Level Efficiency Gains Shape the Silicon Carbide (SiC) Market
Trend 1: Automotive OEMs Accelerate Vertical Integration to Secure SiC Substrates and Wafers for 800V EV Architectures
The rapid transition toward 800V electric vehicle platforms is reshaping the global SiC supply ecosystem, as automotive OEMs move beyond traditional supplier arrangements and invest directly in SiC substrate and wafer capacity. Securing SiC supply is now a strategic imperative due to long crystal-growth cycle times, slow yield improvement curves, and the explosive rise in EV demand.
Key developments include:
- Direct OEM and Tier-1 investment: A tier-one automotive supplier committed up to $2 billion (2024–2032) to build a fully vertically integrated SiC manufacturing hub in the Czech Republic. This facility targets EV traction inverters, renewable energy converters, and hyperscale data center infrastructure.
- Aggressive capacity expansion by semiconductor leaders: A major SiC device manufacturer announced a multi-year plan to 5× its SiC wafer output by FY2026, supported by an initial investment of JPY 100 billion (~$670 million) and the establishment of a new 200mm wafer fab to serve EV programs.
- Global public-sector support: Over $4.6 billion in government-backed SiC subsidies were announced in 2023–2024. China alone allocated $1.7 billion to local SiC fabs, activating five new wafer facilities in 2024 to dramatically reduce import dependence.
- Supply chain influence from automotive customers: OEMs now dictate module-level reliability requirements, pushing suppliers to innovate silver sintering bonding methods, advanced ceramic baseplates, and ultra-low defect epitaxy to meet EV thermal and electrical demands.
This vertical integration trend is solidifying long-term supply contracts, improving quality control, and driving down cost-per-amp, making SiC indispensable for future EV architectures.
Trend 2: Commercialization of 200mm SiC Wafers to Lower Cost-Per-Amp and Achieve Scale for Mass Power Device Adoption
The industry is transitioning from 150mm to 200mm SiC wafers, a milestone that mirrors the scaling economics of silicon and represents the most powerful cost reduction pathway for SiC power electronics.
Major technical advances include:
- Breakthroughs in defect density: Manufacturers have achieved micropipe densities as low as 0.36/cm² on representative 200mm wafers-levels that support high-yield epitaxial deposition and wafering.
- Throughput improvements: Optimization of PVT crystal-growth systems has boosted mass deposition rates by 25% over 150mm processes, directly increasing wafer output per furnace cycle.
- Cost reduction via usable area: Transitioning to 200mm increases usable wafer area by ≈78%, significantly boosting die-per-wafer counts and lowering the cost per kilowatt of SiC module output.
- Uniformity achievements: Advanced doping and thermal-engineering controls have enabled resistivity uniformity comparable to 150mm wafers, validating 200mm wafers for high-performance MOSFET and Schottky diode manufacturing.
As defect densities fall and yields improve, 200mm SiC wafers are poised to drive the next major pricing reset, enabling SiC to penetrate mid-range EV segments, grid-scale inverters, and commercial motor drives at scale.
Opportunity 1: High-Temperature, High-Frequency SiC RF Devices Unlock Growth in 5G/6G Infrastructure and Aerospace Radar
SiC’s material properties-high breakdown voltage, wide bandgap, and exceptional thermal conductivity-position it as a premium substrate and potential active semiconductor material for next-generation RF systems.
Key technical enablers include:
- Category-leading thermal conductivity:
- 4H-SiC: ≈5.0 W/cm·K
- GaN: ≈1.3 W/cm·K
- Si: ≈1.5 W/cm·K
Superior thermal dissipation enables higher power densities and junction temperatures exceeding 200°C, essential for aerospace radar and high-power telecom.
High-frequency switching: SiC devices can operate at ~1 MHz at high voltages, reducing passive component size and improving efficiency in high-frequency power architectures.
GaN-on-SiC dominance in RF power amplifiers:
GaN-on-SiC PAs deliver 5× the power density of LDMOS, supporting 5G massive MIMO radios and emerging 6G high-band applications.
Aerospace radars: SiC allows radar modules to operate in harsher thermal environments with extended duty cycles and superior reliability.
This opportunity aligns with global 5G rollout, defense modernization, and the early-stage 6G materials race-signifying long-term, high-value demand for SiC RF substrates and devices.
Opportunity 2: SiC Penetration into Industrial Motor Drives and Renewable Energy Inverters Through High-Reliability Module Designs
Industrial automation and renewable power systems are becoming core growth engines for SiC, driven by stringent efficiency, miniaturization, and lifetime expectations.
Key system-level advantages include:
- System cost reductions up to 30%: SiC’s inherent efficiency (e.g., up to 99% in solar inverters) reduces the size of inductors, transformers, and heat sinks-driving down total system cost compared to silicon IGBTs.
- Switching loss reduction of 66%: In real-world motor drive testing, SiC MOSFETs delivered 66% lower switching losses than IGBTs, enabling switching frequencies of 50–200 kHz, versus 15–20 kHz for IGBTs.
- Energy efficiency in motors: Replacing IGBTs with SiC MOSFETs significantly cuts industrial motor energy consumption-critical as motors represent a major share of global electricity usage.
- Long-term reliability for renewables: Solar and wind inverters require multi-decade durability (20+ years). SiC’s heat tolerance and ruggedness support stable field performance in harsh outdoor conditions.
As industrial decarbonization accelerates, SiC will become the preferred semiconductor material for motor control, grid converters, energy storage inverters, and utility-scale renewable infrastructure.
Silicon Carbide Market Share Analysis
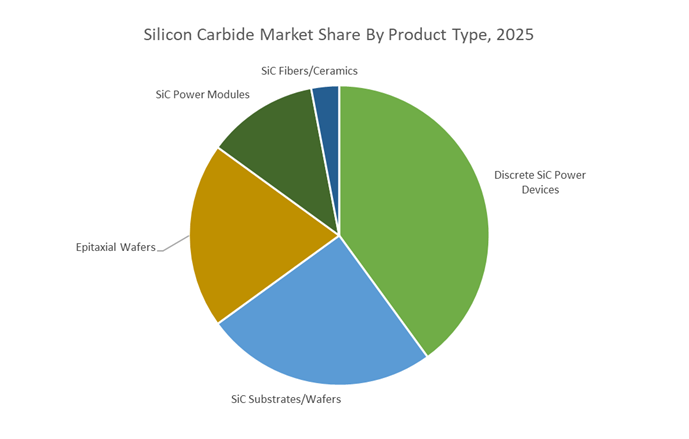
Market Share by Product Type: Discrete SiC Power Devices Lead Through Design Flexibility, Commercial Maturity, and High-Efficiency Switching Performance
Discrete SiC power devices hold the dominant 40% share of the Silicon Carbide Market, reflecting their foundational role in enabling high-efficiency power electronics across automotive, industrial, energy, and consumer applications. As the first SiC technology category to reach commercial maturity, SiC MOSFETs and Schottky Diodes established themselves as the go-to components for early system-level adoption due to their design versatility, availability in standard packaging formats, and ease of integration into existing silicon-based power architectures. Their market leadership is reinforced by SiC’s intrinsic material advantages—particularly significantly lower switching losses compared to Silicon IGBTs, enabling switching frequencies that are up to 10 times higher. These higher frequencies drastically reduce the size and cost of passive components such as inductors and capacitors, allowing engineers to build smaller, lighter, and more efficient power conversion systems.
Thermally, discrete SiC devices excel due to wide-bandgap material properties that support junction temperatures of 175°C to 200°C, compared to the ~150°C limit of traditional silicon devices. This superior thermal endurance enables compact packaging, simpler cooling systems, and higher power density—all of which are critical for EV powertrains, renewable energy inverters, and industrial power supplies. Their early commercialization also gave discrete devices a strategic foothold in applications such as onboard chargers, DC–DC converters, and auxiliary power systems, where engineers require flexible building blocks to validate prototypes before migrating into module-based designs. This combination of performance, flexibility, and long-standing ecosystem support ensures that discrete SiC power devices remain the highest-volume product segment in the global SiC supply chain.
Market Share by Application: Electric Vehicles Dominate as SiC Becomes the Core Technology for Range Extension, Fast Charging, and Lightweight Power Electronics
Electric Vehicles command an overwhelming 60% share of the Silicon Carbide Market, driven by the material’s unrivaled ability to solve the automotive industry’s most critical challenges: extending driving range, improving power efficiency, and enabling ultra-fast charging. SiC MOSFETs used in traction inverters dramatically reduce conversion losses compared to silicon-based power devices, unlocking 5% to 10% gains in EV driving range without increasing battery size—a major cost advantage given that the battery is the single most expensive component in an EV. This efficiency improvement not only enhances performance but also supports automakers’ strategic goal of reducing battery capacity while maintaining consumer-desired ranges.
SiC is also the key enabler of next-generation 800 V EV architectures, which reduce current for the same power output, allowing for thinner, lighter cables and significantly improving powertrain thermal performance. More importantly, the higher voltage backbone supports 15–20 minute fast charging to 80%, a milestone necessary for mass-market adoption of EVs. With SiC’s high thermal conductivity and power density, critical systems such as traction inverters, onboard chargers, and DC–DC converters can be made up to 50% smaller and lighter, directly improving vehicle efficiency and opening space for design optimization. As automakers scale EV production globally and transition from silicon to SiC-based power platforms, demand intensifies across premium, mid-range, and commercial EV segments—cementing Electric Vehicles as the dominant and fastest-growing application in the Silicon Carbide Market.
Country Analysis: Global SiC Power Device Manufacturing Hubs
United States – CHIPS Act–Driven Scale-Up and Global Leadership in 200mm Silicon Carbide Substrate Manufacturing
The United States continues to dominate the global Silicon Carbide Market, particularly in SiC substrate innovation, 8-inch (200mm) wafer transition, and high-volume device fabrication. This leadership is reinforced by aggressive federal funding under the CHIPS and Science Act, which has strategically positioned the U.S. as the primary hub for advanced wide bandgap semiconductor manufacturing. In October 2024, the Biden–Harris Administration announced a preliminary memorandum of terms (PMT) for up to $750 million in CHIPS funding to Wolfspeed, marking one of the most consequential investments in U.S. SiC technology to date. The investment is expected to accelerate Wolfspeed’s expansion of its Marcy, New York facility, set to become the world’s first fully automated 200mm SiC power device fab, enabling next-generation efficiency and throughput for EV inverters, renewable energy systems, and high-power industrial drives.
Wolfspeed’s broader U.S. expansion includes the Siler City, North Carolina megafactory, projected to be the largest SiC wafer manufacturing facility in the country and the world’s first mass-production site dedicated to high-volume 200mm SiC substrates. The company plans a five-fold increase in SiC device output and a ten-fold surge in 200mm materials production, representing one of the most ambitious vertical integration strategies in the industry. Product innovation is advancing in parallel: Wolfspeed introduced a 2300V SiC power module in September 2024, explicitly designed for high-power renewable energy systems and ultra-fast EV charging infrastructures. Together, these developments position the United States as the global benchmark for high-voltage SiC devices, substrate science, and mass-scale wide bandgap semiconductor manufacturing.
Italy / European Union – Europe’s First Fully Integrated 200mm Silicon Carbide Campus Enabled by EU Chips Act Funding
Europe—anchored by Italy—has emerged as a pivotal region for vertically integrated Silicon Carbide manufacturing, strategically supported by the EU Chips Act. Central to this momentum is STMicroelectronics’ landmark SiC campus in Catania, Sicily, which unifies substrate manufacturing, epitaxy, device fabrication, and module assembly within a single ecosystem. This marks the first fully integrated SiC supply chain in Europe, designed to drastically reduce dependence on external suppliers and strengthen European semiconductor sovereignty. In 2024, the European Commission approved €2 billion in Italian state aid toward ST’s broader €5 billion multi-year investment, underscoring the project’s strategic significance for EVs, industrial electrification, and renewable power electronics.
ST’s new 200mm SiC fab is scheduled to begin production in 2026, with an ambitious target of ramping to 15,000 wafers per week by 2033—a scale previously unmatched in the region. The facility will produce both SiC discrete devices and high-end power modules, supporting Europe’s aggressive transition to electric mobility and carbon-neutral industrial systems. Importantly, the European Commission emphasized that the vertically integrated model enhances supply-chain resilience, reduces production bottlenecks, and aligns with Europe's accelerating electrification goals. The region is therefore becoming a critical manufacturing and innovation hub for high-reliability, automotive-grade SiC components and wide bandgap power semiconductor ecosystems.
Japan – Strengthening 8-Inch SiC Commercialization Through Strategic Investments and Materials Science Leadership
Japan is reinforcing its position in the 8-inch SiC commercialization race, leveraging decades of materials science expertise and strong domestic electronics infrastructure. In December 2025, Mitsubishi Electric completed construction of a new 8-inch SiC wafer fab in Kikuchi, Kumamoto, with mass production planned for 2027. This expansion is part of Mitsubishi’s broader ¥260 billion investment program, with approximately ¥100 billion specifically allocated to scaling SiC wafer production and device manufacturing capacity. The new facility significantly strengthens Japan’s ability to supply SiC devices for automotive electrification, industrial automation, and renewable energy systems.
Japan’s strategy also prioritizes substrate security and vertical collaboration. Mitsubishi Electric’s $500 million investment in a new SiC business carved out from Coherent Corp. marks a major step toward securing stable supplies of 200mm n-type 4H SiC substrates, one of the highest-value components in the SiC value chain. Meanwhile, NGK Insulators’ successful production of 8-inch SiC wafers, showcased at ICSCRM 2024, highlights Japan's leadership in advanced materials and wafer quality improvement. Collectively, Japan is solidifying its position as an indispensable supplier of next-generation SiC wafers, high-reliability SiC MOSFETs, and vertically integrated power semiconductor solutions.
South Korea – Transition to High-Volume 200mm SiC Device Production and Foundry-Based SiC Ecosystem
South Korea is rapidly scaling its position in the global Silicon Carbide Market, propelled by its strong semiconductor manufacturing ecosystem and decisive transition to high-volume 200mm SiC wafer fabrication. In October 2023, Onsemi completed its expansion of the Bucheon SiC fab, positioning it to manufacture over one million 200mm SiC wafers annually—one of the highest-capacity facilities globally. This expansion is complemented by a significant workforce investment, with plans to hire up to 1,000 employees, reflecting the region’s commitment to scaling production and strengthening domestic wide bandgap semiconductor capabilities.
South Korea is also nurturing its foundry ecosystem for SiC power devices. SK keyfoundry, a pure-play foundry, is actively developing 1200V SiC MOSFET processes and intends to launch a dedicated SiC foundry business by mid-2026, leveraging decades of high-precision CMOS and power device manufacturing expertise. This signals South Korea’s intent to become a competitive supplier in the contract manufacturing of SiC devices for global EV, industrial, and consumer applications. Together, these developments show that South Korea is positioning itself as a major high-volume producer of 200mm SiC wafers, SiC MOSFETs, and advanced power modules.
China – Massive State-Backed Scale-Up in 8-Inch SiC Substrates and Domestic Power Device Adoption
China is undergoing one of the world’s fastest scale-ups in SiC substrates and power device manufacturing, supported by massive industrial funding and national semiconductor self-sufficiency goals. One of the most significant initiatives is Sanan Optoelectronics’ Chongqing 8-inch SiC substrate facility, which is poised to become one of the world’s largest with a planned annual capacity of 480,000 8-inch SiC substrates. Total investment for the project exceeds 7 billion yuan, reflecting China’s commitment to dominating the upstream portion of the SiC supply chain.
The country’s expansion is further accelerated by the National IC Industry Investment Fund (Big Fund), which continues to channel capital into wide bandgap semiconductor technologies, including SiC substrates, epitaxy, and device fabs. On the application front, China’s massive EV market is the primary growth engine: domestic automakers are increasingly adopting China-made SiC MOSFETs and SiC Power Modules to reduce dependency on imported components for traction inverters and fast-charging systems. This shift is rapidly elevating China’s role as a major consumer and emerging competitor in the global Silicon Carbide Market, particularly in cost-optimized, high-volume EV and renewable energy applications.
Competitive Landscape: Leading Vertically Integrated SiC Manufacturers Reshaping Global Supply Chains
The competitive structure of the Silicon Carbide market is defined by companies that maintain full vertical integration, from SiC substrate manufacturing and epitaxy to device fabrication and packaging. The integration ensures supply-chain resilience, cost control, and long-term scalability—critical factors as demand from EV, renewable energy, and AI markets accelerates.
Wolfspeed remains the benchmark player in the SiC industry with a 34% share of the global SiC substrate market (2024). Its fully integrated model—from crystal growth and wafering to power device manufacturing—allows the company to tightly control quality and capacity. In 2025, Wolfspeed introduced 200 mm (8-inch) SiC wafers for customer qualification, a milestone expected to support major cost reductions in EV and industrial applications. Strengthened by a $698.6 million tax refund received during its restructuring, the company is accelerating expansion at its Durham and Mohawk Valley fabs, reasserting its leadership in high-volume SiC wafer production.
STMicroelectronics has built a strong reputation in automotive SiC solutions, delivering traction inverters, onboard chargers, and high-reliability MOSFETs meeting AEC-Q100 standards. In March 2025, ST inaugurated its US$3.2 billion joint venture with Sanan in Chongqing, designed for 8-inch SiC device fabrication and targeting 10,000 wafers per week. Its portfolio includes SiC MOSFETs, power modules, and gate drivers optimized for EV platforms. ST’s integrated approach—combining SiC devices with microcontrollers and analog ICs—strengthens its position as a holistic supplier for EV and industrial power systems.
onsemi is a top-tier supplier for 800V EV powertrains, with SiC designed into nearly 60% of BEV models adopting next-generation high-voltage architectures. In December 2025, the company secured a €450 million grant to establish Europe’s first vertically integrated 8-inch SiC fab, supporting regional demand from EV, renewables, and industrial power markets. Onsemi is also strategically expanding into AI data centers, where SiC power content per rack is forecast to rise to $9,500 by 2025 due to the intense power needs of GPU clusters. Its EliteSiC MOSFETs, launched in 3Q25, enable breakthrough switching performance for 750–1200 V systems.
Infineon leads in high-power SiC modules through its CoolSiC™ portfolio and advanced system integration. In December 2025, Infineon showcased SiC’s potential in dynamic wireless in-road EV charging, partnering with Electreon to enhance system reliability and efficiency. Its strategy emphasizes module-level innovation, including EasyPACK™ C platforms, which combine superior thermal performance with scalable system architecture. With end-to-end solutions integrating SiC devices, drivers, and thermal management technologies, Infineon remains a premier supplier for EV, industrial drives, PV inverters, and DC fast chargers.
ROHM Semiconductor’s integrated EcoSiC platform spans wafer fabrication to advanced packaging, ensuring optimal device consistency and reliability. In December 2025, ROHM launched SiC MOSFETs in advanced TOLL packaging (2.3 mm thickness), delivering 39% improved thermal performance and providing a 26% smaller footprint suited for compact AI server power systems and ESS modules. ROHM’s portfolio—from 13 mΩ to 65 mΩ MOSFETs—supports diverse high-power applications including totem-pole PFC circuits, energy storage systems, and high-density power conversion.
Silicon Carbide Market
|
Parameter
|
Details
|
|
Market Size (2025)
|
$5.5 Billion
|
|
Market Size (2035)
|
$19.7 Billion
|
|
Market Growth Rate
|
13.6%
|
|
Segments
|
By Product Type (SiC Substrates/Wafers, Epitaxial Wafers, Discrete SiC Power Devices, SiC Power Modules, SiC Fibers/Ceramics), By Device Type (MOSFETs, Schottky Diodes, Bipolar Junction Transistors, Thyristors), By Wafer Size (4-inch, 6-inch, 8-inch), By Application (Electric Vehicles, Renewable Energy, Industrial, IT & Telecom, Rail & Transportation), By Voltage Range (650–1,200 V, 1,700–3,300 V, >3,300 V)
|
|
Study Period
|
2019- 2024 and 2025-2034
|
|
Units
|
Revenue (USD)
|
|
Qualitative Analysis
|
Porter’s Five Forces, SWOT Profile, Market Share, Scenario Forecasts, Market Ecosystem, Company Ranking, Market Dynamics, Industry Benchmarking
|
|
Companies
|
Wolfspeed Inc., STMicroelectronics N.V., Infineon Technologies AG, onsemi, Mitsubishi Electric Corporation, ROHM Co. Ltd., Resonac Corporation, Sanan Optoelectronics Co. Ltd., Coherent Corp., SK Siltron Co. Ltd., Tankeblue Semiconductor Co. Ltd., Bosch GmbH
|
|
Countries
|
US, Canada, Mexico, Germany, France, Spain, Italy, UK, Russia, China, India, Japan, South Korea, Australia, South East Asia, Brazil, Argentina, Middle East, Africa
|
Silicon Carbide Market Segmentation
By Product Type
- SiC Substrates/Wafers
- Epitaxial Wafers
- Discrete SiC Power Devices
- SiC Power Modules
- SiC Fibers/Ceramics
By Device Type
- MOSFETs
- Schottky Diodes (SBDs)
- Bipolar Junction Transistors (BJT)
- Thyristors
By Wafer Size
- 4-inch (100mm)
- 6-inch (150mm)
- 8-inch (200mm)
By Application
- Electric Vehicles
- Renewable Energy
- Industrial
- IT & Telecom
- Rail & Transportation
By Voltage Range
- 650 V to 1,200 V
- 1,700 V to 3,300 V
- 3,300 V
By Region
- North America (United States, Canada, Mexico)
- Europe (Germany, France, United Kingdom, Spain, Italy, Rest of Europe)
- Asia Pacific (China, India, Japan, South Korea, Australia, Rest of APAC)
- South and Central America (Brazil, Argentina, Rest of SCA)
- Middle East and Africa (Saudi Arabia, UAE, South Africa, Rest of Middle East, Rest of Africa)
Top Companies: Key Silicon Carbide Market Players
- Wolfspeed, Inc.
- STMicroelectronics N.V. (ST)
- Infineon Technologies AG
- ON Semiconductor (onsemi)
- Mitsubishi Electric Corporation
- ROHM Co., Ltd.
- Resonac Corporation (Showa Denko)
- Sanan Optoelectronics Co., Ltd.
- Coherent Corp.
- SK Siltron Co., Ltd.
- TankeBlue Semiconductor Co., Ltd.
- Bosch GmbH
*- List not Exhaustive
