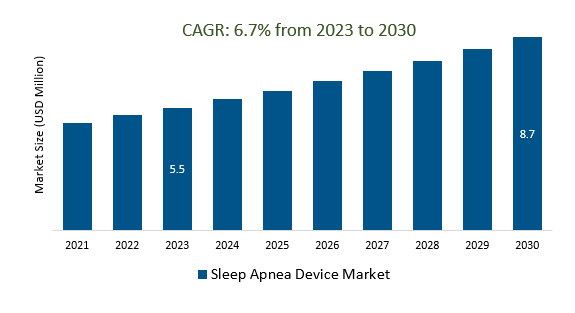
The global Sleep Apnea Device Market Size is estimated to be US 5.5 billion in 2023 and is poised to register 6.7% growth over the forecast period from 2023 to 2030 to reach US $ 8.7 billion in 2030.
The market growth is driven predominantly by the increasing trend towards home-based sleep testing, as it offers convenience and cost-effectiveness compared to traditional in-lab testing. This trend fuels the demand for portable diagnostic and monitoring devices. Leading companies that are focusing on Home-Based Solutions, Remote Patient Monitoring, Wearable Technology, Aging Population, Global Market Expansion, Personalized Medicine, and others to boost market shares in the industry.
Market Overview
The Sleep Apnea Device Market is a growing healthcare sector driven by increasing awareness, rising prevalence of sleep apnea, and technological advancements in devices like CPAP and BiPAP machines. Key drivers include a growing patient population and the development of user-friendly devices, while challenges include patient compliance and device costs. The market is competitive with major players like ResMed and Philips Respironics.
Market Dynamics
Market Trends- Impact of Healthcare Reimbursement Policies on the Sleep Apnea Device Market
Healthcare reimbursement policies significantly influence the Sleep Apnea Device Market by impacting patient access, market growth, and technology adoption. Favorable policies can boost patient demand, stimulate innovation, and enhance treatment outcomes, whereas stringent or limited policies may impede market expansion and pose challenges for patients and industry players. Regional disparities and regulatory compliance further shape market dynamics, underscoring the importance of understanding and adapting to reimbursement policies in the sleep apnea device market.
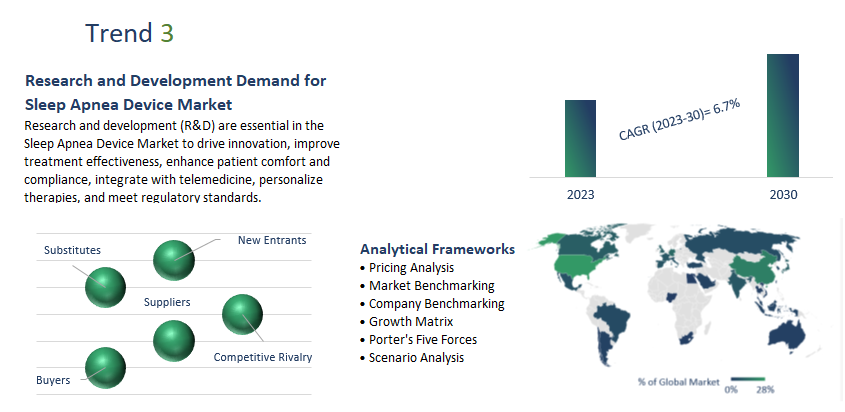
Market Driver- Research and Development Demand for Sleep Apnea Device Market
Research and development (R&D) are essential in the Sleep Apnea Device Market to drive innovation, improve treatment effectiveness, enhance patient comfort and compliance, integrate with telemedicine, personalize therapies, and meet regulatory standards. R&D efforts are critical for staying competitive, expanding the market, and addressing the rising prevalence of sleep apnea, ensuring the development of advanced and patient-centric devices in this healthcare sector.
Market Opportunity-Introduction of Home Sleep Testing
Home Sleep Testing (HST) is a pivotal component of the Sleep Apnea Device Market, offering a convenient and cost-effective means of diagnosing sleep apnea at home. HST has expanded market demand for portable diagnostic devices, emphasizing ease of use, accuracy, and compatibility with telemedicine. It increases accessibility to diagnosis, empowers patients, and aligns with the trend toward patient-centered care and remote monitoring, but requires adherence to regulatory standards for home diagnostic equipment, shaping the market's dynamics.
Market Share Analysis- Therapeutic devices Sleep Apnea Device Market will register the fastest growth.
The global Sleep Apnea Device Market is analyzed across Therapeutic devices, Diagnostic devices, Sleep Apnea Masks, and others. Of these, Therapeutic devices are poised to register the fastest growth. Therapeutic devices are pivotal in the Sleep Apnea Device Market, encompassing CPAP, BiPAP, ASV, oral appliances, and EPAP devices, designed to treat sleep apnea by ensuring unobstructed breathing during sleep.
Market Share Analysis-Individuals held a significant market share in 2023.
The global Sleep Apnea Device Market is analyzed across a wide range of End users including Individuals, Sleep Laboratories, Hospitals, and others. Of these, Individuals held a significant market share in 2023. Individuals with sleep apnea are central stakeholders in the Sleep Apnea Device Market, as they represent the patient population affected by the condition and are the end-users of diagnostic and therapeutic devices.
Sleep Apnea Device Market Segmentation
By Type
- Diagnostic devices (Actigraphs, Polysomnography (PSG) device, Respiratory Polygraphs, Pulse Oximeters)
- Therapeutic devices (Positive Airway Pressure (PAP) Devices, Oral Devices, Nasal Devices, Chin Straps)
- Sleep Apnea Masks
By End User
- Sleep Laboratories
- Hospitals
- Individuals
- Others
By Region
- North America (United States, Canada, Mexico)
- Europe (Germany, France, United Kingdom, Spain, Italy, Others)
- Asia Pacific (China, India, Japan, South Korea, Australia, Others)
- Latin America (Brazil, Argentina, Others)
- Middle East and Africa (Saudi Arabia, UAE, Kuwait, Other Middle East, South Africa, Nigeria, Other Africa)
Sleep Apnea Device Market Companies
- Curative Medical Inc.
- Phillips Respironics
- Fisher & Paykel Healthcare Limited
- ResMed
- Invacare Corporation
- Somnetics International, Inc.
- BMC Medical Co., Ltd.
- Nihon Kohden Corporation
- Natus Medical Incorporated
- SOMNOmedics GmbH
- Itamar Medical Ltd.
- Compumedics Limited
* List not exhaustive
Sleep Apnea Device Market Outlook 2023
1 Market Overview
1.1 Introduction to the Sleep Apnea Device Market
1.2 Scope of the Study
1.3 Research Objective
1.3.1 Key Market Scope and Segments
1.3.2 Players Covered
1.3.3 Years Considered
2 Executive Summary
2.1 2023 Sleep Apnea Device Industry- Market Statistics
3 Market Dynamics
3.1 Market Drivers
3.2 Market Challenges
3.3 Market Opportunities
3.4 Market Trends
4 Market Factor Analysis
4.1 Porter’s Five Forces
4.2 Market Entropy
4.2.1 Global Sleep Apnea Device Market Companies with Area Served
4.2.2 Products Offerings Global Sleep Apnea Device Market
5 COVID-19 Impact Analysis and Outlook Scenarios
5.1.1 Covid-19 Impact Analysis
5.1.2 post-COVID-19 Scenario- Low Growth Case
5.1.3 post-COVID-19 Scenario- Reference Growth Case
5.1.4 post-COVID-19 Scenario- Low Growth Case
6 Global Sleep Apnea Device Market Trends
6.1 Global Sleep Apnea Device Revenue (USD Million) and CAGR (%) by Type (2018-2030)
6.2 Global Sleep Apnea Device Revenue (USD Million) and CAGR (%) by Applications (2018-2030)
6.3 Global Sleep Apnea Device Revenue (USD Million) and CAGR (%) by regions (2018-2030)
7 Global Sleep Apnea Device Market Revenue (USD Million) by Type, and Applications (2018-2022)
7.1 Global Sleep Apnea Device Revenue (USD Million) by Type (2018-2022)
7.1.1 Global Sleep Apnea Device Revenue (USD Million), Market Share (%) by Type (2018-2022)
7.2 Global Sleep Apnea Device Revenue (USD Million) by Applications (2018-2022)
7.2.1 Global Sleep Apnea Device Revenue (USD Million), Market Share (%) by Applications (2018-2022)
8 Global Sleep Apnea Device Development Regional Status and Outlook
8.1 Global Sleep Apnea Device Revenue (USD Million) By Regions (2018-2022)
8.2 North America Sleep Apnea Device Revenue (USD Million) by Type, and Application (2018-2022)
8.2.1 North America Sleep Apnea Device Revenue (USD Million) by Country (2018-2022)
8.2.2 North America Sleep Apnea Device Revenue (USD Million) by Type (2018-2022)
8.2.3 North America Sleep Apnea Device Revenue (USD Million) by Applications (2018-2022)
8.3 Europe Sleep Apnea Device Revenue (USD Million), by Type, and Applications (USD Million) (2018-2022)
8.3.1 Europe Sleep Apnea Device Revenue (USD Million), by Country (2018-2022)
8.3.2 Europe Sleep Apnea Device Revenue (USD Million) by Type (2018-2022)
8.3.3 Europe Sleep Apnea Device Revenue (USD Million) by Applications (2018-2022)
8.4 Asia Pacific Sleep Apnea Device Revenue (USD Million), and Revenue (USD Million) by Type, and Applications (2018-2022)
8.4.1 Asia Pacific Sleep Apnea Device Revenue (USD Million) by Country (2018-2022)
8.4.2 Asia Pacific Sleep Apnea Device Revenue (USD Million) by Type (2018-2022)
8.4.3 Asia Pacific Sleep Apnea Device Revenue (USD Million) by Applications (2018-2022)
8.5 South America Sleep Apnea Device Revenue (USD Million), by Type, and Applications (2018-2022)
8.5.1 South America Sleep Apnea Device Revenue (USD Million), by Country (2018-2022)
8.5.2 South America Sleep Apnea Device Revenue (USD Million) by Type (2018-2022)
8.5.3 South America Sleep Apnea Device Revenue (USD Million) by Applications (2018-2022)
8.6 Middle East and Africa Sleep Apnea Device Revenue (USD Million), by Type, Technology, Application, Thickness (2018-2022)
8.6.1 Middle East and Africa Sleep Apnea Device Revenue (USD Million) by Country (2018-2022)
8.6.2 Middle East and Africa Sleep Apnea Device Revenue (USD Million) by Type (2018-2022)
8.6.3 Middle East and Africa Sleep Apnea Device Revenue (USD Million) by Applications (2018-2022)
9 Company Profiles
10 Global Sleep Apnea Device Market Revenue (USD Million), by Type, and Applications (2023-2030)
10.1 Global Sleep Apnea Device Revenue (USD Million) and Market Share (%) by Type (2023-2030)
10.1.1 Global Sleep Apnea Device Revenue (USD Million), and Market Share (%) by Type (2023-2030)
10.2 Global Sleep Apnea Device Revenue (USD Million) and Market Share (%) by Applications (2023-2030)
10.2.1 Global Sleep Apnea Device Revenue (USD Million), and Market Share (%) by Applications (2023-2030)
11 Global Sleep Apnea Device Development Regional Status and Outlook Forecast
11.1 Global Sleep Apnea Device Revenue (USD Million) By Regions (2023-2030)
11.2 North America Sleep Apnea Device Revenue (USD Million) by Type, and Applications (2023-2030)
11.2.1 North America Sleep Apnea Device Revenue (USD) Million by Country (2023-2030)
11.2.2 North America Sleep Apnea Device Revenue (USD Million), by Type (2023-2030)
11.2.3 North America Sleep Apnea Device Revenue (USD Million), Market Share (%) by Applications (2023-2030)
11.3 Europe Sleep Apnea Device Revenue (USD Million), by Type, and Applications (2023-2030)
11.3.1 Europe Sleep Apnea Device Revenue (USD Million), by Country (2023-2030)
11.3.2 Europe Sleep Apnea Device Revenue (USD Million), by Type (2023-2030)
11.3.3 Europe Sleep Apnea Device Revenue (USD Million), by Applications (2023-2030)
11.4 Asia Pacific Sleep Apnea Device Revenue (USD Million) by Type, and Applications (2023-2030)
11.4.1 Asia Pacific Sleep Apnea Device Revenue (USD Million), by Country (2023-2030)
11.4.2 Asia Pacific Sleep Apnea Device Revenue (USD Million), by Type (2023-2030)
11.4.3 Asia Pacific Sleep Apnea Device Revenue (USD Million), by Applications (2023-2030)
11.5 South America Sleep Apnea Device Revenue (USD Million), by Type, and Applications (2023-2030)
11.5.1 South America Sleep Apnea Device Revenue (USD Million), by Country (2023-2030)
11.5.2 South America Sleep Apnea Device Revenue (USD Million), by Type (2023-2030)
11.5.3 South America Sleep Apnea Device Revenue (USD Million), by Applications (2023-2030)
11.6 Middle East and Africa Sleep Apnea Device Revenue (USD Million), by Type, and Applications (2023-2030)
11.6.1 Middle East and Africa Sleep Apnea Device Revenue (USD Million), by region (2023-2030)
11.6.2 Middle East and Africa Sleep Apnea Device Revenue (USD Million), by Type (2023-2030)
11.6.3 Middle East and Africa Sleep Apnea Device Revenue (USD Million), by Applications (2023-2030)
12 Methodology and Data Sources
12.1 Methodology/Research Approach
12.1.1 Research Programs/Design
12.1.2 Market Size Estimation
12.1.3 Market Breakdown and Data Triangulation
12.2 Data Sources
12.2.1 Secondary Sources
12.2.2 Primary Sources
12.3 Disclaimer
List of Tables
Table 1 Market Segmentation Analysis
Table 2 Global Sleep Apnea Device Market Companies with Areas Served
Table 3 Products Offerings Global Sleep Apnea Device Market
Table 4 Low Growth Scenario Forecasts
Table 5 Reference Case Growth Scenario
Table 6 High Growth Case Scenario
Table 7 Global Sleep Apnea Device Revenue (USD Million) And CAGR (%) By Type (2018-2030)
Table 8 Global Sleep Apnea Device Revenue (USD Million) And CAGR (%) By Applications (2018-2030)
Table 9 Global Sleep Apnea Device Revenue (USD Million) And CAGR (%) By Regions (2018-2030)
Table 10 Global Sleep Apnea Device Revenue (USD Million) By Type (2018-2022)
Table 11 Global Sleep Apnea Device Revenue Market Share (%) By Type (2018-2022)
Table 12 Global Sleep Apnea Device Revenue (USD Million) By Applications (2018-2022)
Table 13 Global Sleep Apnea Device Revenue Market Share (%) By Applications (2018-2022)
Table 14 Global Sleep Apnea Device Market Revenue (USD Million) By Regions (2018-2022)
Table 15 Global Sleep Apnea Device Market Share (%) By Regions (2018-2022)
Table 16 North America Sleep Apnea Device Revenue (USD Million) By Country (2018-2022)
Table 17 North America Sleep Apnea Device Revenue (USD Million) By Type (2018-2022)
Table 18 North America Sleep Apnea Device Revenue (USD Million) By Applications (2018-2022)
Table 19 Europe Sleep Apnea Device Revenue (USD Million) By Country (2018-2022)
Table 20 Europe Sleep Apnea Device Revenue (USD Million) By Type (2018-2022)
Table 21 Europe Sleep Apnea Device Revenue (USD Million) By Applications (2018-2022)
Table 22 Asia Pacific Sleep Apnea Device Revenue (USD Million) By Country (2018-2022)
Table 23 Asia Pacific Sleep Apnea Device Revenue (USD Million) By Type (2018-2022)
Table 24 Asia Pacific Sleep Apnea Device Revenue (USD Million) By Applications (2018-2022)
Table 25 South America Sleep Apnea Device Revenue (USD Million) By Country (2018-2022)
Table 26 South America Sleep Apnea Device Revenue (USD Million) By Type (2018-2022)
Table 27 South America Sleep Apnea Device Revenue (USD Million) By Applications (2018-2022)
Table 28 Middle East and Africa Sleep Apnea Device Revenue (USD Million) By Region (2018-2022)
Table 29 Middle East and Africa Sleep Apnea Device Revenue (USD Million) By Type (2018-2022)
Table 30 Middle East and Africa Sleep Apnea Device Revenue (USD Million) By Applications (2018-2022)
Table 31 Financial Analysis
Table 32 Global Sleep Apnea Device Revenue (USD Million) By Type (2023-2030)
Table 33 Global Sleep Apnea Device Revenue Market Share (%) By Type (2023-2030)
Table 34 Global Sleep Apnea Device Revenue (USD Million) By Applications (2023-2030)
Table 35 Global Sleep Apnea Device Revenue Market Share (%) By Applications (2023-2030)
Table 36 Global Sleep Apnea Device Market Revenue (USD Million), And Revenue (USD Million) By Regions (2023-2030)
Table 37 North America Sleep Apnea Device Revenue (USD)By Country (2023-2030)
Table 38 North America Sleep Apnea Device Revenue (USD Million) By Type (2023-2030)
Table 39 North America Sleep Apnea Device Revenue (USD Million) By Applications (2023-2030)
Table 40 Europe Sleep Apnea Device Revenue (USD Million) By Country (2023-2030)
Table 41 Europe Sleep Apnea Device Revenue (USD Million) By Type (2023-2030)
Table 42 Europe Sleep Apnea Device Revenue (USD Million) By Applications (2023-2030)
Table 43 Asia Pacific Sleep Apnea Device Revenue (USD Million) By Country (2023-2030)
Table 44 Asia Pacific Sleep Apnea Device Revenue (USD Million) By Type (2023-2030)
Table 45 Asia Pacific Sleep Apnea Device Revenue (USD Million) By Applications (2023-2030)
Table 46 South America Sleep Apnea Device Revenue (USD Million) By Country (2023-2030)
Table 47 South America Sleep Apnea Device Revenue (USD Million) By Type (2023-2030)
Table 48 South America Sleep Apnea Device Revenue (USD Million) By Applications (2023-2030)
Table 49 Middle East and Africa Sleep Apnea Device Revenue (USD Million) By Region (2023-2030)
Table 50 Middle East and Africa Sleep Apnea Device Revenue (USD Million) By Region (2023-2030)
Table 51 Middle East and Africa Sleep Apnea Device Revenue (USD Million) By Type (2023-2030)
Table 52 Middle East and Africa Sleep Apnea Device Revenue (USD Million) By Applications (2023-2030)
Table 53 Research Programs/Design for This Report
Table 54 Key Data Information from Secondary Sources
Table 55 Key Data Information from Primary Sources
List of Figures
Figure 1 Market Scope
Figure 2 Porter’s Five Forces
Figure 3 Global Sleep Apnea Device Revenue (USD Million) By Type (2018-2022)
Figure 4 Global Sleep Apnea Device Revenue Market Share (%) By Type (2022)
Figure 5 Global Sleep Apnea Device Revenue (USD Million) By Applications (2018-2022)
Figure 6 Global Sleep Apnea Device Revenue Market Share (%) By Applications (2022)
Figure 7 Global Sleep Apnea Device Market Revenue (USD Million) By Regions (2018-2022)
Figure 8 Global Sleep Apnea Device Market Share (%) By Regions (2022)
Figure 9 North America Sleep Apnea Device Revenue (USD Million) By Country (2018-2022)
Figure 10 North America Sleep Apnea Device Revenue (USD Million) By Type (2018-2022)
Figure 11 North America Sleep Apnea Device Revenue (USD Million) By Applications (2018-2022)
Figure 12 Europe Sleep Apnea Device Revenue (USD Million) By Country (2018-2022)
Figure 13 Europe Sleep Apnea Device Revenue (USD Million) By Type (2018-2022)
Figure 14 Europe Sleep Apnea Device Revenue (USD Million) By Applications (2018-2022)
Figure 15 Asia Pacific Sleep Apnea Device Revenue (USD Million) By Country (2018-2022)
Figure 16 Asia Pacific Sleep Apnea Device Revenue (USD Million) By Type (2018-2022)
Figure 17 Asia Pacific Sleep Apnea Device Revenue (USD Million) By Applications (2018-2022)
Figure 18 South America Sleep Apnea Device Revenue (USD Million) By Country (2018-2022)
Figure 19 South America Sleep Apnea Device Revenue (USD Million) By Type (2018-2022)
Figure 20 South America Sleep Apnea Device Revenue (USD Million) By Applications (2018-2022)
Figure 21 Middle East and Africa Sleep Apnea Device Revenue (USD Million) By Region (2018-2022)
Figure 22 Middle East and Africa Sleep Apnea Device Revenue (USD Million) By Type (2018-2022)
Figure 23 Middle East and Africa Sleep Apnea Device Revenue (USD Million) By Applications (2018-2022)
Figure 24 Global Sleep Apnea Device Revenue (USD Million) By Type (2023-2030)
Figure 25 Global Sleep Apnea Device Revenue Market Share (%) By Type (2030)
Figure 26 Global Sleep Apnea Device Revenue (USD Million) By Applications (2023-2030)
Figure 27 Global Sleep Apnea Device Revenue Market Share (%) By Applications (2030)
Figure 28 Global Sleep Apnea Device Market Revenue (USD Million) By Regions (2023-2030)
Figure 29 North America Sleep Apnea Device Revenue (USD Million) By Country (2023-2030)
Figure 30 North America Sleep Apnea Device Revenue (USD Million) By Type (2023-2030)
Figure 31 North America Sleep Apnea Device Revenue (USD Million) By Applications (2023-2030)
Figure 32 Europe Sleep Apnea Device Revenue (USD Million) By Country (2023-2030)
Figure 33 Europe Sleep Apnea Device Revenue (USD Million) By Type (2023-2030)
Figure 34 Europe Sleep Apnea Device Revenue (USD Million) By Applications (2023-2030)
Figure 35 Asia Pacific Sleep Apnea Device Revenue (USD Million) By Country (2023-2030)
Figure 36 Asia Pacific Sleep Apnea Device Revenue (USD Million) By Type (2023-2030)
Figure 37 Asia Pacific Sleep Apnea Device Revenue (USD Million) By Applications (2023-2030)
Figure 38 South America Sleep Apnea Device Revenue (USD Million) By Country (2023-2030)
Figure 39 South America Sleep Apnea Device Revenue (USD Million) By Type (2023-2030)
Figure 40 South America Sleep Apnea Device Revenue (USD Million) By Applications (2023-2030)
Figure 41 Middle East and Africa Sleep Apnea Device Revenue (USD Million) By Region (2023-2030)
Figure 42 Middle East and Africa Sleep Apnea Device Revenue (USD Million) By Region (2023-2030)
Figure 43 Middle East and Africa Sleep Apnea Device Revenue (USD Million) By Type (2023-2030)
Figure 44 Middle East and Africa Sleep Apnea Device Revenue (USD Million) By Applications (2023-2030)
Figure 45 Bottom-Up and Top-Down Approaches for This Report
Figure 46 Data Triangulation
