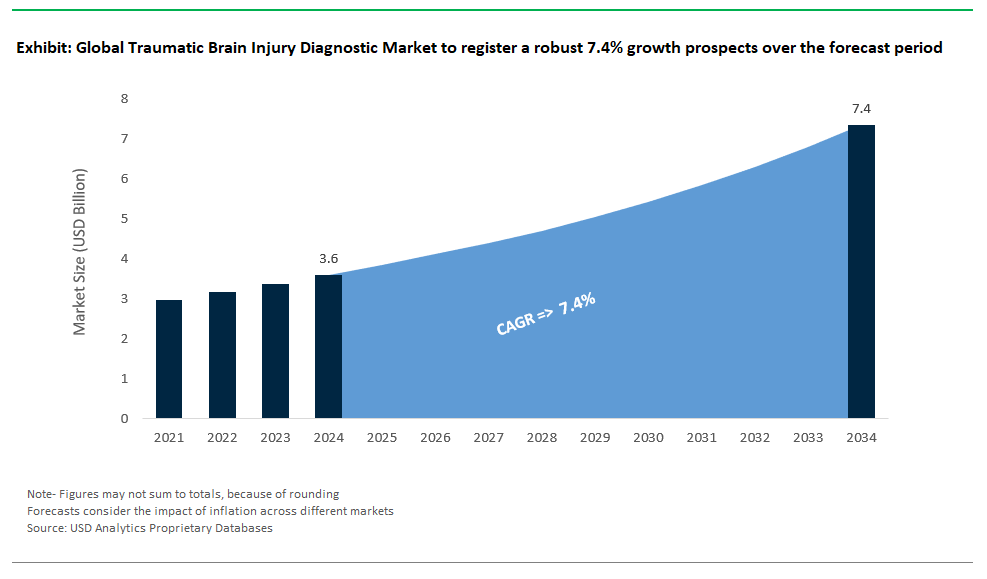
Global Traumatic Brain Injury Diagnostic Market Size is valued at $3.6 Billion in 2024 and is forecast to register a growth rate (CAGR) of 7.4% to reach $7.4 Billion by 2034.
The market growth is driven predominantly by the rising number of TBI cases, often associated with sports injuries, accidents, and military conflicts, and is a significant driver for the TBI diagnostic market.Leading companies are focusing on Advanced Imaging Modalities, Biomarker Research, AI and Machine Learning Integration, Personalized Medicine, and others boosting market shares in the industry.
Traumatic Brain Injury Diagnostic Market Overview
The Traumatic Brain Injury (TBI) Diagnostic Market focuses on the diagnosis and assessment of brain injuries, driven by the increasing incidence of TBIs worldwide. It encompasses various diagnostic modalities, including neuroimaging and blood biomarkers, with notable advancements in technology and AI. Telemedicine and point-of-care testing are emerging trends, enhancing access to diagnosis and follow-up care. Regulatory standards are becoming more prominent, and interdisciplinary collaborations are fostering innovation. The market's future growth is expected due to rising TBI awareness and the pursuit of personalized diagnostic solutions to improve patient outcomes.
Traumatic Brain Injury (TBI) Diagnostic Market Competitive Landscape
The market report analyses the leading companies in the industry including ABCDx, Banyan Biomarkers, BioDirection, Brainbox Solution, BrainScope, ImPACT Application, InfraScan, Oculogica, Quintero, and Others.
Traumatic Brain Injury Diagnostic Market Dynamics
Traumatic Brain Injury Diagnostic Market Trends- Companies are launching Artificial Intelligence (AI) and Machine Learningto attract a consumer base.
Artificial Intelligence (AI) and machine learning are transforming the Traumatic Brain Injury (TBI) diagnostic market by automating image analysis for early detection, predicting patient outcomes, personalizing treatment plans, streamlining workflow, enabling remote monitoring, aiding in research, optimizing rehabilitation, ensuring regulatory compliance, and enhancing healthcare professional training, ultimately improving the accuracy, efficiency, and personalized care in TBI diagnosis and management.
Traumatic Brain Injury Diagnostic Market Driver- Advances in Imaging Technologydemand for efficient Traumatic Brain Injury Diagnostic Market
Advances in neuroimaging technology, including CT scans, MRI, fMRI, DTI, and SWI, have significantly enhanced the Traumatic Brain Injury (TBI) diagnostic market by providing clearer and more detailed brain images, improving accuracy in detecting and assessing injuries, and enabling timely and effective TBI diagnosis and patient care.
Traumatic Brain Injury Diagnostic Market Opportunity-Introduction of Telemedicine and Remote Monitoring
Telemedicine and remote monitoring are pivotal in the Traumatic Brain Injury (TBI) diagnostic market, enabling real-time patient assessment, remote consultations, and improved monitoring of TBI cases, especially in situations with limited physical access to healthcare facilities, thereby enhancing diagnostic and management outcomes.
Traumatic Brain Injury Diagnostic Market Share Analysis- Imaging devices is poised to register the fastest growth rate (CAGR) over the forecast period from 2025 to 2034.
The global Traumatic Brain Injury Diagnostic Marketanalyzesimaging devices, Monitoring Devices, and others. Of these, imaging devices are poised to register the fastest growth.Telemedicine and remote monitoring are pivotal in the Traumatic Brain Injury (TBI) diagnostic market, enabling real-time patient assessment, remote consultations, and improved monitoring of TBI cases, especially in situations with limited physical access to healthcare facilities, thereby enhancing diagnostic and management outcomes.
Traumatic Brain Injury Diagnostic Market Share Analysis-Instruments held a significant market share in 2024.
The global Traumatic Brain Injury Diagnostic Marketis analyzed across a wide range of End users including Instruments, Consumable, and others. Of these, Instrumentsheld a significant market share in 2023.Imaging devices, encompassing CT scans, MRI, fMRI, and advanced techniques like DTI and SWI, are pivotal in the Traumatic Brain Injury (TBI) diagnostic market, enabling precise visualization of brain structures and injuries, thereby facilitating accurate and timely diagnosis and assessment of TBI severity, ultimately improving patient care and diagnostic capabilities.
Traumatic Brain Injury Diagnostic Market Report Scope
|
Parameter
|
Details
|
|
Market Size (2024)
|
$3.6 Billion
|
|
Market Size (2034)
|
$7.4 Billion
|
|
Market Growth Rate
|
7.4%
|
|
Segments
|
By Type (Consumable, Instruments), By Device (Imaging Devices, Monitoring Devices), By End User (Hospitals, Diagnostic Centers, Others), By Channel (Direct Sales, Distribution Channel)
|
|
Study Period
|
2019- 2024 and 2025-2034
|
|
Units
|
Revenue (USD)
|
|
Qualitative Analysis
|
Porter’s Five Forces, SWOT Profile, Market Share, Scenario Forecasts, Market Ecosystem, Company Ranking, Market Dynamics, Industry Benchmarking
|
|
Companies
|
ABCDx, Banyan Biomarkers, BioDirection, Brainbox Solution, BrainScope, ImPACT Application, InfraScan, Oculogica, Quintero, and Others.
|
|
Countries
|
US, Canada, Mexico, Germany, France, Spain, Italy, UK, Russia, China, India, Japan, South Korea, Australia, South East Asia, Brazil, Argentina, Middle East, Africa
|
Traumatic Brain Injury Diagnostic Market Segmentation
By Type
By Device
- Imaging Devices
- Monitoring Devices
By End User
- Hospitals
- Diagnostic Centers
- Others
By Channel
- Direct Sales
- Distribution Channel
By Region
- North America (United States, Canada, Mexico)
- Europe (Germany, France, United Kingdom, Spain, Italy, Others)
- Asia Pacific (China, India, Japan, South Korea, Australia, Others)
- Latin America (Brazil, Argentina, Others)
- Middle East and Africa (Saudi Arabia, UAE, Kuwait, Other Middle East, South Africa, Nigeria, Other Africa)
Traumatic Brain Injury Diagnostic Market Companies Profiled in the Study
- ImPACT Application
- Banyan Biomarkers
- BrainScope
- InfraScan
- Brainbox Solution
- Oculogica
- BioDirection
- ABCDx
- Quintero
* List not exhaustive
Traumatic Brain Injury Diagnostic Market Outlook 2023
1 Market Overview
1.1 Introduction to the Traumatic Brain Injury Diagnostic Market
1.2 Scope of the Study
1.3 Research Objective
1.3.1 Key Market Scope and Segments
1.3.2 Players Covered
1.3.3 Years Considered
2 Executive Summary
2.1 2023 Traumatic Brain Injury Diagnostic Industry- Market Statistics
3 Market Dynamics
3.1 Market Drivers
3.2 Market Challenges
3.3 Market Opportunities
3.4 Market Trends
4 Market Factor Analysis
4.1 Porter’s Five Forces
4.2 Market Entropy
4.2.1 Global Traumatic Brain Injury Diagnostic Market Companies with Area Served
4.2.2 Products Offerings Global Traumatic Brain Injury Diagnostic Market
5 COVID-19 Impact Analysis and Outlook Scenarios
5.1.1 Covid-19 Impact Analysis
5.1.2 Post-COVID-19 Scenario- Low Growth Case
5.1.3 Post-COVID-19 Scenario- Reference Growth Case
5.1.4 Post-COVID-19 Scenario- Low Growth Case
6 Global Traumatic Brain Injury Diagnostic Market Trends
6.1 Global Traumatic Brain Injury Diagnostic Revenue (USD Million) and CAGR (%) by Type (2018-2030)
6.2 Global Traumatic Brain Injury Diagnostic Revenue (USD Million) and CAGR (%) by Applications (2018-2030)
6.3 Global Traumatic Brain Injury Diagnostic Revenue (USD Million) and CAGR (%) by Regions (2018-2030)
7 Global Traumatic Brain Injury Diagnostic Market Revenue (USD Million) by Type, and Applications (2018-2022)
7.1 Global Traumatic Brain Injury Diagnostic Revenue (USD Million) by Type (2018-2022)
7.1.1 Global Traumatic Brain Injury Diagnostic Revenue (USD Million), Market Share (%) by Type (2018-2022)
7.2 Global Traumatic Brain Injury Diagnostic Revenue (USD Million) by Applications (2018-2022)
7.2.1 Global Traumatic Brain Injury Diagnostic Revenue (USD Million), Market Share (%) by Applications (2018-2022)
8 Global Traumatic Brain Injury Diagnostic Development Regional Status and Outlook
8.1 Global Traumatic Brain Injury Diagnostic Revenue (USD Million) By Regions (2018-2022)
8.2 North America Traumatic Brain Injury Diagnostic Revenue (USD Million) by Type, and Application (2018-2022)
8.2.1 North America Traumatic Brain Injury Diagnostic Revenue (USD Million) by Country (2018-2022)
8.2.2 North America Traumatic Brain Injury Diagnostic Revenue (USD Million) by Type (2018-2022)
8.2.3 North America Traumatic Brain Injury Diagnostic Revenue (USD Million) by Applications (2018-2022)
8.3 Europe Traumatic Brain Injury Diagnostic Revenue (USD Million), by Type, and Applications (USD Million) (2018-2022)
8.3.1 Europe Traumatic Brain Injury Diagnostic Revenue (USD Million), by Country (2018-2022)
8.3.2 Europe Traumatic Brain Injury Diagnostic Revenue (USD Million) by Type (2018-2022)
8.3.3 Europe Traumatic Brain Injury Diagnostic Revenue (USD Million) by Applications (2018-2022)
8.4 Asia Pacific Traumatic Brain Injury Diagnostic Revenue (USD Million), and Revenue (USD Million) by Type, and Applications (2018-2022)
8.4.1 Asia Pacific Traumatic Brain Injury Diagnostic Revenue (USD Million) by Country (2018-2022)
8.4.2 Asia Pacific Traumatic Brain Injury Diagnostic Revenue (USD Million) by Type (2018-2022)
8.4.3 Asia Pacific Traumatic Brain Injury Diagnostic Revenue (USD Million) by Applications (2018-2022)
8.5 South America Traumatic Brain Injury Diagnostic Revenue (USD Million), by Type, and Applications (2018-2022)
8.5.1 South America Traumatic Brain Injury Diagnostic Revenue (USD Million), by Country (2018-2022)
8.5.2 South America Traumatic Brain Injury Diagnostic Revenue (USD Million) by Type (2018-2022)
8.5.3 South America Traumatic Brain Injury Diagnostic Revenue (USD Million) by Applications (2018-2022)
8.6 Middle East and Africa Traumatic Brain Injury Diagnostic Revenue (USD Million), by Type, Technology, Application, Thickness (2018-2022)
8.6.1 Middle East and Africa Traumatic Brain Injury Diagnostic Revenue (USD Million) by Country (2018-2022)
8.6.2 Middle East and Africa Traumatic Brain Injury Diagnostic Revenue (USD Million) by Type (2018-2022)
8.6.3 Middle East and Africa Traumatic Brain Injury Diagnostic Revenue (USD Million) by Applications (2018-2022)
9 Company Profiles
10 Global Traumatic Brain Injury Diagnostic Market Revenue (USD Million), by Type, and Applications (2023-2030)
10.1 Global Traumatic Brain Injury Diagnostic Revenue (USD Million) and Market Share (%) by Type (2023-2030)
10.1.1 Global Traumatic Brain Injury Diagnostic Revenue (USD Million), and Market Share (%) by Type (2023-2030)
10.2 Global Traumatic Brain Injury Diagnostic Revenue (USD Million) and Market Share (%) by Applications (2023-2030)
10.2.1 Global Traumatic Brain Injury Diagnostic Revenue (USD Million), and Market Share (%) by Applications (2023-2030)
11 Global Traumatic Brain Injury Diagnostic Development Regional Status and Outlook Forecast
11.1 Global Traumatic Brain Injury Diagnostic Revenue (USD Million) By Regions (2023-2030)
11.2 North America Traumatic Brain Injury Diagnostic Revenue (USD Million) by Type, and Applications (2023-2030)
11.2.1 North America Traumatic Brain Injury Diagnostic Revenue (USD) Million by Country (2023-2030)
11.2.2 North America Traumatic Brain Injury Diagnostic Revenue (USD Million), by Type (2023-2030)
11.2.3 North America Traumatic Brain Injury Diagnostic Revenue (USD Million), Market Share (%) by Applications (2023-2030)
11.3 Europe Traumatic Brain Injury Diagnostic Revenue (USD Million), by Type, and Applications (2023-2030)
11.3.1 Europe Traumatic Brain Injury Diagnostic Revenue (USD Million), by Country (2023-2030)
11.3.2 Europe Traumatic Brain Injury Diagnostic Revenue (USD Million), by Type (2023-2030)
11.3.3 Europe Traumatic Brain Injury Diagnostic Revenue (USD Million), by Applications (2023-2030)
11.4 Asia Pacific Traumatic Brain Injury Diagnostic Revenue (USD Million) by Type, and Applications (2023-2030)
11.4.1 Asia Pacific Traumatic Brain Injury Diagnostic Revenue (USD Million), by Country (2023-2030)
11.4.2 Asia Pacific Traumatic Brain Injury Diagnostic Revenue (USD Million), by Type (2023-2030)
11.4.3 Asia Pacific Traumatic Brain Injury Diagnostic Revenue (USD Million), by Applications (2023-2030)
11.5 South America Traumatic Brain Injury Diagnostic Revenue (USD Million), by Type, and Applications (2023-2030)
11.5.1 South America Traumatic Brain Injury Diagnostic Revenue (USD Million), by Country (2023-2030)
11.5.2 South America Traumatic Brain Injury Diagnostic Revenue (USD Million), by Type (2023-2030)
11.5.3 South America Traumatic Brain Injury Diagnostic Revenue (USD Million), by Applications (2023-2030)
11.6 Middle East and Africa Traumatic Brain Injury Diagnostic Revenue (USD Million), by Type, and Applications (2023-2030)
11.6.1 Middle East and Africa Traumatic Brain Injury Diagnostic Revenue (USD Million), by Region (2023-2030)
11.6.2 Middle East and Africa Traumatic Brain Injury Diagnostic Revenue (USD Million), by Type (2023-2030)
11.6.3 Middle East and Africa Traumatic Brain Injury Diagnostic Revenue (USD Million), by Applications (2023-2030)
12 Methodology and Data Sources
12.1 Methodology/Research Approach
12.1.1 Research Programs/Design
12.1.2 Market Size Estimation
12.1.3 Market Breakdown and Data Triangulation
12.2 Data Sources
12.2.1 Secondary Sources
12.2.2 Primary Sources
12.3 Disclaimer
List of Tables
Table 1 Market Segmentation Analysis
Table 2 Global Traumatic Brain Injury Diagnostic Market Companies with Areas Served
Table 3 Products Offerings Global Traumatic Brain Injury Diagnostic Market
Table 4 Low Growth Scenario Forecasts
Table 5 Reference Case Growth Scenario
Table 6 High Growth Case Scenario
Table 7 Global Traumatic Brain Injury Diagnostic Revenue (USD Million) And CAGR (%) By Type (2018-2030)
Table 8 Global Traumatic Brain Injury Diagnostic Revenue (USD Million) And CAGR (%) By Applications (2018-2030)
Table 9 Global Traumatic Brain Injury Diagnostic Revenue (USD Million) And CAGR (%) By Regions (2018-2030)
Table 10 Global Traumatic Brain Injury Diagnostic Revenue (USD Million) By Type (2018-2022)
Table 11 Global Traumatic Brain Injury Diagnostic Revenue Market Share (%) By Type (2018-2022)
Table 12 Global Traumatic Brain Injury Diagnostic Revenue (USD Million) By Applications (2018-2022)
Table 13 Global Traumatic Brain Injury Diagnostic Revenue Market Share (%) By Applications (2018-2022)
Table 14 Global Traumatic Brain Injury Diagnostic Market Revenue (USD Million) By Regions (2018-2022)
Table 15 Global Traumatic Brain Injury Diagnostic Market Share (%) By Regions (2018-2022)
Table 16 North America Traumatic Brain Injury Diagnostic Revenue (USD Million) By Country (2018-2022)
Table 17 North America Traumatic Brain Injury Diagnostic Revenue (USD Million) By Type (2018-2022)
Table 18 North America Traumatic Brain Injury Diagnostic Revenue (USD Million) By Applications (2018-2022)
Table 19 Europe Traumatic Brain Injury Diagnostic Revenue (USD Million) By Country (2018-2022)
Table 20 Europe Traumatic Brain Injury Diagnostic Revenue (USD Million) By Type (2018-2022)
Table 21 Europe Traumatic Brain Injury Diagnostic Revenue (USD Million) By Applications (2018-2022)
Table 22 Asia Pacific Traumatic Brain Injury Diagnostic Revenue (USD Million) By Country (2018-2022)
Table 23 Asia Pacific Traumatic Brain Injury Diagnostic Revenue (USD Million) By Type (2018-2022)
Table 24 Asia Pacific Traumatic Brain Injury Diagnostic Revenue (USD Million) By Applications (2018-2022)
Table 25 South America Traumatic Brain Injury Diagnostic Revenue (USD Million) By Country (2018-2022)
Table 26 South America Traumatic Brain Injury Diagnostic Revenue (USD Million) By Type (2018-2022)
Table 27 South America Traumatic Brain Injury Diagnostic Revenue (USD Million) By Applications (2018-2022)
Table 28 Middle East and Africa Traumatic Brain Injury Diagnostic Revenue (USD Million) By Region (2018-2022)
Table 29 Middle East and Africa Traumatic Brain Injury Diagnostic Revenue (USD Million) By Type (2018-2022)
Table 30 Middle East and Africa Traumatic Brain Injury Diagnostic Revenue (USD Million) By Applications (2018-2022)
Table 31 Financial Analysis
Table 32 Global Traumatic Brain Injury Diagnostic Revenue (USD Million) By Type (2023-2030)
Table 33 Global Traumatic Brain Injury Diagnostic Revenue Market Share (%) By Type (2023-2030)
Table 34 Global Traumatic Brain Injury Diagnostic Revenue (USD Million) By Applications (2023-2030)
Table 35 Global Traumatic Brain Injury Diagnostic Revenue Market Share (%) By Applications (2023-2030)
Table 36 Global Traumatic Brain Injury Diagnostic Market Revenue (USD Million), And Revenue (USD Million) By Regions (2023-2030)
Table 37 North America Traumatic Brain Injury Diagnostic Revenue (USD)By Country (2023-2030)
Table 38 North America Traumatic Brain Injury Diagnostic Revenue (USD Million) By Type (2023-2030)
Table 39 North America Traumatic Brain Injury Diagnostic Revenue (USD Million) By Applications (2023-2030)
Table 40 Europe Traumatic Brain Injury Diagnostic Revenue (USD Million) By Country (2023-2030)
Table 41 Europe Traumatic Brain Injury Diagnostic Revenue (USD Million) By Type (2023-2030)
Table 42 Europe Traumatic Brain Injury Diagnostic Revenue (USD Million) By Applications (2023-2030)
Table 43 Asia Pacific Traumatic Brain Injury Diagnostic Revenue (USD Million) By Country (2023-2030)
Table 44 Asia Pacific Traumatic Brain Injury Diagnostic Revenue (USD Million) By Type (2023-2030)
Table 45 Asia Pacific Traumatic Brain Injury Diagnostic Revenue (USD Million) By Applications (2023-2030)
Table 46 South America Traumatic Brain Injury Diagnostic Revenue (USD Million) By Country (2023-2030)
Table 47 South America Traumatic Brain Injury Diagnostic Revenue (USD Million) By Type (2023-2030)
Table 48 South America Traumatic Brain Injury Diagnostic Revenue (USD Million) By Applications (2023-2030)
Table 49 Middle East and Africa Traumatic Brain Injury Diagnostic Revenue (USD Million) By Region (2023-2030)
Table 50 Middle East and Africa Traumatic Brain Injury Diagnostic Revenue (USD Million) By Region (2023-2030)
Table 51 Middle East and Africa Traumatic Brain Injury Diagnostic Revenue (USD Million) By Type (2023-2030)
Table 52 Middle East and Africa Traumatic Brain Injury Diagnostic Revenue (USD Million) By Applications (2023-2030)
Table 53 Research Programs/Design for This Report
Table 54 Key Data Information from Secondary Sources
Table 55 Key Data Information from Primary Sources
List of Figures
Figure 1 Market Scope
Figure 2 Porter’s Five Forces
Figure 3 Global Traumatic Brain Injury Diagnostic Revenue (USD Million) By Type (2018-2022)
Figure 4 Global Traumatic Brain Injury Diagnostic Revenue Market Share (%) By Type (2022)
Figure 5 Global Traumatic Brain Injury Diagnostic Revenue (USD Million) By Applications (2018-2022)
Figure 6 Global Traumatic Brain Injury Diagnostic Revenue Market Share (%) By Applications (2022)
Figure 7 Global Traumatic Brain Injury Diagnostic Market Revenue (USD Million) By Regions (2018-2022)
Figure 8 Global Traumatic Brain Injury Diagnostic Market Share (%) By Regions (2022)
Figure 9 North America Traumatic Brain Injury Diagnostic Revenue (USD Million) By Country (2018-2022)
Figure 10 North America Traumatic Brain Injury Diagnostic Revenue (USD Million) By Type (2018-2022)
Figure 11 North America Traumatic Brain Injury Diagnostic Revenue (USD Million) By Applications (2018-2022)
Figure 12 Europe Traumatic Brain Injury Diagnostic Revenue (USD Million) By Country (2018-2022)
Figure 13 Europe Traumatic Brain Injury Diagnostic Revenue (USD Million) By Type (2018-2022)
Figure 14 Europe Traumatic Brain Injury Diagnostic Revenue (USD Million) By Applications (2018-2022)
Figure 15 Asia Pacific Traumatic Brain Injury Diagnostic Revenue (USD Million) By Country (2018-2022)
Figure 16 Asia Pacific Traumatic Brain Injury Diagnostic Revenue (USD Million) By Type (2018-2022)
Figure 17 Asia Pacific Traumatic Brain Injury Diagnostic Revenue (USD Million) By Applications (2018-2022)
Figure 18 South America Traumatic Brain Injury Diagnostic Revenue (USD Million) By Country (2018-2022)
Figure 19 South America Traumatic Brain Injury Diagnostic Revenue (USD Million) By Type (2018-2022)
Figure 20 South America Traumatic Brain Injury Diagnostic Revenue (USD Million) By Applications (2018-2022)
Figure 21 Middle East and Africa Traumatic Brain Injury Diagnostic Revenue (USD Million) By Region (2018-2022)
Figure 22 Middle East and Africa Traumatic Brain Injury Diagnostic Revenue (USD Million) By Type (2018-2022)
Figure 23 Middle East and Africa Traumatic Brain Injury Diagnostic Revenue (USD Million) By Applications (2018-2022)
Figure 24 Global Traumatic Brain Injury Diagnostic Revenue (USD Million) By Type (2023-2030)
Figure 25 Global Traumatic Brain Injury Diagnostic Revenue Market Share (%) By Type (2030)
Figure 26 Global Traumatic Brain Injury Diagnostic Revenue (USD Million) By Applications (2023-2030)
Figure 27 Global Traumatic Brain Injury Diagnostic Revenue Market Share (%) By Applications (2030)
Figure 28 Global Traumatic Brain Injury Diagnostic Market Revenue (USD Million) By Regions (2023-2030)
Figure 29 North America Traumatic Brain Injury Diagnostic Revenue (USD Million) By Country (2023-2030)
Figure 30 North America Traumatic Brain Injury Diagnostic Revenue (USD Million) By Type (2023-2030)
Figure 31 North America Traumatic Brain Injury Diagnostic Revenue (USD Million) By Applications (2023-2030)
Figure 32 Europe Traumatic Brain Injury Diagnostic Revenue (USD Million) By Country (2023-2030)
Figure 33 Europe Traumatic Brain Injury Diagnostic Revenue (USD Million) By Type (2023-2030)
Figure 34 Europe Traumatic Brain Injury Diagnostic Revenue (USD Million) By Applications (2023-2030)
Figure 35 Asia Pacific Traumatic Brain Injury Diagnostic Revenue (USD Million) By Country (2023-2030)
Figure 36 Asia Pacific Traumatic Brain Injury Diagnostic Revenue (USD Million) By Type (2023-2030)
Figure 37 Asia Pacific Traumatic Brain Injury Diagnostic Revenue (USD Million) By Applications (2023-2030)
Figure 38 South America Traumatic Brain Injury Diagnostic Revenue (USD Million) By Country (2023-2030)
Figure 39 South America Traumatic Brain Injury Diagnostic Revenue (USD Million) By Type (2023-2030)
Figure 40 South America Traumatic Brain Injury Diagnostic Revenue (USD Million) By Applications (2023-2030)
Figure 41 Middle East and Africa Traumatic Brain Injury Diagnostic Revenue (USD Million) By Region (2023-2030)
Figure 42 Middle East and Africa Traumatic Brain Injury Diagnostic Revenue (USD Million) By Region (2023-2030)
Figure 43 Middle East and Africa Traumatic Brain Injury Diagnostic Revenue (USD Million) By Type (2023-2030)
Figure 44 Middle East and Africa Traumatic Brain Injury Diagnostic Revenue (USD Million) By Applications (2023-2030)
Figure 45 Bottom-Up and Top-Down Approaches For This Report
Figure 46 Data Triangulation
