Market Overview: Low-Conductivity EV Coolants and Immersion Fluids Redefine Thermal Management in the Antifreeze Coolant Market
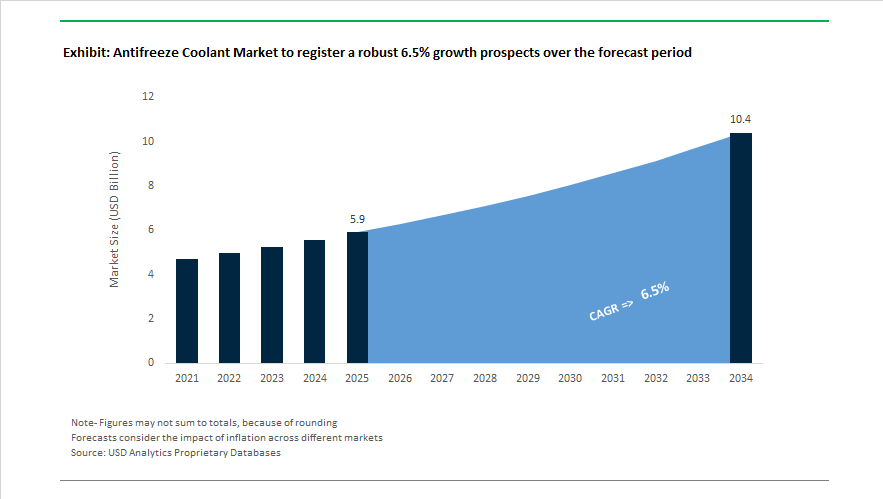
The antifreeze coolant market is valued at $5.9 billion in 2025 and is forecast to reach $10.4 billion by 2034, registering a 6.5% CAGR. Expansion is anchored in rapid electrification of mobility, tightening GHS chemical labeling standards, growth of battery electric vehicles, hydrogen fuel cell vehicles, data center immersion cooling, and longer-drain OAT and PSi-OAT extended life coolants for Euro VII engines. Thermal management fluids have evolved from conventional ethylene glycol formulations toward low electrical conductivity coolants (LECCs), ultra-low conductivity PEM fuel cell fluids, propylene glycol-based coolants, glycerin-based antifreeze, and direct liquid cooling fluids engineered for high-voltage safety, dielectric stability, and corrosion resistance. OEMs and Tier-1 suppliers are prioritizing thermal runaway mitigation, hydrogen generation control, material compatibility with aluminum alloys and polymer seals, and compliance with global chemical safety frameworks.
Regulatory and formulation shifts accelerated in May 2024 when Morris Lubricants launched its Ultralife OAT coolant series covering 169 OEM specifications, simplifying fleet compatibility. In August 2024, Wolf Lubricants upgraded its coolant portfolio to meet EU environmental restrictions, introducing EVO LL PSi-OAT fluids without borates and 2-ethylhexanoic acid. Strategic consolidation also occurred in 2024 when Recochem acquired the automotive fluids business of KIK Consumer Products, expanding its private-label antifreeze footprint in North America. Technology advancement in electrified powertrains intensified during 2024–2025 as Prestone introduced an ultra-low conductivity coolant for PEM fuel cells, engineered to prevent electrical leakage in hydrogen stacks. Industrial partnerships continued in 2024 when Valvoline extended its technology alliance with Cummins to co-develop heavy-duty long-life coolants aligned with extended drain intervals.
The electrified vehicle transition became central in September 2025 when BASF launched GLYSANTIN ELECTRIFIED in China to meet GB 29743.2-2025 LECC requirements effective October 2025. In July 2025, Shell expanded its Nissan Formula E partnership to refine EV thermal fluids under racing conditions. By June 2025, Shell also entered data center thermal management with DLC Fluid S3 for immersion cooling. A major architecture breakthrough followed in November 2025 when Shell demonstrated single-circuit BEV cooling, reducing vehicle mass and system complexity. Emerging market penetration expanded in January 2026 as BASF introduced Glysantin to Nigeria, targeting high-temperature durability. Autonomous mobility links strengthened in January 2026 when General Motors patented coolant-integrated sensor thermal control for ice mitigation. Across 2025, stricter global GHS labeling standards drove adoption of lower-toxicity propylene glycol and glycerin coolants, reinforcing the shift toward safer, high-performance thermal management fluids across automotive, hydrogen mobility, and AI data center infrastructure.
Trends and Opportunities Shaping the Antifreeze Coolant Market
The Global Antifreeze Coolant Market is undergoing a structural transformation driven by vehicle electrification, tightening environmental regulations, and the rapid scale-up of energy storage systems. Traditional ethylene glycol–based engine coolants are increasingly being replaced by EV-specific coolants, low-conductivity thermal fluids, phosphate-free OAT formulations, and dielectric immersion cooling fluids. These shifts are redefining product specifications, additive chemistries, and lifecycle expectations across passenger EVs, commercial electric fleets, and stationary battery energy storage systems.
EV Electrification Accelerates Demand for Low-Conductivity, High-Thermal-Stability Coolants
The transition from internal combustion engines to electric vehicles is fundamentally redefining antifreeze and coolant performance requirements. Unlike ICE platforms that rely on silicate-based corrosion inhibitors, EV thermal management systems require electrically non-conductive coolants capable of protecting batteries, inverters, and power electronics from leakage currents. According to Castrol ON’s 2025 technology roadmap, more than 70% of global R&D investment by leading coolant and lubricant manufacturers is now concentrated on EV- and hybrid-specific fluids, underscoring the rapid obsolescence of conventional glycol blends.
This shift is further intensified by the adoption of 800V fast-charging architectures, highlighted at the 2025 Battery Show, where OEMs such as Porsche, Hyundai, and Kia demonstrated charging cycles under 15 minutes. These systems generate extreme thermal spikes, requiring coolants with a 25% higher heat transfer coefficient than traditional 50/50 ethylene glycol formulations. At the same time, research from the U.S. Department of Energy confirms that EV platforms are increasingly aluminum-intensive to support lightweighting goals, driving rapid uptake of phosphate-free organic acid technology (P-OAT) coolants that ensure long-term aluminum passivation without scaling or deposit formation.
Environmental and Chemical Regulations Reshape Antifreeze Base Fluid Selection
Stringent environmental and chemical safety regulations are placing sustained pressure on ethylene glycol, the long-standing antifreeze base fluid, due to its acute toxicity and disposal risks. In Europe, the European Chemicals Agency confirmed in its December 2025 update that ethylene glycol remains under active evaluation within the REACH framework. New “Consumer Right to Know” requirements, effective January 2026, mandate enhanced safety disclosures for mixtures exceeding defined EG concentration thresholds, accelerating substitution toward propylene glycol coolants and glycerin-based antifreeze solutions.
In the United States, updated guidance under the Resource Conservation and Recovery Act from the U.S. Environmental Protection Agency increasingly classifies spent antifreeze as hazardous waste due to lead and benzene contamination from aging ICE fleets. The EPA notes that adoption of closed-loop antifreeze recycling systems can reduce virgin glycol consumption by up to 30% in commercial operations. Parallel pressure is emerging from PFAS regulations, as April 2026 TSCA reporting rules require full disclosure of intentionally added PFAS, triggering widespread reformulation of coolant additives such as surfactants and defoamers to comply with global “forever chemical” bans.
Immersion Cooling Fluids Open a High-Value Segment in EV Thermal Management
Immersion or direct cooling, where battery cells are submerged in dielectric antifreeze fluids, is rapidly emerging as a next-generation solution for thermal runaway mitigation and ultra-fast charging. In July 2025, TotalEnergies and XING Mobility formalized a strategic partnership to advance immersion cooling for high-performance automotive and marine applications, demonstrating that immersion systems can double battery cycle life compared to indirect cold-plate cooling.
Safety validation is strengthening market confidence. In early 2026, Valvoline Global released 18-month test data showing its HTF DE1 dielectric fluid exceeded minimum safety benchmarks by 2.9 times, positioning immersion coolants as a critical safeguard against thermal runaway in high-density lithium-ion packs. The stringent requirement for single-phase dielectric fluids that remain liquid and non-conductive from -40°C to +80°C creates a significant barrier to entry, favoring specialty chemical leaders such as 3M, Castrol, and Shell and supporting premium pricing within the advanced antifreeze coolant market.
Extended-Life Coolants Gain Traction in Commercial EVs and Energy Storage Systems
The rapid expansion of commercial electric vehicles and battery energy storage systems is driving demand for extended life coolants (ELCs) designed to operate for a decade or more without replacement. According to the International Energy Agency, large-scale BESS deployments such as Sungrow’s 500 MWh project in Japan require substantial coolant volumes and prioritize 10 to 15-year service intervals to minimize downtime and operating costs.
Antifreeze Coolant Market Share and Segmentation Insights
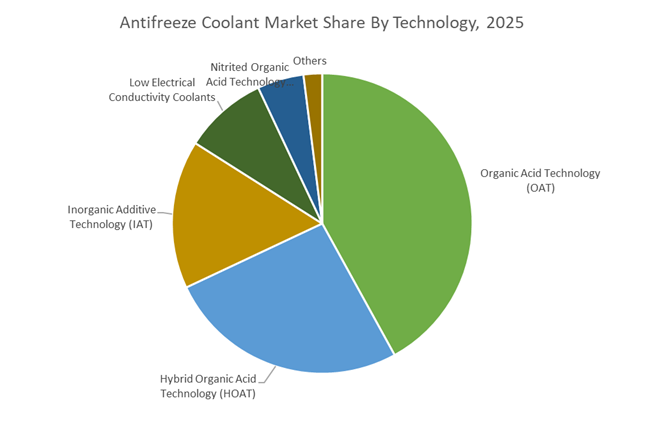
Market Share by Technology: Organic Acid Coolants Lead Volume While Low-Conductivity EV Fluids Surge
Organic Acid Technology (OAT) commands approximately 42% of the global antifreeze coolant market in 2025, establishing itself as the industry standard for passenger vehicles and heavy-duty engines. OAT formulations deliver extended service life beyond five years, superior cavitation protection, and eliminate silicates and phosphates that accelerate water pump seal wear. Hybrid Organic Acid Technology (HOAT) ranks second, combining carboxylates with silicates for aluminum protection and remains preferred by European and Asian OEM platforms. Inorganic Additive Technology (IAT), the legacy “green coolant,” continues to decline due to short two-year drain intervals, retaining relevance only in stationary engines and legacy fleets. Nitrited OAT serves niche diesel applications with wet liners. Low electrical conductivity coolants are the fastest-growing segment, driven by EV battery and power electronics cooling, maintaining conductivity below 50 μS/cm to prevent short circuits in high-voltage architectures.
Market Share by Application: Engine Cooling Anchors Demand as EV Battery Thermal Management Accelerates
Engine cooling remains the dominant application with roughly 64% market share in 2025, supported by the fact that internal combustion vehicles still comprise over 70% of the global fleet. Nearly 60% of coolant demand originates from the aftermarket, driven by routine drain-and-refill cycles every three to five years, while OEM factory-fill accounts for the balance. Battery thermal management is the fastest-growing application, as electric vehicles require precise temperature control between 20–35°C to preserve cell life and prevent thermal runaway, using indirect cold-plate systems and emerging immersion cooling designs. HVAC systems represent a steady segment, particularly in commercial buildings and data centers using glycol-water loops. Power electronics cooling covers inverters and onboard chargers, demanding low-conductivity fluids. Although ICE volumes will soften post-2030, EV thermal fluids command 3–5x higher pricing, reshaping long-term market profitability.
Antifreeze Coolant Market Competitive Landscape
The global antifreeze coolant market is undergoing a structural transformation as OEMs and fleet operators shift toward EV thermal management fluids, low-electrical conductivity coolants (LECC), extended-life OAT technologies, and circular glycol systems. Competition is intensifying around EV battery cooling, immersion cooling for data centers, and long-drain heavy-duty coolants, with leaders investing heavily in bio-based inhibitors, mass-balance production, and high-voltage safety additives. Market positioning increasingly depends on vertical integration, global distribution resilience, and compliance with emerging standards such as China’s GB 29743.2-2025. Key players are differentiating through electrified mobility solutions, 10-year service intervals, and digitally enabled aftermarket support.
Low-conductivity EV coolant leadership anchors BASF SE in electrified mobility
BASF remains the gold standard in engine and EV coolants through its nearly century-old GLYSANTIN® platform. In late 2025 and early 2026, BASF scaled its GLYSANTIN® ELECTRIFIED® LECC portfolio to meet China’s GB 29743.2-2025 safety requirements, addressing electrical conductivity and hydrogen generation risks in high-voltage battery systems. The company expanded EV-specific coolant production at its Pudong, Shanghai site to support the world’s largest NEV market. Strategically focused on “Safe-by-Design” additives, BASF mitigates fluid decomposition and fire risk in battery packs. Its Verbund integration enables mass-balance coolants with materially lower CO2 footprints, reinforcing BASF’s leadership in sustainable thermal management fluids.
E-fluid innovation and circular coolant services define Shell plc strategy
Shell has repositioned itself as a thermal management partner, advancing Shell ON e-fluids and Shell Coolant Longlife Plus for next-generation fast-charging EVs. Its 2025–2026 “Value with Less Emissions” roadmap integrates coolant supply with circular services, including glycol collection and re-refining. Shell uniquely bundles EV charging infrastructure with optimized battery cooling profiles for 350kW+ ultra-fast charging. The company also expanded collaboration with European OEMs to develop bio-based OAT inhibitors delivering 10-year service intervals for commercial fleets. Backed by a global retail footprint, Shell is scaling both direct-immersion and indirect cooling solutions, positioning itself at the intersection of EV mobility and sustainable industrial coolant systems.
Heavy-duty corrosion protection leadership strengthens Chevron Corporation market reach
Chevron dominates industrial and heavy-duty coolant segments through its Delo® and Havoline® brands, emphasizing asset life extension and aluminum protection. For 2026, Chevron pivoted toward “Equipment Optimization,” helping fleets defer capital replacement via superior corrosion control. Its latest global formulations incorporate phosphated organic acid technology (P-OAT), delivering rapid protection for modern turbocharged engines with aluminum heat exchangers. Preparing for the January 2027 PC-12 oil category, Chevron is aligning antifreeze packages with ultra-low-ash engine oils. Supported by Texaco and Caltex distribution networks, Chevron maintains one of the most resilient ethylene glycol supply chains, ensuring continuity amid geopolitical volatility.
Universal aftermarket dominance accelerates growth for Old World Industries
Old World Industries (OWI) leads the North American consumer coolant market via its PEAK® and BlueDEF® brands. Its PEAK® Antifreeze + Coolant portfolio features universal formulations compatible across vehicle platforms, simplifying DIY maintenance. In 2025–2026, OWI expanded Advanced OAT heavy-duty coolants offering one-million-mile service life without Supplemental Coolant Additives. The company also scaled e-commerce fulfillment to capture the “Direct-to-Driveway” trend. With roughly 70% of its volume driven by PEAK’s iconic retail presence and motorsport sponsorships, OWI commands exceptional aftermarket mindshare, reinforcing its position as the consumer powerhouse in long-life antifreeze solutions.
Integrated power cooling solutions differentiate TotalEnergies SE
TotalEnergies is advancing integrated power cooling across automotive and data center applications. Its GLACELF and COOLELF portfolios, including the Quartz EV Fluid line, deliver high thermal stability for e-axles and motor-coolant loops. The company’s 2026–2030 reinvestment strategy reallocates capital toward immersion cooling for AI data centers and electrified mobility. TotalEnergies specializes in climatic versatility, engineering coolants that perform in Arctic cold and Middle Eastern heat. Deep R&D alignment with its Lubrilog division enables co-development of manufacturing lubricants and operational coolants, creating a closed-loop advantage across bearings, gears, and vehicle thermal management systems.
Patented scale-control chemistry positions Prestone Products Corporation as durability specialist
Prestone differentiates through safety-driven coolant chemistry anchored by its patented Cor-Guard® technology, delivering a 10-year/300,000-mile engine life guarantee. This innovation prevents scale buildup that can reduce heat transfer efficiency by up to 40%. In 2025, Prestone introduced Smart-Test container caps enabling instant pH and freeze-point checks during service. Beyond passenger vehicles, Prestone supplies emergency responder fleets where zero-downtime thermal reliability is critical. Its 2026 “Future Runs on Prestone” campaign emphasizes digital education tools that simplify OEM coolant compatibility, strengthening trust across professional and consumer channels.
China Antifreeze Coolant: EV-Specific Regulation and Battery-Centric Coolant Engineering
China has emerged as the global regulatory and innovation frontrunner in EV-specific antifreeze coolant standards. A major inflection point occurred on October 1, 2025, with the enforcement of GB 29743.2-2025, the first national standard to codify safety and performance requirements exclusively for electric vehicle coolants. This framework has forced OEMs and chemical suppliers to redesign formulations around low electrical conductivity, thermal stability, and long-term material compatibility.
To meet this demand, BASF commenced domestic production of GLYSANTIN® ELECTRIFIED® low electrical conductivity coolants at its Pudong facility in September 2025, directly supplying Chinese New Energy Vehicle manufacturers. Technological innovation in 2025 has focused on minimizing fluid decomposition and hydrogen generation under high-voltage exposure, a critical safety parameter for battery packs. In parallel, MIIT sustainability guidelines have accelerated the transition away from ethylene glycol in urban public transport fleets. These changes are reinforced by battery manufacturers integrating smart cooling channels into Cell-to-Pack architectures, which require anti-corrosive, ultra-low-viscosity coolants to optimize pump efficiency and thermal uniformity.
United States Antifreeze Coolant: Defense-Grade Performance and EVX Thermal Systems
The United States antifreeze coolant market is increasingly bifurcated between extreme-condition defense applications and next-generation electric vehicle thermal systems. In early 2025, the U.S. Department of Defense expanded procurement of polar-grade antifreeze capable of stable operation at temperatures as low as −50°C, supporting Arctic logistics and high-altitude UAV missions. This has elevated demand for synthetic formulations with exceptional low-temperature flow and oxidation resistance.
On the commercial side, Prestone Products Corporation upgraded its 2025 product portfolio with extended longevity guarantees, leveraging proprietary Cor-Guard® technology to prevent scale formation that degrades heat transfer efficiency. Prestone also announced late-2025 capital investments into its EVX thermal management research hub, focusing on dielectric fluids suitable for megawatt charging systems. Supply chain resilience has been strengthened by Chevron Phillips Chemical, which completed low-viscosity PAO expansions to support premium synthetic coolant formulations. Additionally, logistics leaders such as FedEx and UPS have standardized pre-mixed OAT coolants across fleets, reducing maintenance downtime through formulation consistency.
India Antifreeze Coolant: Automotive Scale-Up and Climate-Specific Formulation Needs
India’s antifreeze coolant landscape is being reshaped by rapid automotive manufacturing growth and climate-driven engineering requirements. Under the Production Linked Incentive scheme, domestic OEMs such as Tata Motors and Mahindra mandated long-life HOAT coolants for new SUV platforms in 2025, pushing suppliers toward extended-drain, corrosion-resistant chemistries.
Policy support is also catalyzing bio-based innovation. Through the BioE3 Policy, government grants are supporting R&D into glycerin-derived antifreeze solutions that leverage India’s biodiesel byproduct surplus. Regulatory enforcement has intensified, with the Bureau of Indian Standards tightening monoethylene glycol purity norms in late 2025 to combat counterfeit and corrosive aftermarket products. At the same time, Indian R&D centers are prioritizing high-ambient coolant formulations engineered to maintain thermal stability in sustained temperatures exceeding 45°C, a critical requirement for heavy-duty commercial vehicles operating in extreme climates.
Germany Antifreeze Coolant: Bio-Based Transition and Precision Mobility Applications
Germany continues to anchor high-value antifreeze coolant innovation through sustainability integration and precision engineering. In late 2025, Evonik Industries and BASF disclosed that over 30% of their coolant portfolios now rely on mass-balanced bio-based feedstocks, aligning thermal management products with national climate neutrality targets for 2045.
Beyond automotive electrification, infrastructure operators are influencing formulation requirements. Deutsche Bahn updated its 2025 technical specifications to mandate antifreeze agents with zero-migration additives, protecting sensitive electronics adjacent to cooling systems in high-speed rail. In the automotive sector, German OEMs such as Volkswagen and BMW collaborated with chemical suppliers in 2025 to standardize lifetime-fill coolants for battery-electric platforms, targeting a full decade of service without coolant replacement.
Country-Level Structural Drivers in the Antifreeze Coolant Industry
Antifreeze Coolant Market County Level Snapshot
|
Country
|
Primary Catalyst
|
Strategic Direction
|
|
China
|
EV-specific national standards
|
Low-conductivity coolants and battery-integrated thermal design
|
|
United States
|
Defense and EVX systems
|
Polar-grade performance and dielectric thermal fluids
|
|
India
|
Automotive scale and climate stress
|
Long-life HOAT, bio-based antifreeze, high-ambient stability
|
|
Germany
|
Climate neutrality and precision mobility
|
Bio-based feedstocks and lifetime-fill coolant systems
|
Antifreeze Coolant Market Report Scope
Antifreeze Coolant Market
|
Parameter
|
Details
|
|
Market Size (2025)
|
$5.9 Billion
|
|
Market Size (2034)
|
$10.4 Billion
|
|
Market Growth Rate
|
6.5%
|
|
Segments
|
By Technology (Inorganic Additive Technology, Organic Acid Technology, Hybrid Organic Acid Technology, Nitrited Organic Acid Technology, Low Electrical Conductivity Coolants), By Base Fluid (Ethylene Glycol, Propylene Glycol, Glycerin Based, Water Based), By Vehicle Type (Passenger Vehicles, Commercial Vehicles, Off Road Equipment, Agricultural Machinery, Two Wheelers), By Application (Engine Cooling, Battery Thermal Management, Power Electronics Cooling, HVAC Systems), By Distribution Channel (Original Equipment Manufacturers, Aftermarket)
|
|
Study Period
|
2019- 2025 and 2026-2034
|
|
Units
|
Revenue (USD)
|
|
Qualitative Analysis
|
Porter’s Five Forces, SWOT Profile, Market Share, Scenario Forecasts, Market Ecosystem, Company Ranking, Market Dynamics, Industry Benchmarking
|
|
Companies
|
BASF SE, Chevron Corporation, Shell plc, Exxon Mobil Corporation, Prestone Products Corporation, Old World Industries, Valvoline, TotalEnergies, Sinopec Lubricant Company, CCI Corporation, Recochem, Castrol, Motul, Petronas Lubricants International, Gulf Oil International
|
|
Countries
|
US, Canada, Mexico, Germany, France, Spain, Italy, UK, Russia, China, India, Japan, South Korea, Australia, South East Asia, Brazil, Argentina, Middle East, Africa
|
Antifreeze Coolant Market Segmentation
By Technology
- Inorganic Additive Technology
- Organic Acid Technology
- Hybrid Organic Acid Technology
- Nitrited Organic Acid Technology
- Low Electrical Conductivity Coolants
By Base Fluid
- Ethylene Glycol
- Propylene Glycol
- Glycerin Based
- Water Based
By Vehicle Type
- Passenger Vehicles
- Commercial Vehicles
- Off Road Equipment
- Agricultural Machinery
- Two Wheelers
By Application
- Engine Cooling
- Battery Thermal Management
- Power Electronics Cooling
- HVAC Systems
By Distribution Channel
- Original Equipment Manufacturers
- Aftermarket
By Region
- North America (United States, Canada, Mexico)
- Europe (Germany, France, United Kingdom, Spain, Italy, Rest of Europe)
- Asia Pacific (China, India, Japan, South Korea, Australia, Rest of APAC)
- South and Central America (Brazil, Argentina, Rest of SCA)
- Middle East and Africa (Saudi Arabia, UAE, South Africa, Rest of Middle East, Rest of Africa)
Top Companies in Antifreeze Coolant Industry
- BASF SE
- Chevron Corporation
- Shell plc
- Exxon Mobil Corporation
- Prestone Products Corporation
- Old World Industries
- Valvoline
- TotalEnergies
- Sinopec Lubricant Company
- CCI Corporation
- Recochem
- Castrol
- Motul
- Petronas Lubricants International
- Gulf Oil International
*- List not Exhaustive
