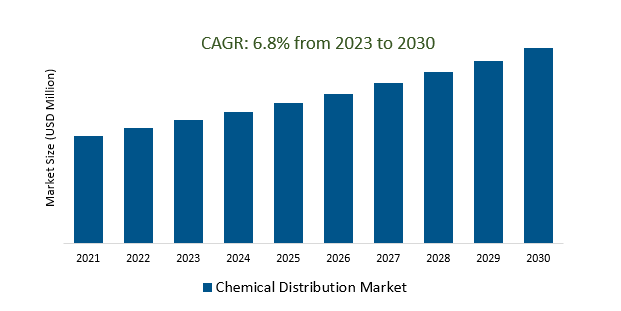
The Global Chemical Distribution Market Size is estimated to register 6.8% growth over the forecast period from 2023 to 2030.
The market growth is driven by an increasing improvement in the efficiency of sourcing and supply chain management is crucial for cost reduction and competitiveness in the chemical distribution industry. Leading Companies focusing on Digital Transformation, Sustainability and Green Chemistry, E-commerce Growth, Regulatory Compliance, Market Expansion into Emerging Economies, Health and Safety Focus, and others to boost market shares in the industry.
Market Overview
The chemical distribution market serves as a vital link in the global supply chain, facilitating the distribution, storage, and transportation of a diverse array of chemicals. Characterized by its substantial market size, the industry is driven by factors such as regulatory compliance, digital transformation, specialization, sustainability, and e-commerce growth. As a key player in the chemical industry, distributors work to meet the complex demands of various end-use sectors while navigating challenges related to pricing volatility, shifting regulations, and fierce competition. The market's future outlook remains positive, with growth anticipated through continued adaptation to industry trends and evolving customer needs.
Market Dynamics
Market Trends- Specialty chemicals are acting as a catalyst for growth in the chemical distribution market.
The growing demand for specialty chemicals, designed for specific applications, is a key driver of growth in the chemical distribution market. Distributors are increasingly focusing on sourcing and delivering these high-value chemicals to meet industry-specific needs, aligning with the broader trend of offering customized solutions and compliance expertise. As specialty chemical demand continues to rise, chemical distributors play a vital role in bridging the gap between manufacturers and end-users, ensuring efficient and safe delivery to specific applications.
Market Driver- The demand for sustainability and green chemistry is driving growth in the chemical distribution market.
The chemical distribution market is experiencing growth driven by the increasing demand for sustainability and green chemistry practices. This shift toward eco-friendly solutions in response to environmental concerns and regulations aligns with global efforts to reduce the environmental impact of chemicals, positioning chemical distributors to play a vital role in facilitating this transition and further driving market expansion.
Market Opportunity- Consolidation and mergers and acquisitions (M&A) are shaping the landscape of the chemical distribution market.
Consolidation and mergers and acquisitions (M&A) are fundamentally reshaping the chemical distribution market landscape. In recent years, the industry has witnessed a significant trend of larger chemical distribution companies acquiring smaller players, resulting in a more concentrated market. These strategic moves aim to expand product portfolios, and geographic reach, and enhance overall competitiveness. The evolving landscape indicates a growing focus on economies of scale, efficient supply chain management, and enhanced service capabilities as distributors seek to position themselves as dominant players in this dynamic market.
Market Share Analysis- Specialty Chemicals the Chemical Distribution Market will register significant growth
The Global Chemical Distribution Market is analyzed across Specialty Chemicals (CASE, Agrochemicals, Electronic, Construction, Specialty Polymers and resins, Personal Care and pharmaceuticals, and Others), Commodity Chemicals (Plastic and polymers, Synthetic Rubber, Explosives, Petrochemicals, Others) and others. Specialty Chemicals is poised to register significant growth. Specialty chemicals are a driving force in the chemical distribution market, serving specific and high-value applications in industries like pharmaceuticals and electronics. Distributors are actively meeting the growing demand for these specialized products by offering tailored solutions, value-added services, and compliance expertise, thus enhancing their significance within the market.
Market Share Analysis- Commodity Chemicals held a significant market share in 2023
The Global Chemical Distribution Market is analyzed across various End Users including Specialty Chemicals (Automotive & Transportation, Construction, Agriculture, Industrial Manufacturing, Consumer Goods, Textiles, Pharmaceuticals, Others), Commodity Chemicals (Downstream chemicals, Textile, Electrical, and electronics, Automotive & Transportation, Industrial Manufacturing, Others), and others. Of these, Commodity Chemicals held a significant market share in 2023. Commodity chemicals form the core of the chemical distribution market, serving as essential, high-volume raw materials for numerous industries. These chemicals are vital components in manufacturing, agriculture, and construction. Chemical distributors play a central role in maintaining a dependable and efficient supply chain for these fundamental products.
Chemical Distribution Market Segmentation
By Type
- Specialty Chemicals (CASE, Agrochemicals, Electronic, Construction, Specialty Polymers & Resins, Personal Care & Pharmaceuticals, Others)
- Commodity Chemicals (Plastic & Polymers, Synthetic Rubber, Explosives, Petrochemicals, Others)
By End-User
- Specialty Chemicals (Automotive & Transportation, Construction, Agriculture, Industrial Manufacturing, Consumer Goods, Textiles, Pharmaceuticals, Others)
- Commodity Chemicals (Downstream chemicals, Textile, Electrical & Electronics, Automotive & Transportation, Industrial Manufacturing, Others)
By Region
- North America (United States, Canada, Mexico)
- Europe (Germany, France, United Kingdom, Spain, Italy, Others)
- Asia Pacific (China, India, Japan, South Korea, Australia, Others)
- Latin America (Brazil, Argentina, Others)
- Middle East and Africa (Saudi Arabia, UAE, Kuwait, Other Middle East, South Africa, Nigeria, Other Africa)
Chemical Distribution Market Companies
- Brenntag AG
- Helm AG
- Univar Solutions Inc
- Ter Group
- Barentz
- Azelis
- Safic Alan
- ICC Industries Inc
- Jebsen & Jessen Pte Ltd
- Quimidroga
- Solvadis Deutschland GmbH
- Ashland
- Caldic B.V.
- REDA Chemicals
- Wilbur Ellis Holdings Inc
- Omya AG
- Manuchar
- IMCC
- Biesterfeld AG
- Stockmeier Group
*List not exhaustive
Chemical Distribution Market Outlook 2023
1 Market Overview
1.1 Introduction to the Chemical Distribution Market
1.2 Scope of the Study
1.3 Research Objective
1.3.1 Key Market Scope and Segments
1.3.2 Players Covered
1.3.3 Years Considered
2 Executive Summary
2.1 2023 Chemical Distribution Industry- Market Statistics
3 Market Dynamics
3.1 Market Drivers
3.2 Market Challenges
3.3 Market Opportunities
3.4 Market Trends
4 Market Factor Analysis
4.1 Porter’s Five Forces
4.2 Market Entropy
4.2.1 Global Chemical Distribution Market Companies with Area Served
4.2.2 Products Offerings Global Chemical Distribution Market
5 COVID-19 Impact Analysis and Outlook Scenarios
5.1.1 Covid-19 Impact Analysis
5.1.2 post-COVID-19 Scenario- Low Growth Case
5.1.3 post-COVID-19 Scenario- Reference Growth Case
5.1.4 post-COVID-19 Scenario- Low Growth Case
6 Global Chemical Distribution Market Trends
6.1 Global Chemical Distribution Revenue (USD Million) and CAGR (%) by Type (2018-2030)
6.2 Global Chemical Distribution Revenue (USD Million) and CAGR (%) by Applications (2018-2030)
6.3 Global Chemical Distribution Revenue (USD Million) and CAGR (%) by regions (2018-2030)
7 Global Chemical Distribution Market Revenue (USD Million) by Type, and Applications (2018-2022)
7.1 Global Chemical Distribution Revenue (USD Million) by Type (2018-2022)
7.1.1 Global Chemical Distribution Revenue (USD Million), Market Share (%) by Type (2018-2022)
7.2 Global Chemical Distribution Revenue (USD Million) by Applications (2018-2022)
7.2.1 Global Chemical Distribution Revenue (USD Million), Market Share (%) by Applications (2018-2022)
8 Global Chemical Distribution Development Regional Status and Outlook
8.1 Global Chemical Distribution Revenue (USD Million) By Regions (2018-2022)
8.2 North America Chemical Distribution Revenue (USD Million) by Type, and Application (2018-2022)
8.2.1 North America Chemical Distribution Revenue (USD Million) by Country (2018-2022)
8.2.2 North America Chemical Distribution Revenue (USD Million) by Type (2018-2022)
8.2.3 North America Chemical Distribution Revenue (USD Million) by Applications (2018-2022)
8.3 Europe Chemical Distribution Revenue (USD Million), by Type, and Applications (USD Million) (2018-2022)
8.3.1 Europe Chemical Distribution Revenue (USD Million), by Country (2018-2022)
8.3.2 Europe Chemical Distribution Revenue (USD Million) by Type (2018-2022)
8.3.3 Europe Chemical Distribution Revenue (USD Million) by Applications (2018-2022)
8.4 Asia Pacific Chemical Distribution Revenue (USD Million), and Revenue (USD Million) by Type, and Applications (2018-2022)
8.4.1 Asia Pacific Chemical Distribution Revenue (USD Million) by Country (2018-2022)
8.4.2 Asia Pacific Chemical Distribution Revenue (USD Million) by Type (2018-2022)
8.4.3 Asia Pacific Chemical Distribution Revenue (USD Million) by Applications (2018-2022)
8.5 South America Chemical Distribution Revenue (USD Million), by Type, and Applications (2018-2022)
8.5.1 South America Chemical Distribution Revenue (USD Million), by Country (2018-2022)
8.5.2 South America Chemical Distribution Revenue (USD Million) by Type (2018-2022)
8.5.3 South America Chemical Distribution Revenue (USD Million) by Applications (2018-2022)
8.6 Middle East and Africa Chemical Distribution Revenue (USD Million), by Type, Technology, Application, Thickness (2018-2022)
8.6.1 Middle East and Africa Chemical Distribution Revenue (USD Million) by Country (2018-2022)
8.6.2 Middle East and Africa Chemical Distribution Revenue (USD Million) by Type (2018-2022)
8.6.3 Middle East and Africa Chemical Distribution Revenue (USD Million) by Applications (2018-2022)
9 Company Profiles
10 Global Chemical Distribution Market Revenue (USD Million), by Type, and Applications (2023-2030)
10.1 Global Chemical Distribution Revenue (USD Million) and Market Share (%) by Type (2023-2030)
10.1.1 Global Chemical Distribution Revenue (USD Million), and Market Share (%) by Type (2023-2030)
10.2 Global Chemical Distribution Revenue (USD Million) and Market Share (%) by Applications (2023-2030)
10.2.1 Global Chemical Distribution Revenue (USD Million), and Market Share (%) by Applications (2023-2030)
11 Global Chemical Distribution Development Regional Status and Outlook Forecast
11.1 Global Chemical Distribution Revenue (USD Million) By Regions (2023-2030)
11.2 North America Chemical Distribution Revenue (USD Million) by Type, and Applications (2023-2030)
11.2.1 North America Chemical Distribution Revenue (USD) Million by Country (2023-2030)
11.2.2 North America Chemical Distribution Revenue (USD Million), by Type (2023-2030)
11.2.3 North America Chemical Distribution Revenue (USD Million), Market Share (%) by Applications (2023-2030)
11.3 Europe Chemical Distribution Revenue (USD Million), by Type, and Applications (2023-2030)
11.3.1 Europe Chemical Distribution Revenue (USD Million), by Country (2023-2030)
11.3.2 Europe Chemical Distribution Revenue (USD Million), by Type (2023-2030)
11.3.3 Europe Chemical Distribution Revenue (USD Million), by Applications (2023-2030)
11.4 Asia Pacific Chemical Distribution Revenue (USD Million) by Type, and Applications (2023-2030)
11.4.1 Asia Pacific Chemical Distribution Revenue (USD Million), by Country (2023-2030)
11.4.2 Asia Pacific Chemical Distribution Revenue (USD Million), by Type (2023-2030)
11.4.3 Asia Pacific Chemical Distribution Revenue (USD Million), by Applications (2023-2030)
11.5 South America Chemical Distribution Revenue (USD Million), by Type, and Applications (2023-2030)
11.5.1 South America Chemical Distribution Revenue (USD Million), by Country (2023-2030)
11.5.2 South America Chemical Distribution Revenue (USD Million), by Type (2023-2030)
11.5.3 South America Chemical Distribution Revenue (USD Million), by Applications (2023-2030)
11.6 Middle East and Africa Chemical Distribution Revenue (USD Million), by Type, and Applications (2023-2030)
11.6.1 Middle East and Africa Chemical Distribution Revenue (USD Million), by region (2023-2030)
11.6.2 Middle East and Africa Chemical Distribution Revenue (USD Million), by Type (2023-2030)
11.6.3 Middle East and Africa Chemical Distribution Revenue (USD Million), by Applications (2023-2030)
12 Methodology and Data Sources
12.1 Methodology/Research Approach
12.1.1 Research Programs/Design
12.1.2 Market Size Estimation
12.1.3 Market Breakdown and Data Triangulation
12.2 Data Sources
12.2.1 Secondary Sources
12.2.2 Primary Sources
12.3 Disclaimer
List of Tables
Table 1 Market Segmentation Analysis
Table 2 Global Chemical Distribution Market Companies with Areas Served
Table 3 Products Offerings Global Chemical Distribution Market
Table 4 Low Growth Scenario Forecasts
Table 5 Reference Case Growth Scenario
Table 6 High Growth Case Scenario
Table 7 Global Chemical Distribution Revenue (USD Million) And CAGR (%) By Type (2018-2030)
Table 8 Global Chemical Distribution Revenue (USD Million) And CAGR (%) By Applications (2018-2030)
Table 9 Global Chemical Distribution Revenue (USD Million) And CAGR (%) By Regions (2018-2030)
Table 10 Global Chemical Distribution Revenue (USD Million) By Type (2018-2022)
Table 11 Global Chemical Distribution Revenue Market Share (%) By Type (2018-2022)
Table 12 Global Chemical Distribution Revenue (USD Million) By Applications (2018-2022)
Table 13 Global Chemical Distribution Revenue Market Share (%) By Applications (2018-2022)
Table 14 Global Chemical Distribution Market Revenue (USD Million) By Regions (2018-2022)
Table 15 Global Chemical Distribution Market Share (%) By Regions (2018-2022)
Table 16 North America Chemical Distribution Revenue (USD Million) By Country (2018-2022)
Table 17 North America Chemical Distribution Revenue (USD Million) By Type (2018-2022)
Table 18 North America Chemical Distribution Revenue (USD Million) By Applications (2018-2022)
Table 19 Europe Chemical Distribution Revenue (USD Million) By Country (2018-2022)
Table 20 Europe Chemical Distribution Revenue (USD Million) By Type (2018-2022)
Table 21 Europe Chemical Distribution Revenue (USD Million) By Applications (2018-2022)
Table 22 Asia Pacific Chemical Distribution Revenue (USD Million) By Country (2018-2022)
Table 23 Asia Pacific Chemical Distribution Revenue (USD Million) By Type (2018-2022)
Table 24 Asia Pacific Chemical Distribution Revenue (USD Million) By Applications (2018-2022)
Table 25 South America Chemical Distribution Revenue (USD Million) By Country (2018-2022)
Table 26 South America Chemical Distribution Revenue (USD Million) By Type (2018-2022)
Table 27 South America Chemical Distribution Revenue (USD Million) By Applications (2018-2022)
Table 28 Middle East and Africa Chemical Distribution Revenue (USD Million) By Region (2018-2022)
Table 29 Middle East and Africa Chemical Distribution Revenue (USD Million) By Type (2018-2022)
Table 30 Middle East and Africa Chemical Distribution Revenue (USD Million) By Applications (2018-2022)
Table 31 Financial Analysis
Table 32 Global Chemical Distribution Revenue (USD Million) By Type (2023-2030)
Table 33 Global Chemical Distribution Revenue Market Share (%) By Type (2023-2030)
Table 34 Global Chemical Distribution Revenue (USD Million) By Applications (2023-2030)
Table 35 Global Chemical Distribution Revenue Market Share (%) By Applications (2023-2030)
Table 36 Global Chemical Distribution Market Revenue (USD Million), And Revenue (USD Million) By Regions (2023-2030)
Table 37 North America Chemical Distribution Revenue (USD)By Country (2023-2030)
Table 38 North America Chemical Distribution Revenue (USD Million) By Type (2023-2030)
Table 39 North America Chemical Distribution Revenue (USD Million) By Applications (2023-2030)
Table 40 Europe Chemical Distribution Revenue (USD Million) By Country (2023-2030)
Table 41 Europe Chemical Distribution Revenue (USD Million) By Type (2023-2030)
Table 42 Europe Chemical Distribution Revenue (USD Million) By Applications (2023-2030)
Table 43 Asia Pacific Chemical Distribution Revenue (USD Million) By Country (2023-2030)
Table 44 Asia Pacific Chemical Distribution Revenue (USD Million) By Type (2023-2030)
Table 45 Asia Pacific Chemical Distribution Revenue (USD Million) By Applications (2023-2030)
Table 46 South America Chemical Distribution Revenue (USD Million) By Country (2023-2030)
Table 47 South America Chemical Distribution Revenue (USD Million) By Type (2023-2030)
Table 48 South America Chemical Distribution Revenue (USD Million) By Applications (2023-2030)
Table 49 Middle East and Africa Chemical Distribution Revenue (USD Million) By Region (2023-2030)
Table 50 Middle East and Africa Chemical Distribution Revenue (USD Million) By Region (2023-2030)
Table 51 Middle East and Africa Chemical Distribution Revenue (USD Million) By Type (2023-2030)
Table 52 Middle East and Africa Chemical Distribution Revenue (USD Million) By Applications (2023-2030)
Table 53 Research Programs/Design for This Report
Table 54 Key Data Information from Secondary Sources
Table 55 Key Data Information from Primary Sources
List of Figures
Figure 1 Market Scope
Figure 2 Porter’s Five Forces
Figure 3 Global Chemical Distribution Revenue (USD Million) By Type (2018-2022)
Figure 4 Global Chemical Distribution Revenue Market Share (%) By Type (2022)
Figure 5 Global Chemical Distribution Revenue (USD Million) By Applications (2018-2022)
Figure 6 Global Chemical Distribution Revenue Market Share (%) By Applications (2022)
Figure 7 Global Chemical Distribution Market Revenue (USD Million) By Regions (2018-2022)
Figure 8 Global Chemical Distribution Market Share (%) By Regions (2022)
Figure 9 North America Chemical Distribution Revenue (USD Million) By Country (2018-2022)
Figure 10 North America Chemical Distribution Revenue (USD Million) By Type (2018-2022)
Figure 11 North America Chemical Distribution Revenue (USD Million) By Applications (2018-2022)
Figure 12 Europe Chemical Distribution Revenue (USD Million) By Country (2018-2022)
Figure 13 Europe Chemical Distribution Revenue (USD Million) By Type (2018-2022)
Figure 14 Europe Chemical Distribution Revenue (USD Million) By Applications (2018-2022)
Figure 15 Asia Pacific Chemical Distribution Revenue (USD Million) By Country (2018-2022)
Figure 16 Asia Pacific Chemical Distribution Revenue (USD Million) By Type (2018-2022)
Figure 17 Asia Pacific Chemical Distribution Revenue (USD Million) By Applications (2018-2022)
Figure 18 South America Chemical Distribution Revenue (USD Million) By Country (2018-2022)
Figure 19 South America Chemical Distribution Revenue (USD Million) By Type (2018-2022)
Figure 20 South America Chemical Distribution Revenue (USD Million) By Applications (2018-2022)
Figure 21 Middle East and Africa Chemical Distribution Revenue (USD Million) By Region (2018-2022)
Figure 22 Middle East and Africa Chemical Distribution Revenue (USD Million) By Type (2018-2022)
Figure 23 Middle East and Africa Chemical Distribution Revenue (USD Million) By Applications (2018-2022)
Figure 24 Global Chemical Distribution Revenue (USD Million) By Type (2023-2030)
Figure 25 Global Chemical Distribution Revenue Market Share (%) By Type (2030)
Figure 26 Global Chemical Distribution Revenue (USD Million) By Applications (2023-2030)
Figure 27 Global Chemical Distribution Revenue Market Share (%) By Applications (2030)
Figure 28 Global Chemical Distribution Market Revenue (USD Million) By Regions (2023-2030)
Figure 29 North America Chemical Distribution Revenue (USD Million) By Country (2023-2030)
Figure 30 North America Chemical Distribution Revenue (USD Million) By Type (2023-2030)
Figure 31 North America Chemical Distribution Revenue (USD Million) By Applications (2023-2030)
Figure 32 Europe Chemical Distribution Revenue (USD Million) By Country (2023-2030)
Figure 33 Europe Chemical Distribution Revenue (USD Million) By Type (2023-2030)
Figure 34 Europe Chemical Distribution Revenue (USD Million) By Applications (2023-2030)
Figure 35 Asia Pacific Chemical Distribution Revenue (USD Million) By Country (2023-2030)
Figure 36 Asia Pacific Chemical Distribution Revenue (USD Million) By Type (2023-2030)
Figure 37 Asia Pacific Chemical Distribution Revenue (USD Million) By Applications (2023-2030)
Figure 38 South America Chemical Distribution Revenue (USD Million) By Country (2023-2030)
Figure 39 South America Chemical Distribution Revenue (USD Million) By Type (2023-2030)
Figure 40 South America Chemical Distribution Revenue (USD Million) By Applications (2023-2030)
Figure 41 Middle East and Africa Chemical Distribution Revenue (USD Million) By Region (2023-2030)
Figure 42 Middle East and Africa Chemical Distribution Revenue (USD Million) By Region (2023-2030)
Figure 43 Middle East and Africa Chemical Distribution Revenue (USD Million) By Type (2023-2030)
Figure 44 Middle East and Africa Chemical Distribution Revenue (USD Million) By Applications (2023-2030)
Figure 45 Bottom-Up and Top-Down Approaches for This Report
Figure 46 Data Triangulation
