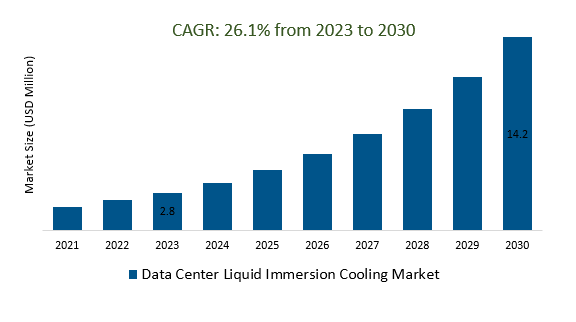
The global Data Center Liquid Immersion Cooling Market Size is estimated to be US$ 2.8 Billion in 2023. It is poised to register 26.1% growth over the forecast period from 2023 to 2030 to reach US $ 14.2 billion in 2030.
The market growth is driven by the data centers constantly increasing their computing power and density, which generates more heat. Liquid immersion cooling is becoming increasingly attractive as it efficiently dissipates heat, allowing data centers to handle higher workloads without overheating. Leading companies are focusing on Increased Data Center Density, Exponential Growth in Data, AI and HPC Expansion, Green Initiatives, Edge Computing Growth, Global Data Center Expansion, Increased Competition, Integration with Other Technologies, and others to boost market shares in the industry.
Market Overview
The Data Center Liquid Immersion Cooling Market is a rapidly growing sector within data center cooling, driven by the need for energy efficiency and the rising power density of modern IT equipment. This innovative technology immerses servers and hardware in specially designed cooling fluids, offering advantages such as high cooling efficiency, reduced energy consumption, and increased server density. It addresses environmental sustainability goals, supports high-performance computing, and finds applications in edge data centers. While facing challenges like initial investment and hardware compatibility, the market is poised for further growth, with key players offering specialized solutions to meet evolving data center cooling demands.
Market Dynamics
Market Trends- Companies are launching Server Hardware Advances to attract a consumer base
Data Center Liquid Immersion Cooling integrates seamlessly with various technologies, including edge computing, high-performance computing, 5G networks, renewable energy sources, data security solutions, IoT sensors, and monitoring, data center management software, heat recovery systems, containerized data centers, and hybrid cooling methods. This integration enhances data centers' efficiency, security, sustainability, and adaptability, making liquid immersion cooling a versatile and valuable solution for modern data center environments and applications.
Market Driver- Green Data Centers demand for efficient Data Center Liquid Immersion Cooling Market
Green Data Centers play a pivotal role in the Data Center Liquid Immersion Cooling Market by aligning environmental sustainability with cutting-edge cooling technology. Green Data Centers adopt eco-friendly practices, often incorporating renewable energy sources and energy-efficient cooling methods like liquid immersion cooling. This synergy reduces the carbon footprint of data centers, minimizes water usage, and maximizes energy efficiency, all of which are critical factors in addressing climate change and complying with stringent environmental regulations. As the demand for sustainable data centers continues to rise, the integration of liquid immersion cooling into green data center initiatives further accelerates the adoption of this innovative cooling solution.
Data Center Modernization is a catalyst for the growth of the Data Center Liquid Immersion Cooling Market. Aging data center infrastructure often struggles to cope with the demands of modern computing. Liquid immersion cooling serves as a cost-effective solution to revitalize and extend the operational life of these facilities. By retrofitting or integrating liquid immersion cooling systems into existing data centers, organizations can efficiently manage rising power densities, reduce energy consumption, and enhance cooling efficiency. This modernization drive not only addresses the performance challenges but also contributes to environmental sustainability, making liquid immersion cooling a crucial component of data center upgrades in the evolving digital landscape.
Market Share Analysis- Modular liquid cooling unit Data Center Liquid Immersion Cooling Market will register the fastest growth
The global Data Center Liquid Immersion Cooling Market is analyzed across Modular liquid cooling units, Door units, Integrated rack-based liquid cooling, and others. Of these, the Modular liquid cooling unit is poised to register the fastest growth. Modular liquid cooling units are a pivotal innovation in the Data Center Liquid Immersion Cooling Market, offering scalable, self-contained solutions for efficient cooling. These units, comprising immersion tanks, circulation systems, and heat exchange components, are easily integrated into existing or new data centers. Their modularity allows for flexibility and cost-effective adaptation to changing cooling needs, making them essential in addressing the demands of high-density computing and energy efficiency within the data center landscape.
Market Share Analysis- The chilled water-based cooling technique held a significant market share in 2023
The global Data Center Liquid Immersion Cooling Market is analyzed across a wide range of applications including Chilled water-based cooling techniques, Liquid immersion cooling techniques, and others. Of these, the Chilled water-based cooling technique held a significant market share in 2023. Chilled water-based cooling techniques are a significant advancement in the Data Center Liquid Immersion Cooling Market, combining the efficiency of immersion cooling with precise temperature control through closed-loop circulation of chilled water. This hybrid approach enhances cooling performance, reduces energy consumption, and maintains optimal operating temperatures, aligning with data centers' goals for energy efficiency and effective cooling.
Data Center Liquid Immersion Cooling Market Segmentation
By Type
By Application
By Size
By Region
- North America (United States, Canada, Mexico)
- Europe (Germany, France, United Kingdom, Spain, Italy, Others)
- Asia Pacific (China, India, Japan, South Korea, Australia, Others)
- Latin America (Brazil, Argentina, Others)
- Middle East and Africa (Saudi Arabia, UAE, Kuwait, Other Middle East, South Africa, Nigeria, Other Africa)
Data Center Liquid Immersion Cooling Market companies
- Midas Green Technologies LLC
- Horizon Computing solutions
- Emersion Electric Co.
- Allied Control Ltd.
- Rittal GmbH and Co.
- Green revolution cooling
- Silverback Migration Solutions
- Cool IT Systems Inc
- Asetek
* List not exhaustive
Data Center Liquid Immersion Cooling Market Outlook 2023
1 Market Overview
1.1 Introduction to the Data Center Liquid Immersion Cooling Market
1.2 Scope of the Study
1.3 Research Objective
1.3.1 Key Market Scope and Segments
1.3.2 Players Covered
1.3.3 Years Considered
2 Executive Summary
2.1 2023 Data Center Liquid Immersion Cooling Industry- Market Statistics
3 Market Dynamics
3.1 Market Drivers
3.2 Market Challenges
3.3 Market Opportunities
3.4 Market Trends
4 Market Factor Analysis
4.1 Porter’s Five Forces
4.2 Market Entropy
4.2.1 Global Data Center Liquid Immersion Cooling Market Companies with Area Served
4.2.2 Products Offerings Global Data Center Liquid Immersion Cooling Market
5 COVID-19 Impact Analysis and Outlook Scenarios
5.1.1 Covid-19 Impact Analysis
5.1.2 Post-COVID-19 Scenario- Low Growth Case
5.1.3 Post-COVID-19 Scenario- Reference Growth Case
5.1.4 Post-COVID-19 Scenario- Low Growth Case
6 Global Data Center Liquid Immersion Cooling Market Trends
6.1 Global Data Center Liquid Immersion Cooling Revenue (USD Million) and CAGR (%) by Type (2018-2030)
6.2 Global Data Center Liquid Immersion Cooling Revenue (USD Million) and CAGR (%) by Applications (2018-2030)
6.3 Global Data Center Liquid Immersion Cooling Revenue (USD Million) and CAGR (%) by Regions (2018-2030)
7 Global Data Center Liquid Immersion Cooling Market Revenue (USD Million) by Type, and Applications (2018-2022)
7.1 Global Data Center Liquid Immersion Cooling Revenue (USD Million) by Type (2018-2022)
7.1.1 Global Data Center Liquid Immersion Cooling Revenue (USD Million), Market Share (%) by Type (2018-2022)
7.2 Global Data Center Liquid Immersion Cooling Revenue (USD Million) by Applications (2018-2022)
7.2.1 Global Data Center Liquid Immersion Cooling Revenue (USD Million), Market Share (%) by Applications (2018-2022)
8 Global Data Center Liquid Immersion Cooling Development Regional Status and Outlook
8.1 Global Data Center Liquid Immersion Cooling Revenue (USD Million) By Regions (2018-2022)
8.2 North America Data Center Liquid Immersion Cooling Revenue (USD Million) by Type, and Application (2018-2022)
8.2.1 North America Data Center Liquid Immersion Cooling Revenue (USD Million) by Country (2018-2022)
8.2.2 North America Data Center Liquid Immersion Cooling Revenue (USD Million) by Type (2018-2022)
8.2.3 North America Data Center Liquid Immersion Cooling Revenue (USD Million) by Applications (2018-2022)
8.3 Europe Data Center Liquid Immersion Cooling Revenue (USD Million), by Type, and Applications (USD Million) (2018-2022)
8.3.1 Europe Data Center Liquid Immersion Cooling Revenue (USD Million), by Country (2018-2022)
8.3.2 Europe Data Center Liquid Immersion Cooling Revenue (USD Million) by Type (2018-2022)
8.3.3 Europe Data Center Liquid Immersion Cooling Revenue (USD Million) by Applications (2018-2022)
8.4 Asia Pacific Data Center Liquid Immersion Cooling Revenue (USD Million), and Revenue (USD Million) by Type, and Applications (2018-2022)
8.4.1 Asia Pacific Data Center Liquid Immersion Cooling Revenue (USD Million) by Country (2018-2022)
8.4.2 Asia Pacific Data Center Liquid Immersion Cooling Revenue (USD Million) by Type (2018-2022)
8.4.3 Asia Pacific Data Center Liquid Immersion Cooling Revenue (USD Million) by Applications (2018-2022)
8.5 South America Data Center Liquid Immersion Cooling Revenue (USD Million), by Type, and Applications (2018-2022)
8.5.1 South America Data Center Liquid Immersion Cooling Revenue (USD Million), by Country (2018-2022)
8.5.2 South America Data Center Liquid Immersion Cooling Revenue (USD Million) by Type (2018-2022)
8.5.3 South America Data Center Liquid Immersion Cooling Revenue (USD Million) by Applications (2018-2022)
8.6 Middle East and Africa Data Center Liquid Immersion Cooling Revenue (USD Million), by Type, Technology, Application, Thickness (2018-2022)
8.6.1 Middle East and Africa Data Center Liquid Immersion Cooling Revenue (USD Million) by Country (2018-2022)
8.6.2 Middle East and Africa Data Center Liquid Immersion Cooling Revenue (USD Million) by Type (2018-2022)
8.6.3 Middle East and Africa Data Center Liquid Immersion Cooling Revenue (USD Million) by Applications (2018-2022)
9 Company Profiles
10 Global Data Center Liquid Immersion Cooling Market Revenue (USD Million), by Type, and Applications (2023-2030)
10.1 Global Data Center Liquid Immersion Cooling Revenue (USD Million) and Market Share (%) by Type (2023-2030)
10.1.1 Global Data Center Liquid Immersion Cooling Revenue (USD Million), and Market Share (%) by Type (2023-2030)
10.2 Global Data Center Liquid Immersion Cooling Revenue (USD Million) and Market Share (%) by Applications (2023-2030)
10.2.1 Global Data Center Liquid Immersion Cooling Revenue (USD Million), and Market Share (%) by Applications (2023-2030)
11 Global Data Center Liquid Immersion Cooling Development Regional Status and Outlook Forecast
11.1 Global Data Center Liquid Immersion Cooling Revenue (USD Million) By Regions (2023-2030)
11.2 North America Data Center Liquid Immersion Cooling Revenue (USD Million) by Type, and Applications (2023-2030)
11.2.1 North America Data Center Liquid Immersion Cooling Revenue (USD) Million by Country (2023-2030)
11.2.2 North America Data Center Liquid Immersion Cooling Revenue (USD Million), by Type (2023-2030)
11.2.3 North America Data Center Liquid Immersion Cooling Revenue (USD Million), Market Share (%) by Applications (2023-2030)
11.3 Europe Data Center Liquid Immersion Cooling Revenue (USD Million), by Type, and Applications (2023-2030)
11.3.1 Europe Data Center Liquid Immersion Cooling Revenue (USD Million), by Country (2023-2030)
11.3.2 Europe Data Center Liquid Immersion Cooling Revenue (USD Million), by Type (2023-2030)
11.3.3 Europe Data Center Liquid Immersion Cooling Revenue (USD Million), by Applications (2023-2030)
11.4 Asia Pacific Data Center Liquid Immersion Cooling Revenue (USD Million) by Type, and Applications (2023-2030)
11.4.1 Asia Pacific Data Center Liquid Immersion Cooling Revenue (USD Million), by Country (2023-2030)
11.4.2 Asia Pacific Data Center Liquid Immersion Cooling Revenue (USD Million), by Type (2023-2030)
11.4.3 Asia Pacific Data Center Liquid Immersion Cooling Revenue (USD Million), by Applications (2023-2030)
11.5 South America Data Center Liquid Immersion Cooling Revenue (USD Million), by Type, and Applications (2023-2030)
11.5.1 South America Data Center Liquid Immersion Cooling Revenue (USD Million), by Country (2023-2030)
11.5.2 South America Data Center Liquid Immersion Cooling Revenue (USD Million), by Type (2023-2030)
11.5.3 South America Data Center Liquid Immersion Cooling Revenue (USD Million), by Applications (2023-2030)
11.6 Middle East and Africa Data Center Liquid Immersion Cooling Revenue (USD Million), by Type, and Applications (2023-2030)
11.6.1 Middle East and Africa Data Center Liquid Immersion Cooling Revenue (USD Million), by Region (2023-2030)
11.6.2 Middle East and Africa Data Center Liquid Immersion Cooling Revenue (USD Million), by Type (2023-2030)
11.6.3 Middle East and Africa Data Center Liquid Immersion Cooling Revenue (USD Million), by Applications (2023-2030)
12 Methodology and Data Sources
12.1 Methodology/Research Approach
12.1.1 Research Programs/Design
12.1.2 Market Size Estimation
12.1.3 Market Breakdown and Data Triangulation
12.2 Data Sources
12.2.1 Secondary Sources
12.2.2 Primary Sources
12.3 Disclaimer
List of Tables
Table 1 Market Segmentation Analysis
Table 2 Global Data Center Liquid Immersion Cooling Market Companies with Areas Served
Table 3 Products Offerings Global Data Center Liquid Immersion Cooling Market
Table 4 Low Growth Scenario Forecasts
Table 5 Reference Case Growth Scenario
Table 6 High Growth Case Scenario
Table 7 Global Data Center Liquid Immersion Cooling Revenue (USD Million) And CAGR (%) By Type (2018-2030)
Table 8 Global Data Center Liquid Immersion Cooling Revenue (USD Million) And CAGR (%) By Applications (2018-2030)
Table 9 Global Data Center Liquid Immersion Cooling Revenue (USD Million) And CAGR (%) By Regions (2018-2030)
Table 10 Global Data Center Liquid Immersion Cooling Revenue (USD Million) By Type (2018-2022)
Table 11 Global Data Center Liquid Immersion Cooling Revenue Market Share (%) By Type (2018-2022)
Table 12 Global Data Center Liquid Immersion Cooling Revenue (USD Million) By Applications (2018-2022)
Table 13 Global Data Center Liquid Immersion Cooling Revenue Market Share (%) By Applications (2018-2022)
Table 14 Global Data Center Liquid Immersion Cooling Market Revenue (USD Million) By Regions (2018-2022)
Table 15 Global Data Center Liquid Immersion Cooling Market Share (%) By Regions (2018-2022)
Table 16 North America Data Center Liquid Immersion Cooling Revenue (USD Million) By Country (2018-2022)
Table 17 North America Data Center Liquid Immersion Cooling Revenue (USD Million) By Type (2018-2022)
Table 18 North America Data Center Liquid Immersion Cooling Revenue (USD Million) By Applications (2018-2022)
Table 19 Europe Data Center Liquid Immersion Cooling Revenue (USD Million) By Country (2018-2022)
Table 20 Europe Data Center Liquid Immersion Cooling Revenue (USD Million) By Type (2018-2022)
Table 21 Europe Data Center Liquid Immersion Cooling Revenue (USD Million) By Applications (2018-2022)
Table 22 Asia Pacific Data Center Liquid Immersion Cooling Revenue (USD Million) By Country (2018-2022)
Table 23 Asia Pacific Data Center Liquid Immersion Cooling Revenue (USD Million) By Type (2018-2022)
Table 24 Asia Pacific Data Center Liquid Immersion Cooling Revenue (USD Million) By Applications (2018-2022)
Table 25 South America Data Center Liquid Immersion Cooling Revenue (USD Million) By Country (2018-2022)
Table 26 South America Data Center Liquid Immersion Cooling Revenue (USD Million) By Type (2018-2022)
Table 27 South America Data Center Liquid Immersion Cooling Revenue (USD Million) By Applications (2018-2022)
Table 28 Middle East and Africa Data Center Liquid Immersion Cooling Revenue (USD Million) By Region (2018-2022)
Table 29 Middle East and Africa Data Center Liquid Immersion Cooling Revenue (USD Million) By Type (2018-2022)
Table 30 Middle East and Africa Data Center Liquid Immersion Cooling Revenue (USD Million) By Applications (2018-2022)
Table 31 Financial Analysis
Table 32 Global Data Center Liquid Immersion Cooling Revenue (USD Million) By Type (2023-2030)
Table 33 Global Data Center Liquid Immersion Cooling Revenue Market Share (%) By Type (2023-2030)
Table 34 Global Data Center Liquid Immersion Cooling Revenue (USD Million) By Applications (2023-2030)
Table 35 Global Data Center Liquid Immersion Cooling Revenue Market Share (%) By Applications (2023-2030)
Table 36 Global Data Center Liquid Immersion Cooling Market Revenue (USD Million), And Revenue (USD Million) By Regions (2023-2030)
Table 37 North America Data Center Liquid Immersion Cooling Revenue (USD)By Country (2023-2030)
Table 38 North America Data Center Liquid Immersion Cooling Revenue (USD Million) By Type (2023-2030)
Table 39 North America Data Center Liquid Immersion Cooling Revenue (USD Million) By Applications (2023-2030)
Table 40 Europe Data Center Liquid Immersion Cooling Revenue (USD Million) By Country (2023-2030)
Table 41 Europe Data Center Liquid Immersion Cooling Revenue (USD Million) By Type (2023-2030)
Table 42 Europe Data Center Liquid Immersion Cooling Revenue (USD Million) By Applications (2023-2030)
Table 43 Asia Pacific Data Center Liquid Immersion Cooling Revenue (USD Million) By Country (2023-2030)
Table 44 Asia Pacific Data Center Liquid Immersion Cooling Revenue (USD Million) By Type (2023-2030)
Table 45 Asia Pacific Data Center Liquid Immersion Cooling Revenue (USD Million) By Applications (2023-2030)
Table 46 South America Data Center Liquid Immersion Cooling Revenue (USD Million) By Country (2023-2030)
Table 47 South America Data Center Liquid Immersion Cooling Revenue (USD Million) By Type (2023-2030)
Table 48 South America Data Center Liquid Immersion Cooling Revenue (USD Million) By Applications (2023-2030)
Table 49 Middle East and Africa Data Center Liquid Immersion Cooling Revenue (USD Million) By Region (2023-2030)
Table 50 Middle East and Africa Data Center Liquid Immersion Cooling Revenue (USD Million) By Region (2023-2030)
Table 51 Middle East and Africa Data Center Liquid Immersion Cooling Revenue (USD Million) By Type (2023-2030)
Table 52 Middle East and Africa Data Center Liquid Immersion Cooling Revenue (USD Million) By Applications (2023-2030)
Table 53 Research Programs/Design for This Report
Table 54 Key Data Information from Secondary Sources
Table 55 Key Data Information from Primary Sources
List of Figures
Figure 1 Market Scope
Figure 2 Porter’s Five Forces
Figure 3 Global Data Center Liquid Immersion Cooling Revenue (USD Million) By Type (2018-2022)
Figure 4 Global Data Center Liquid Immersion Cooling Revenue Market Share (%) By Type (2022)
Figure 5 Global Data Center Liquid Immersion Cooling Revenue (USD Million) By Applications (2018-2022)
Figure 6 Global Data Center Liquid Immersion Cooling Revenue Market Share (%) By Applications (2022)
Figure 7 Global Data Center Liquid Immersion Cooling Market Revenue (USD Million) By Regions (2018-2022)
Figure 8 Global Data Center Liquid Immersion Cooling Market Share (%) By Regions (2022)
Figure 9 North America Data Center Liquid Immersion Cooling Revenue (USD Million) By Country (2018-2022)
Figure 10 North America Data Center Liquid Immersion Cooling Revenue (USD Million) By Type (2018-2022)
Figure 11 North America Data Center Liquid Immersion Cooling Revenue (USD Million) By Applications (2018-2022)
Figure 12 Europe Data Center Liquid Immersion Cooling Revenue (USD Million) By Country (2018-2022)
Figure 13 Europe Data Center Liquid Immersion Cooling Revenue (USD Million) By Type (2018-2022)
Figure 14 Europe Data Center Liquid Immersion Cooling Revenue (USD Million) By Applications (2018-2022)
Figure 15 Asia Pacific Data Center Liquid Immersion Cooling Revenue (USD Million) By Country (2018-2022)
Figure 16 Asia Pacific Data Center Liquid Immersion Cooling Revenue (USD Million) By Type (2018-2022)
Figure 17 Asia Pacific Data Center Liquid Immersion Cooling Revenue (USD Million) By Applications (2018-2022)
Figure 18 South America Data Center Liquid Immersion Cooling Revenue (USD Million) By Country (2018-2022)
Figure 19 South America Data Center Liquid Immersion Cooling Revenue (USD Million) By Type (2018-2022)
Figure 20 South America Data Center Liquid Immersion Cooling Revenue (USD Million) By Applications (2018-2022)
Figure 21 Middle East and Africa Data Center Liquid Immersion Cooling Revenue (USD Million) By Region (2018-2022)
Figure 22 Middle East and Africa Data Center Liquid Immersion Cooling Revenue (USD Million) By Type (2018-2022)
Figure 23 Middle East and Africa Data Center Liquid Immersion Cooling Revenue (USD Million) By Applications (2018-2022)
Figure 24 Global Data Center Liquid Immersion Cooling Revenue (USD Million) By Type (2023-2030)
Figure 25 Global Data Center Liquid Immersion Cooling Revenue Market Share (%) By Type (2030)
Figure 26 Global Data Center Liquid Immersion Cooling Revenue (USD Million) By Applications (2023-2030)
Figure 27 Global Data Center Liquid Immersion Cooling Revenue Market Share (%) By Applications (2030)
Figure 28 Global Data Center Liquid Immersion Cooling Market Revenue (USD Million) By Regions (2023-2030)
Figure 29 North America Data Center Liquid Immersion Cooling Revenue (USD Million) By Country (2023-2030)
Figure 30 North America Data Center Liquid Immersion Cooling Revenue (USD Million) By Type (2023-2030)
Figure 31 North America Data Center Liquid Immersion Cooling Revenue (USD Million) By Applications (2023-2030)
Figure 32 Europe Data Center Liquid Immersion Cooling Revenue (USD Million) By Country (2023-2030)
Figure 33 Europe Data Center Liquid Immersion Cooling Revenue (USD Million) By Type (2023-2030)
Figure 34 Europe Data Center Liquid Immersion Cooling Revenue (USD Million) By Applications (2023-2030)
Figure 35 Asia Pacific Data Center Liquid Immersion Cooling Revenue (USD Million) By Country (2023-2030)
Figure 36 Asia Pacific Data Center Liquid Immersion Cooling Revenue (USD Million) By Type (2023-2030)
Figure 37 Asia Pacific Data Center Liquid Immersion Cooling Revenue (USD Million) By Applications (2023-2030)
Figure 38 South America Data Center Liquid Immersion Cooling Revenue (USD Million) By Country (2023-2030)
Figure 39 South America Data Center Liquid Immersion Cooling Revenue (USD Million) By Type (2023-2030)
Figure 40 South America Data Center Liquid Immersion Cooling Revenue (USD Million) By Applications (2023-2030)
Figure 41 Middle East and Africa Data Center Liquid Immersion Cooling Revenue (USD Million) By Region (2023-2030)
Figure 42 Middle East and Africa Data Center Liquid Immersion Cooling Revenue (USD Million) By Region (2023-2030)
Figure 43 Middle East and Africa Data Center Liquid Immersion Cooling Revenue (USD Million) By Type (2023-2030)
Figure 44 Middle East and Africa Data Center Liquid Immersion Cooling Revenue (USD Million) By Applications (2023-2030)
Figure 45 Bottom-Up and Top-Down Approaches For This Report
Figure 46 Data Triangulation
