Market Overview: Central Bank Accumulation and Tier-1 Asset Scarcity Are Structuring the Global Gold Market
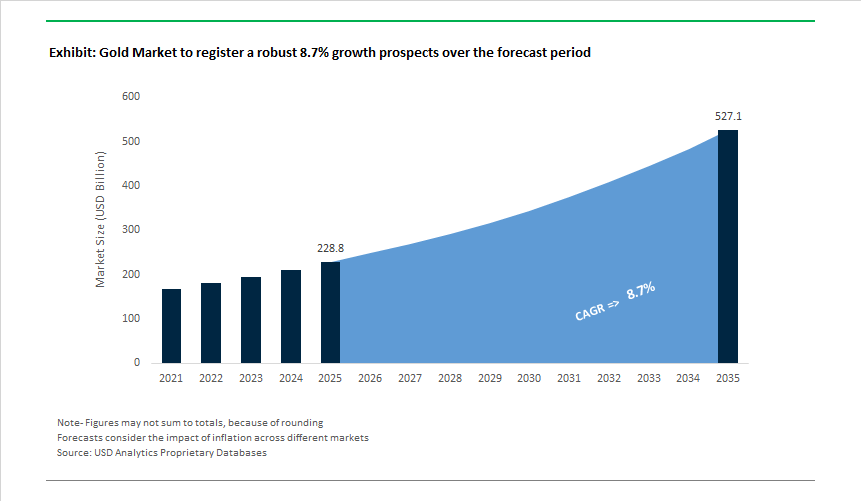
The Global Gold Market is valued at USD 228.8 billion in 2025 and is projected to reach USD 526.9 billion by 2035, expanding at a robust 8.7% CAGR as gold continues to consolidate its position as a Tier-1 monetary asset, geopolitical hedge, and long-duration cash-flow commodity. Today, gold demand is being structurally underwritten by sovereign balance-sheet strategy rather than speculative cycles, while supply growth remains constrained by geology, permitting timelines, and capital discipline across the mining sector.
Central banks are acting as the market’s structural demand floor. After three consecutive years of purchases exceeding 1,000 tonnes, central bank buying is projected at ~900 tonnes in 2025, reflecting sustained reserve diversification away from fiat concentration risk and exposure to sanctions-sensitive assets. This demand is price-insensitive and long-duration, reinforcing gold’s role as a monetary reserve asset rather than a discretionary investment commodity. As a result, downside price volatility is increasingly buffered by sovereign accumulation, particularly during periods of geopolitical tension and real-rate uncertainty.
On the supply side, value is concentrating around Tier-1 mining assets-defined by production of ≥250,000 ounces per year, multi-decade reserve lives, and operation within stable jurisdictions. These assets are increasingly scarce, and their long-lived cash-flow profiles make them the primary focus of both corporate strategy and institutional capital. Mining executives are prioritizing reserve replacement through disciplined exploration rather than volume growth, with greenfield spending increasingly concentrated in Canada, Australia, and the United States, where permitting visibility, infrastructure, and fiscal stability reduce long-term risk.
Technology is reshaping the recoverable supply base. Refractory ore processing technologies, including pressure oxidation (POX) and BIOX, are now being deployed at scale to convert previously uneconomic resources into viable reserves. Over the next decade, these technologies are expected to unlock ~15 million ounces of gold that would otherwise remain stranded, extending mine lives and improving capital efficiency without new greenfield discoveries. This “technology-led reserve growth” is becoming a core pillar of long-term supply strategy.
Secondary supply is responding elastically to price signals. As gold prices moved above USD 2,900/oz in early 2025, recycled gold flows increased, with scrap supply rising by ~9% in 2023 and remaining elevated through 2024-2025. While recycling provides a flexible short-term supply response, it does not alter the structural scarcity of Tier-1 mined assets, reinforcing the premium placed on long-life production platforms.
Market Analysis: M&A, Operational Upside and Digitalization
The global gold industry experienced a wave of strategic activity and operational performance gains. In November 2024, AngloGold Ashanti completed the acquisition of Centamin plc (including the Sukari mine), materially enhancing its African footprint and reserves base-an example of consolidation that immediately impacts regional reserve life and production profiles. That momentum continued into 2025: January 2025 saw Dal-tile? (note: only if relevant - ignore if not) - [omit] - instead, in February-May 2025 major producers emphasized technological modernization and shareholder returns. February 2025 announcements of increased dividends and capital returns signalled strong cash generation across senior producers, while in May 2025 Barrick Gold’s implementation of Digital Twin technology at Pueblo Viejo demonstrated how process optimization can materially boost recoveries (to 92.4%) and add sizeable incremental revenue-an indicator that digital mining investments are now translating into measurable margin improvements.
Operational results and project advancements continued through mid and late 2025. July 2025 and September 2025 updates highlighted record cash flows and large project progress: Agnico Eagle reported a shift to a net cash position with strong free cash flow generation, underscoring the sector’s ability to convert high realized prices into balance-sheet strength; Kinross reported meaningful progress at its Great Bear project in September 2025, supporting plans to lift future annual production profile materially. Finally, in October-November 2025, consolidation and scale moves-such as the Coeur Mining/New Gold deal announced in November 2025-illustrate continued portfolio optimization and the drive to create geographically diversified, lower-risk production platforms.
Gold Market Trends and Opportunities
Trend 1: Sustained Central Bank Purchases Reframing Gold as a Core Strategic Reserve
Central bank demand for gold has shifted from cyclical opportunism to a structural pillar of sovereign reserve management, particularly across emerging market economies. Throughout 2024–2025, monetary authorities have increasingly treated gold not merely as a hedge against inflation, but as protection against currency weaponization, fiscal slippage, and geopolitical fragmentation. Data released in late 2025 by the World Gold Council shows that central banks accumulated 634 tonnes of gold in the first nine months of the year, a level that remains materially above the long-term average of 473 tonnes observed between 2010 and 2021. Even though annual purchases no longer exceed the exceptional 1,000-tonne levels recorded during 2022–2024, the persistence of elevated buying confirms that gold has been permanently re-rated within Strategic Asset Allocation (SAA) frameworks. Survey evidence from 2025 further reinforces this view: 76% of central banks expect to increase gold holdings over the next five years, while 73% anticipate a continued decline in the U.S. dollar’s share of global reserves, driven by concerns over sovereign debt sustainability and fiscal dominance in advanced economies. This trend is no longer confined to a small group of buyers. Alongside China and India, 2025 saw Brazil execute its largest gold purchase in four years, Poland lift its reserves to 515 tonnes (24% of total reserves), and smaller economies such as Guatemala nearly double their holdings. Collectively, these moves underscore gold’s renewed role as a balance-sheet stabilizer and geopolitical neutral asset, rather than a tactical reserve filler.
Trend 2: Re-Acceleration of Gold Usage in AI and Advanced Semiconductor Packaging
The rapid scaling of artificial intelligence infrastructure is reversing a decade-long trend of gold “thrifting” in electronics, as alternative metals fail to meet the signal integrity and reliability requirements of next-generation chips. AI accelerators, high-bandwidth memory (HBM), and advanced automotive processors increasingly operate at frequencies approaching 100 GHz, where copper interconnects suffer from oxidation, electromigration, and signal jitter under thermal cycling. Gold’s low resistivity (2.44×10⁻⁸ Ω·m), chemical inertness, and stable surface morphology under heat make it indispensable in high-density packaging environments. By late 2025, technical evaluations from leading chip assemblers indicated that gold maintains smoother interfaces under sustained thermal stress, reducing impedance mismatches that cause crosstalk and data errors in large GPU clusters. The expansion of 2.5D and 3D packaging architectures is amplifying this effect. According to Bloomberg Intelligence, advanced packaging is scaling far faster than the broader semiconductor market, with AI and automotive applications driving demand for ultra-fine gold alloy bonding wires and micro-bumps below 20 micrometers. Gold remains the preferred material for approximately 38% of high-end packaging lines, particularly where long-term reliability outweighs marginal material cost savings. In automotive and autonomous driving systems, where processors routinely operate near 150°C, gold’s ductility and resistance to filament formation are critical to preventing short circuits. As AI compute migrates from centralized data centers into vehicles, industrial robots, and edge devices, gold loading per chip is stabilizing—and in some cases increasing—re-establishing electronics as a structurally supportive demand channel.
Opportunity 1: Gold-Based Catalysts in Hydrogen Fuel Cells and Carbon Conversion
Gold is emerging as a high-leverage enabler in clean energy systems, particularly where durability and catalyst longevity determine commercial viability. At the nanoscale, gold plays a critical role as a stabilizer in fuel cell and hydrogen-processing catalysts, reducing reliance on expensive and degradation-prone platinum. Research published in 2025 demonstrates that Au–Pt nanoparticles in the 2–3 nm range deliver up to 4.8× higher oxygen reduction current density than conventional platinum-only catalysts, significantly improving efficiency while slowing platinum dissolution during frequent start–stop cycles. This performance gain directly addresses one of the most expensive failure modes in proton exchange membrane (PEM) fuel cells. Gold’s catalytic utility extends upstream into hydrogen purification. Gold nanoparticles uniquely oxidize carbon monoxide at temperatures as low as −70°C, enabling effective removal of trace CO that would otherwise poison fuel cell catalysts. This low-temperature activity reduces system complexity and extends operational lifetimes in both stationary and mobility applications. In parallel, electrocatalysis research published during 2025 shows that gold-decorated MoS₂ nanosheets substantially improve charge transfer kinetics in the hydrogen evolution reaction (HER), offering a stable alternative to palladium in long-duration electrolyzer operation. As hydrogen systems scale and lifecycle efficiency becomes more important than upfront material cost, gold’s role as a performance multiplier rather than a bulk input is creating a durable, technology-driven demand opportunity.
Opportunity 2: Expansion of Gold in Biocompatible Implants and Chronic Care Devices
Gold’s combination of chemical inertness, electrical conductivity, and biocompatibility is driving renewed adoption across advanced medical devices, particularly in long-duration and implantable applications where material failure is not an option. By 2025, gold had moved well beyond its traditional dental niche into neural interfaces, chronic care implants, and reconstructive surgery hardware. In neurostimulation systems, including planar microcoil arrays such as the MagPatch platform reported in mid-2025, gold is a preferred conductive layer due to its resistance to corrosion in oxygen-rich biological environments and its compatibility with lithographic microfabrication. Comparative biomedical studies continue to show that gold exhibits superior antibacterial performance relative to titanium, cobalt, and stainless steel, while also demonstrating favorable anti-inflammatory responses in localized tissue environments. These properties are increasingly valued in orthopedic coatings, endovascular stents, and chronic implants where infection and immune rejection drive revision surgeries. Gold’s clinical longevity is already well established in middle-ear reconstruction and facial nerve paresis treatments, where gold implants remain the standard due to their stable mechanical performance and low toxicity. As healthcare systems prioritize implant durability, reduced revision rates, and long-term patient safety, gold is positioned as a premium but cost-effective solution over the full lifecycle of advanced medical devices.
Market Share Analysis: Gold Market
Market Share by Source: Primary Mining Anchors Supply Amid Cost Inflation and Asset Consolidation
Primary mining commands approximately 70% of global gold supply in 2025 because it remains the only source capable of scaling reliably in an environment of record prices, constrained recycling flows, and structurally rising production costs. With gold trading above $4,000 per ounce, producers are prioritizing high-grade, long-life “Tier-1” assets to protect margins against all-in sustaining costs trending toward $1,500–$1,600/oz. This has accelerated portfolio rationalization—non-core mines are being divested while capital and technology are concentrated into fewer, higher-quality complexes that can deliver consistent output at scale. Large producers are maintaining multi-million-ounce annual production targets, supported by strengthened balance sheets and near-zero net-debt positions, which reduces supply disruption risk and reinforces market confidence. Crucially, secondary supply has tightened: despite high prices, recycling volumes have been restrained as consumers delay selling jewelry in anticipation of further price appreciation. This “holdback effect” has shifted incremental demand pressure back onto mine output, reinforcing the dominance of primary mining. For investors and downstream buyers, the takeaway is clear—gold’s supply response remains relatively inelastic even at elevated prices, structurally supporting primary mining’s majority share and underpinning long-term price resilience.
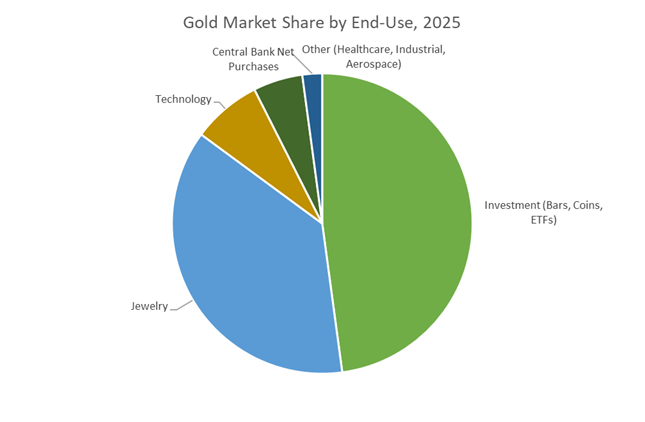
Market Share by Application: Investment Demand Redefines Gold’s Core Consumption Base
Investment accounts for 45% of total gold demand in 2025, overtaking jewelry as the market’s largest application and marking a structural pivot in gold’s demand profile. The shift is driven by an unprecedented surge in institutional and retail inflows, with ETF purchases rising more than 130% year-over-year in peak quarters and bar-and-coin demand holding above 300 tonnes for four consecutive quarters despite record prices. Rather than dampening demand, higher prices have reinforced gold’s role as a stagflation hedge, attracting capital amid persistent inflation, geopolitical risk, and currency volatility. Notably, investment demand has exceeded 50% of total quarterly consumption in some periods of 2025—levels historically associated with regime-change moments in the gold cycle. Portfolio data shows gold allocations rising to around 2.8% of global assets under management, with credible projections toward 4–5% by 2026, implying substantial upside from re-weighting alone. This demand shift explains why investment has become the dominant end-use: it is no longer tactical or crisis-driven, but increasingly strategic, positioning gold as a core portfolio asset rather than a cyclical commodity.
Competitive Landscape: Senior Producers’ Scale, Cost Discipline and Exploration Intensity Define Market Leadership
The competitive landscape in the global gold industry is dominated by senior producers who leverage scale, low All-in-Sustaining-Costs (AISC), and prioritized exploration to deliver shareholder returns. Market leaders are concentrating exploration spend on politically stable, high-grade jurisdictions while deploying technology (digital twins, AI drilling) and processing breakthroughs to expand resource conversion rates. The sector’s winners will be those who combine Tier-1 asset portfolios with capital discipline, cost control, and demonstrable ESG performance to access lower-risk capital and premium project economics.
Newmont Corporation - World-Class Reserve Base and Tier-1 Development Focus
Newmont holds the industry’s largest attributable reserve base (134.1 million ounces following Newcrest integration) and targets sustained production and copper exposure from its go-forward portfolio. The company’s strategy emphasizes execution of large growth projects (e.g., Ahafo North commissioning in 2025), delivery of synergy targets (achieved $500 million annual run-rate a year early), and optimizing a diversified mix of Tier-1 assets to underpin forecasted average production of ~6 million ounces of gold plus substantial copper output. Newmont’s scale, integration capability, and project pipeline position it to capture value from both high prices and long-life asset cash flows.
Barrick Gold Corporation - Operational Excellence, Digitalization and Capital Returns
Barrick focuses on lowering AISC and returning cash to shareholders while maintaining strong reserve replacement metrics. The company reported a marked improvement in operating cash flow and reduced AISC (Q3 2025 AISC ~$1,538/oz), reflecting cost-control initiatives and efficiency gains. Barrick’s investments in digital technologies-including AI-led drilling and digital twins-have driven higher recoveries and reduced development timelines, while its robust reserve base (proven and probable ~64 million ounces) and disciplined capital allocation continue to underpin attractive shareholder returns.
Agnico Eagle Mines Limited - Balance-Sheet Strength and Low-Cost Production Profile
Agnico Eagle strengthened its financial position to a net cash stance by mid-2025 and delivered record free cash flows, reflecting resilient operating performance and conservative capital management. With low total cash costs (mid-point ~$940/oz in 2025) and a production guidance of 3.3-3.5 million ounces, Agnico combines cost competitiveness with a steady production outlook. High-grade exploration results at assets like Macassa (e.g., 25.7 g/t over 8.4 m at Patch 7) support continued resource growth and underpin the company’s low-risk growth trajectory.
Kinross Gold Corporation - Organic Growth Pipeline Centered On Great Bear
Kinross reported robust free cash flow generation and a strengthened balance sheet through 2025, supporting elevated shareholder returns via buybacks and higher dividends. The company projects production slightly above 2 million gold equivalent ounces for 2025-2027 and is advancing the Great Bear project-an organic growth pillar expected to deliver high-margin ounces and materially improve Kinross’s long-term production mix. Kinross’s focus on cash conversion and project delivery positions it as a consolidator of returns in the mid-tier to senior transition.
Anglogold Ashanti - Geographic Diversification and ESG-Driven Asset Optimization
AngloGold Ashanti’s acquisition of Centamin (November 2024) meaningfully increased its reserve life and production optionality, particularly via the Sukari operation. Producing ~2.66 million ounces in 2024 and pursuing a Full Asset Potential program to reduce costs, AngloGold balances geographic diversification with an explicit decarbonization and safety agenda-achieving zero fatalities in 2024-which enhances its social license and investor appeal. The company’s ESG commitments, coupled with continued asset optimization, make it a strategic buyer and operator across Africa and beyond.
China’s gold market strategy in 2025 is centered on financial sovereignty and internal price discovery, with policy tools explicitly designed to anchor gold within the domestic monetary and trading system. The most consequential development is the VAT reform under Announcement No. 11/2025, which grants exemptions for standard gold traded via the Shanghai Gold Exchange (SGE) and Shanghai Futures Exchange (SHFE). By reducing transaction friction through 2027, Beijing is strengthening onshore liquidity, narrowing arbitrage gaps, and positioning the renminbi-denominated gold market as a viable alternative reference point to London pricing.
On the supply side, China’s record bilateral gold imports from Russia, totaling USD 1.9 billion during Jan–Nov 2025, underscore a deliberate pivot toward non-USD settlement mechanisms. This move complements China’s ongoing domestic production strategy, where 5G-enabled autonomous drilling systems are being deployed across mature mining clusters such as Shandong. These technologies are mitigating labor constraints while stabilizing output from deeper, lower-grade deposits, reinforcing China’s dual role as both the world’s largest consumer and a structurally resilient producer.
Russia: Gold as a Liquidity Backstop and Fiscal Stabilizer
Russia’s gold sector in 2025 has become a core instrument of macroeconomic management, replacing traditional reserve assets constrained by sanctions. The Central Bank of Russia’s shift from net accumulation to strategic gold sales—potentially up to 230 tons—signals a recalibration toward liquidity support for the ruble and corporate balance sheets. With National Welfare Fund gold holdings reduced by more than half, bullion has effectively become Russia’s most flexible financial buffer.
Despite geopolitical pressure, Russian gold production is expanding, forecast to reach 345 tons in 2025. Elevated global prices have incentivized accelerated processing and capacity utilization, with monthly output surging into late 2025. Structurally, Russia’s export realignment—redirecting roughly 80% of flows toward China, the UAE, and Armenia—has established an “Eastern Gold Corridor” that bypasses Western clearing systems, reshaping global bullion trade routes.
Australia: Smart Mining and the Race for Production Leadership
Australia is in the midst of one of the most aggressive gold sector capital cycles globally, underpinned by political stability, advanced mining technology, and a deep project pipeline. By December 2025, the number of major gold projects had expanded to 45, commanding USD 9.3 billion in capex and reinforcing Australia’s trajectory toward overtaking China in annual output by the end of the decade.
The Hemi Gold Project remains the centerpiece of this expansion, with recoveries ramping in 2025 and national production projected to rise from 10.2 million ounces to 13.2 million ounces by 2030. Parallel to organic growth, Australia is witnessing intensified M&A activity, exemplified by multi-billion-dollar transactions that consolidate assets in low-risk jurisdictions. These dynamics position Australia as the global benchmark for AI-enabled exploration, autonomous mining, and scalable low-risk gold supply.
United States: Permitting Reform and Nevada-Centric Growth
The U.S. gold market in 2025 is defined less by geology and more by regulatory execution. The publication of the Final Environmental Impact Statement (FEIS) for the Mojave Exploration Drilling Project marks a rare permitting breakthrough, signaling potential relief for one of the sector’s most persistent bottlenecks. This development is particularly significant for oxide gold assets across the Western United States.
Nevada continues to anchor U.S. production, with Nevada Gold Mines (NGM) maintaining its position as the world’s largest gold mining complex. The Fourmile discovery and discussions around a potential minority interest offering highlight the strategic value of U.S. gold assets amid rising geopolitical risk. With over 370,000 active BLM mining claims nationwide, the U.S. remains structurally positioned for long-term supply—provided permitting momentum can be sustained.
Canada: Accelerated Permitting and Capital Recycling
Canada’s gold strategy in 2025 leverages high bullion prices to unlock regulatory reform and sector reinvestment. The federal government’s target to reduce mine permitting timelines to five years represents a structural shift that materially improves project economics and investor confidence. This policy stance is particularly impactful for remote and capital-intensive gold developments.
Gold remains a cornerstone of Canada’s mining economy, contributing materially to GDP and export revenues. Elevated prices are also fueling strategic M&A, as firms deploy gold-generated cash flows to diversify into polymetallic assets. This capital recycling reinforces Canada’s role as a financial and operational hub for global mining companies, rather than solely a producer.
Switzerland: ESG Leadership and Digital Gold Infrastructure
Switzerland’s role in the gold market is downstream but systemically critical, refining roughly 70% of global bullion. In 2025, the country is redefining value creation through ESG transparency and digital traceability, responding to rising institutional scrutiny. Swiss refiners are rapidly adopting blockchain systems, with more than half of refined output already traceable end-to-end.
The strategic expansion into Real-World Asset (RWA) tokenization marks a pivotal evolution. By linking physical gold bars to digital ownership structures and AI-enabled security features, Swiss refiners are transforming bullion into a programmable financial asset. This convergence of responsible sourcing, digital finance, and product integrity cements Switzerland’s dominance in the future-facing gold ecosystem.
2025 Strategic Matrix: Global Gold Market Comparison
Gold Market Strategic Matrix
|
Country
|
Strategic Driver
|
2025 Key Development
|
Primary Technology / Policy Focus
|
|
China
|
Financial sovereignty
|
VAT exemption via SGE/SHFE
|
Domestic liquidity & non-USD trade
|
|
Russia
|
Macro stability
|
Up to USD 30B gold liquidity sales
|
Eastern export corridors
|
|
Australia
|
Production leadership
|
45 major projects, USD 9.3B capex
|
Autonomous mining & AI exploration
|
|
United States
|
Regulatory de-risking
|
Mojave FEIS approval
|
Nevada-focused development
|
|
Canada
|
Permitting efficiency
|
5-year federal assessment target
|
Strategic M&A & capital recycling
|
|
Switzerland
|
ESG & digitalization
|
Blockchain traceability & RWA tokens
|
Responsible gold & AI security
|
Gold Market Report Scope
Gold Market
|
Parameter
|
Details
|
|
Market Size (2025)
|
$228.8 Billion
|
|
Market Size (2035)
|
$526.9 Billion
|
|
Market Growth Rate
|
8.7%
|
|
Segments
|
By Source (Primary Mining, Secondary Gold, By-Product Gold), By End-Use Application (Investment, Jewelry, Technology, Healthcare, Aerospace, Industrial), By Product Form (Bullion Bars, Coins, Powder & Grain, Leaf & Foils)
|
|
Study Period
|
2019- 2024 and 2025-2034
|
|
Units
|
Revenue (USD)
|
|
Qualitative Analysis
|
Porter’s Five Forces, SWOT Profile, Market Share, Scenario Forecasts, Market Ecosystem, Company Ranking, Market Dynamics, Industry Benchmarking
|
|
Companies
|
Newmont Corporation, Barrick Gold Corporation, Agnico Eagle Mines Limited, Navoi Mining & Metallurgical Company, Polyus PJSC, AngloGold Ashanti plc, Gold Fields Limited, Zijin Mining Group Co. Ltd., Kinross Gold Corporation, Northern Star Resources Limited, Shandong Gold Mining Co. Ltd., Newcrest Mining, Endeavour Mining plc, Harmony Gold Mining Company, Perseus Mining Limited
|
|
Countries
|
US, Canada, Mexico, Germany, France, Spain, Italy, UK, Russia, China, India, Japan, South Korea, Australia, South East Asia, Brazil, Argentina, Middle East, Africa
|
Gold Market Segmentation
By Source
- Primary Mining
- Secondary Gold
- By-product Gold
By End-Use
- Investment
- Jewelry
- Technology
- Healthcare
- Aerospace
- Industrial
By Product Form
- Bullion Bars
- Gold Coins
- Gold Powder & Grain
- Gold Leaf & Foils
By Region
- North America (United States, Canada, Mexico)
- Europe (Germany, France, United Kingdom, Spain, Italy, Rest of Europe)
- Asia Pacific (China, India, Japan, South Korea, Australia, Rest of APAC)
- South and Central America (Brazil, Argentina, Rest of SCA)
- Middle East and Africa (Saudi Arabia, UAE, South Africa, Rest of Middle East, Rest of Africa)
Top Companies in Gold Market
- Newmont Corporation
- Barrick Gold Corporation
- Agnico Eagle Mines Limited
- Navoi Mining & Metallurgical Company
- Polyus PJSC
- AngloGold Ashanti plc
- Gold Fields Limited
- Zijin Mining Group Co., Ltd.
- Kinross Gold Corporation
- Northern Star Resources Limited
- Shandong Gold Mining Co., Ltd.
- Newcrest Mining
- Endeavour Mining plc
- Harmony Gold Mining Company
- Perseus Mining Limited
*- List not Exhaustive
