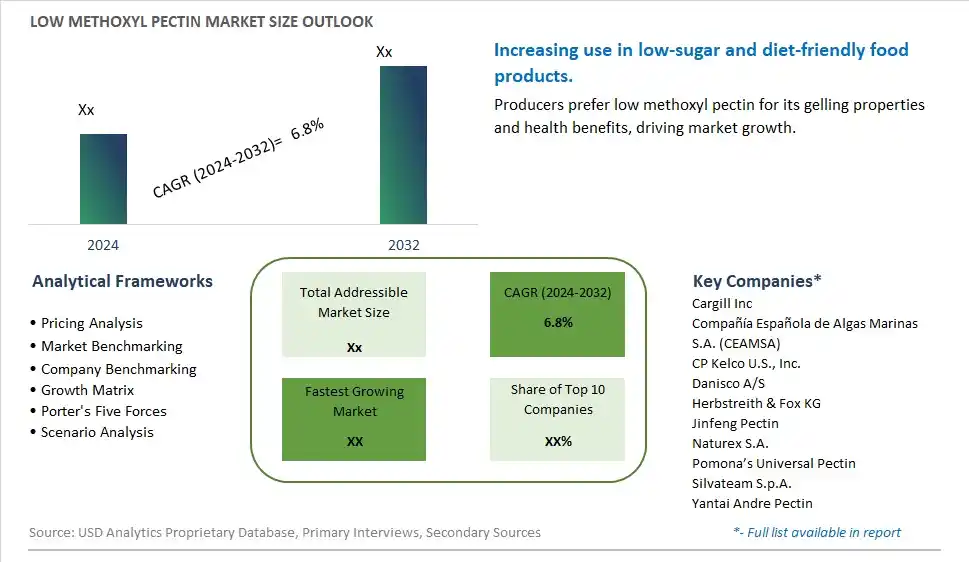
Global Low Methoxyl Pectin Market Size is valued at $XX Million in 2024 and is forecast to register a growth rate (CAGR) of 6.8% to reach $XX Million by 2032.
The global Low Methoxyl Pectin Market Comprehensive Study analyzes and forecasts the market size across 6 regions and 24 countries for diverse segments -By Product (Conventional Low Methoxyl (LMC), Amidated Low Methoxyl (LMA)), By Application (Food, Pharmaceuticals, Cosmetics)
An Introduction to Low Methoxyl Pectin Market
The low methoxyl pectin market in 2024 is expanding rapidly, driven by the demand for natural gelling agents used in low-sugar and sugar-free food products. Low methoxyl pectin, derived from citrus peels and apples, is used to thicken and stabilize jams, jellies, and dairy products. The market benefits from advancements in extraction and formulation technologies that enhance the functional properties and applications of pectin. The trend towards clean label and natural ingredients is influencing product development. Increasing consumer interest in low-sugar and natural food products, supported by the popularity of healthy eating, is further supporting market growth.
Low Methoxyl Pectin Competitive Landscape
The market report analyses the leading companies in the industry including Cargill Inc, Compañía Española de Algas Marinas S.A. (CEAMSA), CP Kelco U.S., Inc., Danisco A/S, Herbstreith & Fox KG, Jinfeng Pectin, Naturex S.A., Pomona’s Universal Pectin, Silvateam S.p.A., Yantai Andre Pectin, and Others.
Low Methoxyl Pectin Market Dynamics
Low Methoxyl Pectin Market Trend: Increasing Use in Low-Sugar and Natural Food Products
The most prominent trend in the Low Methoxyl Pectin Market is the increasing use in low-sugar and natural food products. Low methoxyl pectin, known for its gelling properties in low-sugar environments, is becoming a popular ingredient in jams, jellies, and other food products that aim to reduce sugar content while maintaining texture. This trend is driven by the demand for healthier and natural food options.
Low Methoxyl Pectin Market Driver: Health Consciousness and Demand for Clean Label Ingredients
A key driver in the Low Methoxyl Pectin Market is health consciousness and the demand for clean label ingredients. As more individuals focus on consuming foods free from artificial additives and preservatives, there is a rising demand for low methoxyl pectin that provides natural and functional benefits. This demand supports market growth as consumers seek natural and minimally processed food ingredients.
Low Methoxyl Pectin Market Opportunity: Expansion into Functional Foods and Beverages
One significant opportunity in the Low Methoxyl Pectin Market lies in expansion into functional foods and beverages. Companies can innovate by incorporating low methoxyl pectin into a variety of products, such as health bars, protein shakes, and low-sugar desserts, offering consumers convenient and health-focused options. By highlighting the benefits and versatility of low methoxyl pectin, manufacturers can attract a broader consumer base and drive market growth.
Low Methoxyl Pectin Market Share Analysis- Largest Segment by Product
In the Low Methoxyl Pectin Market, the Conventional Low Methoxyl (LMC) product is the largest segment. Conventional LMC pectin is widely used in food applications, particularly in jams and jellies, due to its gelling properties and versatility. Its well-established usage and broad acceptance in the food industry make it the dominant product type in the market. The reliability and effectiveness of conventional LMC in achieving desired textures and consistencies contribute to its market leadership.
Low Methoxyl Pectin Market Share Analysis- Poised to Grow Fastest Over the Next Five Years by Application
In the Low Methoxyl Pectin Market, the Food application segment is poised to grow the fastest over the next five years. This growth is driven by the increasing demand for pectin as a gelling agent in various food products, including jams, jellies, and confectioneries. The rising consumer preference for natural and clean-label ingredients in food products supports the demand for low methoxyl pectin, which is favored for its ability to gel without the need for high sugar content. The expansion of the food industry and innovation in product formulations further contribute to the rapid growth of this segment.
Low Methoxyl Pectin Market Segmentation
By Product
Conventional Low Methoxyl (LMC)
Amidated Low Methoxyl (LMA)
By Application
Food
Pharmaceuticals
Cosmetics
Countries Analyzed
North America (US, Canada, Mexico)
Europe (Germany, UK, France, Spain, Italy, Russia, Rest of Europe)
Asia Pacific (China, India, Japan, South Korea, Australia, South East Asia, Rest of Asia)
South America (Brazil, Argentina, Rest of South America)
Middle East and Africa (Saudi Arabia, UAE, Rest of Middle East, South Africa, Egypt, Rest of Africa)
Low Methoxyl Pectin Companies Profiled in the Study
Cargill Inc
Compañía Española de Algas Marinas S.A. (CEAMSA)
CP Kelco U.S., Inc.
Danisco A/S
Herbstreith & Fox KG
Jinfeng Pectin
Naturex S.A.
Pomona’s Universal Pectin
Silvateam S.p.A.
Yantai Andre Pectin
*- List Not Exhaustive
Chapter 1. TABLE OF CONTENTS
Chapter 2. Introduction to Low Methoxyl Pectin Market
2.1. Market Overview
2.2. Key Statistics and Report Highlights
2.3. Scope of the Comprehensive Study
2.3.1. Market Definition
2.3.2 Countries and Regions Covered
2.3.3 Research Objective
2.3.4 Units, Currency, and Conversions
2.3.5 Industry Value Chain
2.4. Key Market Segments
2.5. Key Companies
2.6. Study Period
Chapter 3. Strategic Analysis Review
3.1. Low Methoxyl Pectin Pricing Analysis and Forecast
3.2. Porter’s Five Forces
3.3. Market Ecosystem
3.4. SWOT Analysis
3.5. Regulatory Scenario
3.3. Effects of Inflation, Russia-Ukraine War, moderating economic growth, and other macroeconomic factors
Chapter 4. Competitive Landscape
4.1. Market Share Analysis
4.1.1. Global Low Methoxyl Pectin Market Share by Company, 2023
4.1.2. Product Offerings of Leading Low Methoxyl Pectin Companies
4.2. Market Entropy
4.2.1. New Product Launches in the Industry
4.2.2. Mergers, Acquisitions, Joint ventures, and Partnerships
4.3. Key Strategies and Best Practices
Chapter 5. Global Market Projections: Best, Reference, and Low Case Scenarios
5.1. Growth Analysis- Case Scenario Definitions
5.2. Low Growth Case Scenario Forecasts
5.3. Reference Growth Case Scenario Forecasts
5.4. High Growth Case Scenario Forecasts
Chapter 6. Market Dynamics
6.1. Low Methoxyl Pectin Market Drivers
6.2. Low Methoxyl Pectin Market Challenges
6.6. Low Methoxyl Pectin Market Opportunities
6.4. Low Methoxyl Pectin Market Trends
Chapter 7. Global Low Methoxyl Pectin Market Outlook Trends
7.1. Global Low Methoxyl Pectin Revenue (USD Million) and CAGR (%) by Type (2021-2032)
7.2. Global Low Methoxyl Pectin Revenue (USD Million) and CAGR (%) by Application (2021-2032)
7.3. Global Low Methoxyl Pectin Revenue (USD Million) and CAGR (%) by Product (2021-2032)
By Product
Conventional Low Methoxyl (LMC)
Amidated Low Methoxyl (LMA)
By Application
Food
Pharmaceuticals
Cosmetics
Chapter 8. Global Low Methoxyl Pectin Regional Analysis and Outlook
8.1. Global Low Methoxyl Pectin Revenue (USD Million) By Regions (2021- 2032)
8.2. North America Low Methoxyl Pectin Revenue (USD Million) by Country (2021-2032)
8.2.1. United States Low Methoxyl Pectin Regional Analysis and Outlook
8.2.2. Canada Low Methoxyl Pectin Regional Analysis and Outlook
8.2.3. Mexico Low Methoxyl Pectin Regional Analysis and Outlook
8.3. Europe Low Methoxyl Pectin Revenue (USD Million), by Country (2021-2032)
8.3.1. Germany Low Methoxyl Pectin Regional Analysis and Outlook
8.3.2. France Low Methoxyl Pectin Regional Analysis and Outlook
8.3.3. United Kingdom Low Methoxyl Pectin Regional Analysis and Outlook
8.3.4. Spain Low Methoxyl Pectin Regional Analysis and Outlook
8.3.5. Italy Low Methoxyl Pectin Regional Analysis and Outlook
8.3.6. Russia Low Methoxyl Pectin Regional Analysis and Outlook
8.3.7. Rest of Europe Low Methoxyl Pectin Regional Analysis and Outlook
8.4. Asia Pacific Low Methoxyl Pectin Revenue (USD Million) by Country (2021-2032)
8.4.1. China Low Methoxyl Pectin Regional Analysis and Outlook
8.4.2. Japan Low Methoxyl Pectin Regional Analysis and Outlook
8.4.3. India Low Methoxyl Pectin Regional Analysis and Outlook
8.4.4. South Korea Low Methoxyl Pectin Regional Analysis and Outlook
8.4.5. Australia Low Methoxyl Pectin Regional Analysis and Outlook
8.4.6. South East Asia Low Methoxyl Pectin Regional Analysis and Outlook
8.4.7. Rest of Asia Pacific Low Methoxyl Pectin Regional Analysis and Outlook
8.5. South America Low Methoxyl Pectin Revenue (USD Million), by Country (2021-2032)
8.5.1. Brazil Low Methoxyl Pectin Regional Analysis and Outlook
8.5.2. Argentina Low Methoxyl Pectin Regional Analysis and Outlook
8.5.3. Rest of South America Low Methoxyl Pectin Regional Analysis and Outlook
8.6. Middle East and Africa Low Methoxyl Pectin Revenue (USD Million) by Country (2021-2032)
8.6.1. Middle East Low Methoxyl Pectin Regional Analysis and Outlook
8.6.2. Africa Low Methoxyl Pectin Regional Analysis and Outlook
Chapter 9. North America Low Methoxyl Pectin Analysis and Outlook
9.1. North America Low Methoxyl Pectin Revenue (USD Million) by Segments (2021-2032)
9.1.1. North America Low Methoxyl Pectin Revenue (USD Million) by Type (2021-2032)
9.1.2. North America Low Methoxyl Pectin Revenue (USD Million) by Application (2021-2032)
9.1.3. North America Low Methoxyl Pectin Revenue (USD Million) by Product (2021-2032)
By Product
Conventional Low Methoxyl (LMC)
Amidated Low Methoxyl (LMA)
By Application
Food
Pharmaceuticals
Cosmetics
Chapter 10. Europe Low Methoxyl Pectin Analysis and Outlook
10.1. Europe Low Methoxyl Pectin Revenue (USD Million), by Segments (USD Million) (2021-2032)
10.1.1. Europe Low Methoxyl Pectin Revenue (USD Million) by Type (2021-2032)
10.1.2. Europe Low Methoxyl Pectin Revenue (USD Million) by Application (2021-2032)
10.1.3. Europe Low Methoxyl Pectin Revenue (USD Million) by Product (2021-2032)
By Product
Conventional Low Methoxyl (LMC)
Amidated Low Methoxyl (LMA)
By Application
Food
Pharmaceuticals
Cosmetics
Chapter 11. Asia Pacific Low Methoxyl Pectin Analysis and Outlook
11.1. Asia Pacific Low Methoxyl Pectin Revenue (USD Million), and Revenue (USD Million) by Segments (2021-2032)
11.1.1. Asia Pacific Low Methoxyl Pectin Revenue (USD Million) by Type (2021-2032)
11.1.2. Asia Pacific Low Methoxyl Pectin Revenue (USD Million) by Application (2021-2032)
11.1.3. Asia Pacific Low Methoxyl Pectin Revenue (USD Million) by Product (2021-2032)
By Product
Conventional Low Methoxyl (LMC)
Amidated Low Methoxyl (LMA)
By Application
Food
Pharmaceuticals
Cosmetics
Chapter 12. South America Low Methoxyl Pectin Analysis and Outlook
12.1. South America Low Methoxyl Pectin Revenue (USD Million), by Segments (2021-2032)
12.1.1. South America Low Methoxyl Pectin Revenue (USD Million) by Type (2021-2032)
12.1.2. South America Low Methoxyl Pectin Revenue (USD Million) by Application (2021-2032)
12.1.3. South America Low Methoxyl Pectin Revenue (USD Million) by Product (2021-2032)
By Product
Conventional Low Methoxyl (LMC)
Amidated Low Methoxyl (LMA)
By Application
Food
Pharmaceuticals
Cosmetics
Chapter 13. Middle East and Africa Low Methoxyl Pectin Analysis and Outlook
13.1. Middle East and Africa Low Methoxyl Pectin Revenue (USD Million), by Segments (2021-2032)
13.1.1. Middle East and Africa Low Methoxyl Pectin Revenue (USD Million) by Type (2021-2032)
13.1.2. Middle East and Africa Low Methoxyl Pectin Revenue (USD Million) by Application (2021-2032)
13.1.3. Middle East and Africa Low Methoxyl Pectin Revenue (USD Million) by Product (2021-2032)
By Product
Conventional Low Methoxyl (LMC)
Amidated Low Methoxyl (LMA)
By Application
Food
Pharmaceuticals
Cosmetics
Chapter 14. Low Methoxyl Pectin Company Profiles
14.1 Business Overview
14.2 Product Profiles
14.3 SWOT Profiles
14.5 Recent Developments
14.6 Financial Profile
List of Companies
Cargill Inc
Compañía Española de Algas Marinas S.A. (CEAMSA)
CP Kelco U.S., Inc.
Danisco A/S
Herbstreith & Fox KG
Jinfeng Pectin
Naturex S.A.
Pomona’s Universal Pectin
Silvateam S.p.A.
Yantai Andre Pectin
15. Methodology and Data Sources
15.1 Customization Offerings
15.2 Subscription Services
15.3 Related Reports
15.4 Publisher Expertise
LIST OF TABLES
Table 1 Market Segmentation Analysis
Table 2 Global Low Methoxyl Pectin Market Share of Leading Companies, 2023
Table 3 Product Offerings of Leading Companies
Table 4 Low Growth Scenario Forecasts
Table 5 Reference Case Growth Scenario
Table 6 High Growth Case Scenario
Table 7 Global Low Methoxyl Pectin Revenue (USD Million) And CAGR (%) By Type (2021-2032)
Table 8 Global Low Methoxyl Pectin Revenue (USD Million) And CAGR (%) By Application (2021-2032)
Table 9 Global Low Methoxyl Pectin Revenue (USD Million) And CAGR (%) By Product (2021-2032)
Table 10 Global Low Methoxyl Pectin Market Revenue (USD Million) By Regions (2021-2032)
Table 11 Global Low Methoxyl Pectin Market Share (%) By Regions (2021-2032)
Table 12 North America Low Methoxyl Pectin Revenue (USD Million) By Country (2021-2032)
Table 13 Europe Low Methoxyl Pectin Revenue (USD Million) By Country (2021-2032)
Table 14 Asia Pacific Low Methoxyl Pectin Revenue (USD Million) By Country (2021-2032)
Table 15 South America Low Methoxyl Pectin Revenue (USD Million) By Country (2021-2032)
Table 16 Middle East and Africa Low Methoxyl Pectin Revenue (USD Million) By Region (2021-2032)
Table 17 North America Low Methoxyl Pectin Revenue (USD Million) By Type (2021-2032)
Table 18 North America Low Methoxyl Pectin Revenue (USD Million) By Application (2021-2032)
Table 19 North America Low Methoxyl Pectin Revenue (USD Million) By Product (2021-2032)
Table 20 Europe Low Methoxyl Pectin Revenue (USD Million) By Type (2021-2032)
Table 21 Europe Low Methoxyl Pectin Revenue (USD Million) By Application (2021-2032)
Table 22 Europe Low Methoxyl Pectin Revenue (USD Million) By Product (2021-2032)
Table 23 Asia Pacific Low Methoxyl Pectin Revenue (USD Million) By Type (2021-2032)
Table 24 Asia Pacific Low Methoxyl Pectin Revenue (USD Million) By Application (2021-2032)
Table 25 Asia Pacific Low Methoxyl Pectin Revenue (USD Million) By Product (2021-2032)
Table 26 South America Low Methoxyl Pectin Revenue (USD Million) By Type (2021-2032)
Table 27 South America Low Methoxyl Pectin Revenue (USD Million) By Application (2021-2032)
Table 28 South America Low Methoxyl Pectin Revenue (USD Million) By Product (2021-2032)
Table 29 Middle East and Africa Low Methoxyl Pectin Revenue (USD Million) By Type (2021-2032)
Table 30 Middle East and Africa Low Methoxyl Pectin Revenue (USD Million) By Application (2021-2032)
Table 31 Middle East and Africa Low Methoxyl Pectin Revenue (USD Million) By Product (2021-2032)
LIST OF FIGURES
Figure 1. Market Scope
Figure 2. Pricing Forecasts Per Unit, 2023- 2032
Figure 3. Porter’s Five Forces
Figure 4. Global Low Methoxyl Pectin Market Revenue (USD Million) By Regions (2021-2032)
Figure 5. Global Low Methoxyl Pectin Market Share (%) By Regions (2023)
Figure 6. North America Low Methoxyl Pectin Revenue (USD Million) By Country (2021-2032)
Figure 7. United States Low Methoxyl Pectin Revenue (USD Million) By Country (2021-2032)
Figure 8. Canada Low Methoxyl Pectin Revenue (USD Million) By Country (2021-2032)
Figure 9. Mexico Low Methoxyl Pectin Revenue (USD Million) By Country (2021-2032)
Figure 10. Europe Low Methoxyl Pectin Revenue (USD Million) By Country (2021-2032)
Figure 11. Germany Low Methoxyl Pectin Revenue (USD Million) By Country (2021-2032)
Figure 12. France Low Methoxyl Pectin Revenue (USD Million) By Country (2021-2032)
Figure 13. United Kingdom Low Methoxyl Pectin Revenue (USD Million) By Country (2021-2032)
Figure 14. Spain Low Methoxyl Pectin Revenue (USD Million) By Country (2021-2032)
Figure 15. Italy Low Methoxyl Pectin Revenue (USD Million) By Country (2021-2032)
Figure 16. Russia Low Methoxyl Pectin Revenue (USD Million) By Country (2021-2032)
Figure 17. Rest of Europe Low Methoxyl Pectin Revenue (USD Million) By Country (2021-2032)
Figure 11. Asia Pacific Low Methoxyl Pectin Revenue (USD Million) By Country (2021-2032)
Figure 12. China Low Methoxyl Pectin Revenue (USD Million) By Country (2021-2032)
Figure 13. Japan Low Methoxyl Pectin Revenue (USD Million) By Country (2021-2032)
Figure 14. India Low Methoxyl Pectin Revenue (USD Million) By Country (2021-2032)
Figure 15. South Korea Low Methoxyl Pectin Revenue (USD Million) By Country (2021-2032)
Figure 16. Australia Low Methoxyl Pectin Revenue (USD Million) By Country (2021-2032)
Figure 17. South East Asia Low Methoxyl Pectin Revenue (USD Million) By Country (2021-2032)
Figure 18. South America Low Methoxyl Pectin Revenue (USD Million) By Country (2021-2032)
Figure 19. Brazil Low Methoxyl Pectin Revenue (USD Million) By Country (2021-2032)
Figure 20. Argentina Low Methoxyl Pectin Revenue (USD Million) By Country (2021-2032)
Figure 21. Rest of Asia Pacific Low Methoxyl Pectin Revenue (USD Million) By Country (2021-2032)
Figure 22. Middle East and Africa Low Methoxyl Pectin Revenue (USD Million) By Region (2021-2032)
Figure 23. Saudi Arabia Low Methoxyl Pectin Revenue (USD Million) By Region (2021-2032)
Figure 24. The UAE Low Methoxyl Pectin Revenue (USD Million) By Region (2021-2032)
Figure 25. Rest of Middle East Low Methoxyl Pectin Revenue (USD Million) By Region (2021-2032)
Figure 26. South Africa Low Methoxyl Pectin Revenue (USD Million) By Region (2021-2032)
Figure 27. Africa Low Methoxyl Pectin Revenue (USD Million) By Region (2021-2032)
Figure 28. North America Low Methoxyl Pectin Revenue (USD Million) By Type (2021-2032)
Figure 29. North America Low Methoxyl Pectin Revenue (USD Million) By Application (2021-2032)
Figure 30. North America Low Methoxyl Pectin Revenue (USD Million) By Product (2021-2032)
Figure 31. Europe Low Methoxyl Pectin Revenue (USD Million) By Type (2021-2032)
Figure 32. Europe Low Methoxyl Pectin Revenue (USD Million) By Application (2021-2032)
Figure 33. Europe Low Methoxyl Pectin Revenue (USD Million) By Product (2021-2032)
Figure 34. Asia Pacific Low Methoxyl Pectin Revenue (USD Million) By Type (2021-2032)
Figure 35. Asia Pacific Low Methoxyl Pectin Revenue (USD Million) By Application (2021-2032)
Figure 36. Asia Pacific Low Methoxyl Pectin Revenue (USD Million) By Product (2021-2032)
Figure 37. South America Low Methoxyl Pectin Revenue (USD Million) By Type (2021-2032)
Figure 38. South America Low Methoxyl Pectin Revenue (USD Million) By Application (2021-2032)
Figure 39. South America Low Methoxyl Pectin Revenue (USD Million) By Product (2021-2032)
Figure 40. Middle East and Africa Low Methoxyl Pectin Revenue (USD Million) By Type (2021-2032)
Figure 41. Middle East and Africa Low Methoxyl Pectin Revenue (USD Million) By Application (2021-2032)
Figure 42. Middle East and Africa Low Methoxyl Pectin Revenue (USD Million) By Product (2021-2032)
By Product
Conventional Low Methoxyl (LMC)
Amidated Low Methoxyl (LMA)
By Application
Food
Pharmaceuticals
Cosmetics
Countries Analyzed
North America (US, Canada, Mexico)
Europe (Germany, UK, France, Spain, Italy, Russia, Rest of Europe)
Asia Pacific (China, India, Japan, South Korea, Australia, South East Asia, Rest of Asia)
South America (Brazil, Argentina, Rest of South America)
Middle East and Africa (Saudi Arabia, UAE, Rest of Middle East, South Africa, Egypt, Rest of Africa)
