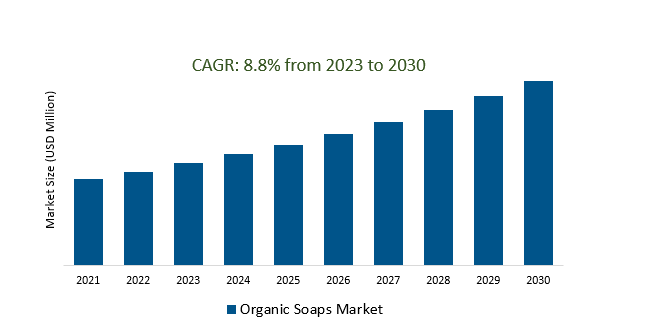
The Global Organic Soaps Market Size is estimated to register 8.8% growth over the forecast period from 2023 to 2030.
Organic Soaps Market Overview
Increasing concerns about synthetic chemicals in personal care products and a growing emphasis on health and environmental sustainability are the key factors driving the demand. Brands are focusing on eco-friendly packaging solutions, such as recyclable materials, minimalistic packaging, biodegradable options, or refillable containers, to reduce environmental impact. Organic soaps, formulated with natural ingredients like essential oils, botanical extracts, and plant-based oils, are seen as beneficial for skin health and is fueling the demand. The accessibility and convenience of online shopping platforms is significantly contributing to the market's expansion. Companies offering customizable options, allowing customers to choose ingredients or scents according to their specific skin type or preferences is highly rising the demand.
Organic Soaps Market Dynamics
Market Trends- The Organic Soap Market's Emphasis on Health and Wellness.
Organic soaps with clean labels, devoid of synthetic chemicals like parabens, sulfates, and artificial fragrances is increasing the demand for transparency and ingredient purity.
Companies are integrating soaps with natural ingredients associated with various skin benefits, such as moisturizing, soothing, or targeting specific skin concerns like acne or sensitivity. Further, the emphasis on holistic wellness is leading to a convergence of skincare and self-care routines driving the market growth.
Brands are highlighting products' purity and the benefits of using naturally derived ingredients which appeal to health-conscious consumers looking for skincare solutions that align with their values.
Market Driver- E-commerce emergence is transforming organic soap purchasing patterns.
E-commerce is expanding the reach of organic soap products to a global audience. The increased accessibility is enabling consumers from various geographical locations to access and purchase organic soaps conveniently, driving market growth.
Businesses are reducing overhead costs related to rent, utilities, and staff, channeling resources towards product development, marketing strategies, and enhancing the customer experience online.
Further, Engaging content, personalized communication, and interactive experiences enable businesses to build strong relationships with their audience, fostering trust and loyalty is highly driving the demand.
Market Opportunity – Introduction of Regularity support and Certification Standards in organic soap market.
Obtaining recognized certifications validates a brand's commitment to quality, authenticity, and adherence to strict organic guidelines. Sustainable sourcing, eco-friendly manufacturing processes, and biodegradable packaging are fueling the demand.
Companies, viewing certifications to expand their market reach, increase sales potential, and gain a competitive advantage over non-certified counterparts is the key factor.
Further, the advantage of mitigating risks associated with misleading claims or non-compliance, safeguarding against potential fines or consumer backlash are supporting the demand growth.
Market Share Analysis- Online organic soap market is registering the fastest growth.
The Global organic soap market is analyzed across Supermarkets/Hypermarkets, Retail, Online & Others. Online is poised to register the fastest growth. Online sales of organic soap products were gaining momentum due to the convenience and flexibility they offer to consumers. The ease of browsing through a wide range of organic soap brands, comparing products, reading reviews, and making purchases from the comfort of one's home contributed to the rapid growth of the online distribution channel. Additionally, direct-to-consumer models and the rise of specialized online retailers focusing on natural and organic products further fueled the growth of organic soap sales online. Fast and reliable shipping options, along with hassle-free return policies are increasing consumer confidence in purchasing organic soap products online.
Market Share Analysis- The personal care segment held a significant market share in 2023.
The Global organic soap market is analyzed across various applications such as Personal Care, Hotels and Boutiques Resorts & Others. Of these, Personal Care held a significant market share in 2023. The increasing consumer preference for natural and chemical-free skincare products has driven the demand for organic soaps in the personal care segment. The growing awareness of health and wellness is leading many individuals to seek alternative options, such as organic soaps, which are perceived as safer and gentler on the skin due to their use of natural ingredients like essential oils, plant extracts, and nourishing oils. Soaps tailored for specific skin types (such as sensitive skin, dry skin, or acne-prone skin), formulations targeting skin concerns (like moisturizing, exfoliating, or anti-aging properties), and diverse scents and textures to cater to individual preferences are driving the demand.
Organic Soaps Market Segmentation
By Type
- Bar Soap
- Liquid Soap
- Paper Soap
By Distribution Channel
- Supermarkets/Hypermarkets
- Retail
- Online
- Others
By Application
- Personal Care
- Hotels and Boutiques Resorts
- Others
By Region
- North America (United States, Canada, Mexico)
- Europe (Germany, France, United Kingdom, Spain, Italy, Others)
- Asia Pacific (China, India, Japan, South Korea, Australia, Others)
- Latin America (Brazil, Argentina, Others)
- Middle East and Africa (Saudi Arabia, UAE, Kuwait, Other Middle East, South Africa, Nigeria, Other Africa)
Organic Soaps Market Companies
- Laverana GmbH & Co. KG
- Davines S.p.A.
- Neal's Yard Remedies
- Procter & Gamble Company
- Foxyskin FZ LLC
- Khaadi Corporation Pvt. Limited
- Bio Veda Action Research Co
- Beach Organics
- Sundial Brands LLC
- Truly's Natural Products
- The Bio-D Company.
- Be One Organics
*List not exhaustive
Organic Soaps Market Outlook 2023
1 Market Overview
1.1 Introduction to the Organic Soaps Market
1.2 Scope of the Study
1.3 Research Objective
1.3.1 Key Market Scope and Segments
1.3.2 Players Covered
1.3.3 Years Considered
2 Executive Summary
2.1 2023 Organic Soaps Industry- Market Statistics
3 Market Dynamics
3.1 Market Drivers
3.2 Market Challenges
3.3 Market Opportunities
3.4 Market Trends
4 Market Factor Analysis
4.1 Porter’s Five Forces
4.2 Market Entropy
4.2.1 Global Organic Soaps Market Companies with Area Served
4.2.2 Products Offerings Global Organic Soaps Market
5 COVID-19 Impact Analysis and Outlook Scenarios
5.1.1 Covid-19 Impact Analysis
5.1.2 post-COVID-19 Scenario- Low Growth Case
5.1.3 post-COVID-19 Scenario- Reference Growth Case
5.1.4 post-COVID-19 Scenario- Low Growth Case
6 Global Organic Soaps Market Trends
6.1 Global Organic Soaps Revenue (USD Million) and CAGR (%) by Type (2018-2030)
6.2 Global Organic Soaps Revenue (USD Million) and CAGR (%) by Applications (2018-2030)
6.3 Global Organic Soaps Revenue (USD Million) and CAGR (%) by regions (2018-2030)
7 Global Organic Soaps Market Revenue (USD Million) by Type, and Applications (2018-2022)
7.1 Global Organic Soaps Revenue (USD Million) by Type (2018-2022)
7.1.1 Global Organic Soaps Revenue (USD Million), Market Share (%) by Type (2018-2022)
7.2 Global Organic Soaps Revenue (USD Million) by Applications (2018-2022)
7.2.1 Global Organic Soaps Revenue (USD Million), Market Share (%) by Applications (2018-2022)
8 Global Organic Soaps Development Regional Status and Outlook
8.1 Global Organic Soaps Revenue (USD Million) By Regions (2018-2022)
8.2 North America Organic Soaps Revenue (USD Million) by Type, and Application (2018-2022)
8.2.1 North America Organic Soaps Revenue (USD Million) by Country (2018-2022)
8.2.2 North America Organic Soaps Revenue (USD Million) by Type (2018-2022)
8.2.3 North America Organic Soaps Revenue (USD Million) by Applications (2018-2022)
8.3 Europe Organic Soaps Revenue (USD Million), by Type, and Applications (USD Million) (2018-2022)
8.3.1 Europe Organic Soaps Revenue (USD Million), by Country (2018-2022)
8.3.2 Europe Organic Soaps Revenue (USD Million) by Type (2018-2022)
8.3.3 Europe Organic Soaps Revenue (USD Million) by Applications (2018-2022)
8.4 Asia Pacific Organic Soaps Revenue (USD Million), and Revenue (USD Million) by Type, and Applications (2018-2022)
8.4.1 Asia Pacific Organic Soaps Revenue (USD Million) by Country (2018-2022)
8.4.2 Asia Pacific Organic Soaps Revenue (USD Million) by Type (2018-2022)
8.4.3 Asia Pacific Organic Soaps Revenue (USD Million) by Applications (2018-2022)
8.5 South America Organic Soaps Revenue (USD Million), by Type, and Applications (2018-2022)
8.5.1 South America Organic Soaps Revenue (USD Million), by Country (2018-2022)
8.5.2 South America Organic Soaps Revenue (USD Million) by Type (2018-2022)
8.5.3 South America Organic Soaps Revenue (USD Million) by Applications (2018-2022)
8.6 Middle East and Africa Organic Soaps Revenue (USD Million), by Type, Technology, Application, Thickness (2018-2022)
8.6.1 Middle East and Africa Organic Soaps Revenue (USD Million) by Country (2018-2022)
8.6.2 Middle East and Africa Organic Soaps Revenue (USD Million) by Type (2018-2022)
8.6.3 Middle East and Africa Organic Soaps Revenue (USD Million) by Applications (2018-2022)
9 Company Profiles
10 Global Organic Soaps Market Revenue (USD Million), by Type, and Applications (2023-2030)
10.1 Global Organic Soaps Revenue (USD Million) and Market Share (%) by Type (2023-2030)
10.1.1 Global Organic Soaps Revenue (USD Million), and Market Share (%) by Type (2023-2030)
10.2 Global Organic Soaps Revenue (USD Million) and Market Share (%) by Applications (2023-2030)
10.2.1 Global Organic Soaps Revenue (USD Million), and Market Share (%) by Applications (2023-2030)
11 Global Organic Soaps Development Regional Status and Outlook Forecast
11.1 Global Organic Soaps Revenue (USD Million) By Regions (2023-2030)
11.2 North America Organic Soaps Revenue (USD Million) by Type, and Applications (2023-2030)
11.2.1 North America Organic Soaps Revenue (USD) Million by Country (2023-2030)
11.2.2 North America Organic Soaps Revenue (USD Million), by Type (2023-2030)
11.2.3 North America Organic Soaps Revenue (USD Million), Market Share (%) by Applications (2023-2030)
11.3 Europe Organic Soaps Revenue (USD Million), by Type, and Applications (2023-2030)
11.3.1 Europe Organic Soaps Revenue (USD Million), by Country (2023-2030)
11.3.2 Europe Organic Soaps Revenue (USD Million), by Type (2023-2030)
11.3.3 Europe Organic Soaps Revenue (USD Million), by Applications (2023-2030)
11.4 Asia Pacific Organic Soaps Revenue (USD Million) by Type, and Applications (2023-2030)
11.4.1 Asia Pacific Organic Soaps Revenue (USD Million), by Country (2023-2030)
11.4.2 Asia Pacific Organic Soaps Revenue (USD Million), by Type (2023-2030)
11.4.3 Asia Pacific Organic Soaps Revenue (USD Million), by Applications (2023-2030)
11.5 South America Organic Soaps Revenue (USD Million), by Type, and Applications (2023-2030)
11.5.1 South America Organic Soaps Revenue (USD Million), by Country (2023-2030)
11.5.2 South America Organic Soaps Revenue (USD Million), by Type (2023-2030)
11.5.3 South America Organic Soaps Revenue (USD Million), by Applications (2023-2030)
11.6 Middle East and Africa Organic Soaps Revenue (USD Million), by Type, and Applications (2023-2030)
11.6.1 Middle East and Africa Organic Soaps Revenue (USD Million), by region (2023-2030)
11.6.2 Middle East and Africa Organic Soaps Revenue (USD Million), by Type (2023-2030)
11.6.3 Middle East and Africa Organic Soaps Revenue (USD Million), by Applications (2023-2030)
12 Methodology and Data Sources
12.1 Methodology/Research Approach
12.1.1 Research Programs/Design
12.1.2 Market Size Estimation
12.1.3 Market Breakdown and Data Triangulation
12.2 Data Sources
12.2.1 Secondary Sources
12.2.2 Primary Sources
12.3 Disclaimer
List of Tables
Table 1 Market Segmentation Analysis
Table 2 Global Organic Soaps Market Companies with Areas Served
Table 3 Products Offerings Global Organic Soaps Market
Table 4 Low Growth Scenario Forecasts
Table 5 Reference Case Growth Scenario
Table 6 High Growth Case Scenario
Table 7 Global Organic Soaps Revenue (USD Million) And CAGR (%) By Type (2018-2030)
Table 8 Global Organic Soaps Revenue (USD Million) And CAGR (%) By Applications (2018-2030)
Table 9 Global Organic Soaps Revenue (USD Million) And CAGR (%) By Regions (2018-2030)
Table 10 Global Organic Soaps Revenue (USD Million) By Type (2018-2022)
Table 11 Global Organic Soaps Revenue Market Share (%) By Type (2018-2022)
Table 12 Global Organic Soaps Revenue (USD Million) By Applications (2018-2022)
Table 13 Global Organic Soaps Revenue Market Share (%) By Applications (2018-2022)
Table 14 Global Organic Soaps Market Revenue (USD Million) By Regions (2018-2022)
Table 15 Global Organic Soaps Market Share (%) By Regions (2018-2022)
Table 16 North America Organic Soaps Revenue (USD Million) By Country (2018-2022)
Table 17 North America Organic Soaps Revenue (USD Million) By Type (2018-2022)
Table 18 North America Organic Soaps Revenue (USD Million) By Applications (2018-2022)
Table 19 Europe Organic Soaps Revenue (USD Million) By Country (2018-2022)
Table 20 Europe Organic Soaps Revenue (USD Million) By Type (2018-2022)
Table 21 Europe Organic Soaps Revenue (USD Million) By Applications (2018-2022)
Table 22 Asia Pacific Organic Soaps Revenue (USD Million) By Country (2018-2022)
Table 23 Asia Pacific Organic Soaps Revenue (USD Million) By Type (2018-2022)
Table 24 Asia Pacific Organic Soaps Revenue (USD Million) By Applications (2018-2022)
Table 25 South America Organic Soaps Revenue (USD Million) By Country (2018-2022)
Table 26 South America Organic Soaps Revenue (USD Million) By Type (2018-2022)
Table 27 South America Organic Soaps Revenue (USD Million) By Applications (2018-2022)
Table 28 Middle East and Africa Organic Soaps Revenue (USD Million) By Region (2018-2022)
Table 29 Middle East and Africa Organic Soaps Revenue (USD Million) By Type (2018-2022)
Table 30 Middle East and Africa Organic Soaps Revenue (USD Million) By Applications (2018-2022)
Table 31 Financial Analysis
Table 32 Global Organic Soaps Revenue (USD Million) By Type (2023-2030)
Table 33 Global Organic Soaps Revenue Market Share (%) By Type (2023-2030)
Table 34 Global Organic Soaps Revenue (USD Million) By Applications (2023-2030)
Table 35 Global Organic Soaps Revenue Market Share (%) By Applications (2023-2030)
Table 36 Global Organic Soaps Market Revenue (USD Million), And Revenue (USD Million) By Regions (2023-2030)
Table 37 North America Organic Soaps Revenue (USD)By Country (2023-2030)
Table 38 North America Organic Soaps Revenue (USD Million) By Type (2023-2030)
Table 39 North America Organic Soaps Revenue (USD Million) By Applications (2023-2030)
Table 40 Europe Organic Soaps Revenue (USD Million) By Country (2023-2030)
Table 41 Europe Organic Soaps Revenue (USD Million) By Type (2023-2030)
Table 42 Europe Organic Soaps Revenue (USD Million) By Applications (2023-2030)
Table 43 Asia Pacific Organic Soaps Revenue (USD Million) By Country (2023-2030)
Table 44 Asia Pacific Organic Soaps Revenue (USD Million) By Type (2023-2030)
Table 45 Asia Pacific Organic Soaps Revenue (USD Million) By Applications (2023-2030)
Table 46 South America Organic Soaps Revenue (USD Million) By Country (2023-2030)
Table 47 South America Organic Soaps Revenue (USD Million) By Type (2023-2030)
Table 48 South America Organic Soaps Revenue (USD Million) By Applications (2023-2030)
Table 49 Middle East and Africa Organic Soaps Revenue (USD Million) By Region (2023-2030)
Table 50 Middle East and Africa Organic Soaps Revenue (USD Million) By Region (2023-2030)
Table 51 Middle East and Africa Organic Soaps Revenue (USD Million) By Type (2023-2030)
Table 52 Middle East and Africa Organic Soaps Revenue (USD Million) By Applications (2023-2030)
Table 53 Research Programs/Design for This Report
Table 54 Key Data Information from Secondary Sources
Table 55 Key Data Information from Primary Sources
List of Figures
Figure 1 Market Scope
Figure 2 Porter’s Five Forces
Figure 3 Global Organic Soaps Revenue (USD Million) By Type (2018-2022)
Figure 4 Global Organic Soaps Revenue Market Share (%) By Type (2022)
Figure 5 Global Organic Soaps Revenue (USD Million) By Applications (2018-2022)
Figure 6 Global Organic Soaps Revenue Market Share (%) By Applications (2022)
Figure 7 Global Organic Soaps Market Revenue (USD Million) By Regions (2018-2022)
Figure 8 Global Organic Soaps Market Share (%) By Regions (2022)
Figure 9 North America Organic Soaps Revenue (USD Million) By Country (2018-2022)
Figure 10 North America Organic Soaps Revenue (USD Million) By Type (2018-2022)
Figure 11 North America Organic Soaps Revenue (USD Million) By Applications (2018-2022)
Figure 12 Europe Organic Soaps Revenue (USD Million) By Country (2018-2022)
Figure 13 Europe Organic Soaps Revenue (USD Million) By Type (2018-2022)
Figure 14 Europe Organic Soaps Revenue (USD Million) By Applications (2018-2022)
Figure 15 Asia Pacific Organic Soaps Revenue (USD Million) By Country (2018-2022)
Figure 16 Asia Pacific Organic Soaps Revenue (USD Million) By Type (2018-2022)
Figure 17 Asia Pacific Organic Soaps Revenue (USD Million) By Applications (2018-2022)
Figure 18 South America Organic Soaps Revenue (USD Million) By Country (2018-2022)
Figure 19 South America Organic Soaps Revenue (USD Million) By Type (2018-2022)
Figure 20 South America Organic Soaps Revenue (USD Million) By Applications (2018-2022)
Figure 21 Middle East and Africa Organic Soaps Revenue (USD Million) By Region (2018-2022)
Figure 22 Middle East and Africa Organic Soaps Revenue (USD Million) By Type (2018-2022)
Figure 23 Middle East and Africa Organic Soaps Revenue (USD Million) By Applications (2018-2022)
Figure 24 Global Organic Soaps Revenue (USD Million) By Type (2023-2030)
Figure 25 Global Organic Soaps Revenue Market Share (%) By Type (2030)
Figure 26 Global Organic Soaps Revenue (USD Million) By Applications (2023-2030)
Figure 27 Global Organic Soaps Revenue Market Share (%) By Applications (2030)
Figure 28 Global Organic Soaps Market Revenue (USD Million) By Regions (2023-2030)
Figure 29 North America Organic Soaps Revenue (USD Million) By Country (2023-2030)
Figure 30 North America Organic Soaps Revenue (USD Million) By Type (2023-2030)
Figure 31 North America Organic Soaps Revenue (USD Million) By Applications (2023-2030)
Figure 32 Europe Organic Soaps Revenue (USD Million) By Country (2023-2030)
Figure 33 Europe Organic Soaps Revenue (USD Million) By Type (2023-2030)
Figure 34 Europe Organic Soaps Revenue (USD Million) By Applications (2023-2030)
Figure 35 Asia Pacific Organic Soaps Revenue (USD Million) By Country (2023-2030)
Figure 36 Asia Pacific Organic Soaps Revenue (USD Million) By Type (2023-2030)
Figure 37 Asia Pacific Organic Soaps Revenue (USD Million) By Applications (2023-2030)
Figure 38 South America Organic Soaps Revenue (USD Million) By Country (2023-2030)
Figure 39 South America Organic Soaps Revenue (USD Million) By Type (2023-2030)
Figure 40 South America Organic Soaps Revenue (USD Million) By Applications (2023-2030)
Figure 41 Middle East and Africa Organic Soaps Revenue (USD Million) By Region (2023-2030)
Figure 42 Middle East and Africa Organic Soaps Revenue (USD Million) By Region (2023-2030)
Figure 43 Middle East and Africa Organic Soaps Revenue (USD Million) By Type (2023-2030)
Figure 44 Middle East and Africa Organic Soaps Revenue (USD Million) By Applications (2023-2030)
Figure 45 Bottom-Up and Top-Down Approaches for This Report
Figure 46 Data Triangulation
