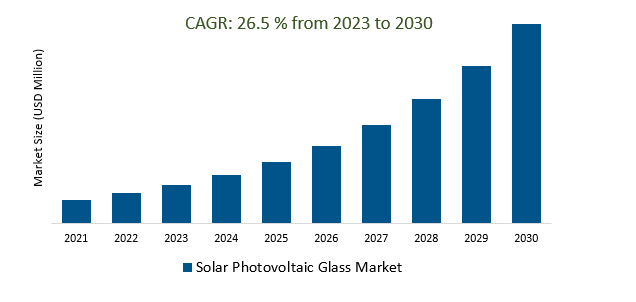
The Global Solar Photovoltaic Glass Market Size is estimated to register 26.5% growth over the forecast period from 2023 to 2030.
The market growth is driven by increasing Advancements in PV glass technology, including bifacial solar panels and transparent solar cells, which are making solar installations more efficient and aesthetically pleasing. These innovations were driving demand for new types of PV glass. Leading Companies focusing on Market Growth, Bifacial Technology, Transparent Solar Cells, Innovative Designs, Efficiency Improvements, Circular Economy and Recycling, and others to boost market shares in the industry.
Market Overview
The Solar Photovoltaic (PV) Glass market, as of September 2021, was characterized by robust growth driven by increasing global demand for clean energy, with various types of PV glass, including crystalline silicon, thin-film, bifacial, and transparent solar glass, offering diverse applications in the solar industry and building-integrated photovoltaics (BIPV). Government incentives, efficiency improvements, and decreasing costs were key market drivers, while environmental awareness and technological advancements furthered the market's expansion, with a focus on sustainable, energy-efficient building designs and emerging markets in Asia, Africa, and Latin America playing pivotal roles in its development.
Market Dynamics
Market Trends- The electrification of transportation is driving demand for solar photovoltaic glass, as electric vehicles and other electrified transportation systems require solar panels to charge their batteries.
The electrification of transportation is emerging as a significant driver for the Solar Photovoltaic Glass market. As the adoption of electric vehicles (EVs) and other electrified transportation systems continues to gain momentum, the need for sustainable charging solutions is becoming increasingly evident. Solar photovoltaic glass plays a crucial role in this scenario, offering an eco-friendly means to harness solar energy for EV charging infrastructure.
Market Driver- Growing demand for sustainability and ESG (environmental, social, and governance) goals is driving the growth of the solar photovoltaic glass market.
The growing emphasis on sustainability and the pursuit of Environmental, Social, and Governance (ESG) objectives are acting as powerful catalysts in propelling the solar photovoltaic glass market forward. As organizations and businesses increasingly commit to reducing their environmental impact and adopting clean energy solutions, the demand for solar PV glass, with its capacity to generate renewable energy while minimizing carbon footprints, is on the rise.
Market Opportunity- The solar photovoltaic glass market is growing rapidly, driven by the increasing demand for solar energy.
The solar photovoltaic glass market is experiencing rapid growth, primarily fueled by the surging global demand for solar energy. As the world strives to transition towards cleaner and more sustainable power sources, the appeal of solar PV glass, with its ability to capture sunlight and convert it into electricity, continues to rise. This escalating interest in solar power, coupled with advancements in photovoltaic technology and cost reductions, is contributing to the market's impressive expansion, meeting the needs of a planet increasingly focused on reducing carbon emissions and embracing renewable energy solutions.
Market Share Analysis- Tempered PV Glass Solar Photovoltaic Glass Market will register the fastest growth
The Global Solar Photovoltaic Glass Market is analyzed across Anti Reflective Coated PV Glass, Tempered PV Glass, TCO PV Glass, and others. Tempered PV Glass is poised to register the fastest growth. Tempered PV glass is a specialized segment within the Solar Photovoltaic Glass market, known for its durability and strength due to the tempering process. It is employed to protect photovoltaic cells in solar panels from environmental factors and provide structural support, making it a preferred choice for applications demanding robustness, such as utility-scale solar farms and commercial installations, aligning with the market's growth driven by the transition to sustainable energy sources.
Market Share Analysis- Thin Film Solar Cells held a significant market share in 2023
The Global Solar Photovoltaic Glass Market is analyzed across various applications including Silicon Solar Cells, Thin Film Solar Cells, and others. Of these, Thin Film Solar Cells held a significant market share in 2023. Thin film solar cells are a notable component of the Solar Photovoltaic Glass market, known for their flexibility, lightweight construction, and ease of integration into various surfaces. Applied to glass substrates, these cells are gaining popularity for BIPV applications and flexible solar panels, contributing to the market's growth by offering innovative solutions for solar energy generation in diverse architectural and industrial contexts.
Solar Photovoltaic Glass Market Segmentation
By Type
- Anti Reflective Coated PV Glass
- Tempered PV Glass
- TCO PV Glass
By Application
- Silicon Solar Cells
- Thin Film Solar Cells
By End User
By Region
- North America (United States, Canada, Mexico)
- Europe (Germany, France, United Kingdom, Spain, Italy, Others)
- Asia Pacific (China, India, Japan, South Korea, Australia, Others)
- Latin America (Brazil, Argentina, Others)
- Middle East and Africa (Saudi Arabia, UAE, Kuwait, Other Middle East, South Africa, Nigeria, Other Africa)
Solar Photovoltaic Glass Market Companies
- Saint-Gobain
- Guardian
- NSG
- AGC
- PPG
- Interfloat
- Trakya
- Taiwan Glass
- FLAT
- Xinyi Solar
- AVIC Sanxin
- Almaden
- Yuhua
- CSG
- Anci Hi-Tech
- Huamei Solar Glass
- Xiuqiang
- Topray Solar
- Irico Group
*List not exhaustive
Solar Photovoltaic Glass Market Outlook 2023
1 Market Overview
1.1 Introduction to the Solar Photovoltaic Glass Market
1.2 Scope of the Study
1.3 Research Objective
1.3.1 Key Market Scope and Segments
1.3.2 Players Covered
1.3.3 Years Considered
2 Executive Summary
2.1 2023 Solar Photovoltaic Glass Industry- Market Statistics
3 Market Dynamics
3.1 Market Drivers
3.2 Market Challenges
3.3 Market Opportunities
3.4 Market Trends
4 Market Factor Analysis
4.1 Porter’s Five Forces
4.2 Market Entropy
4.2.1 Global Solar Photovoltaic Glass Market Companies with Area Served
4.2.2 Products Offerings Global Solar Photovoltaic Glass Market
5 COVID-19 Impact Analysis and Outlook Scenarios
5.1.1 Covid-19 Impact Analysis
5.1.2 post-COVID-19 Scenario- Low Growth Case
5.1.3 post-COVID-19 Scenario- Reference Growth Case
5.1.4 post-COVID-19 Scenario- Low Growth Case
6 Global Solar Photovoltaic Glass Market Trends
6.1 Global Solar Photovoltaic Glass Revenue (USD Million) and CAGR (%) by Type (2018-2030)
6.2 Global Solar Photovoltaic Glass Revenue (USD Million) and CAGR (%) by Applications (2018-2030)
6.3 Global Solar Photovoltaic Glass Revenue (USD Million) and CAGR (%) by regions (2018-2030)
7 Global Solar Photovoltaic Glass Market Revenue (USD Million) by Type, and Applications (2018-2022)
7.1 Global Solar Photovoltaic Glass Revenue (USD Million) by Type (2018-2022)
7.1.1 Global Solar Photovoltaic Glass Revenue (USD Million), Market Share (%) by Type (2018-2022)
7.2 Global Solar Photovoltaic Glass Revenue (USD Million) by Applications (2018-2022)
7.2.1 Global Solar Photovoltaic Glass Revenue (USD Million), Market Share (%) by Applications (2018-2022)
8 Global Solar Photovoltaic Glass Development Regional Status and Outlook
8.1 Global Solar Photovoltaic Glass Revenue (USD Million) By Regions (2018-2022)
8.2 North America Solar Photovoltaic Glass Revenue (USD Million) by Type, and Application (2018-2022)
8.2.1 North America Solar Photovoltaic Glass Revenue (USD Million) by Country (2018-2022)
8.2.2 North America Solar Photovoltaic Glass Revenue (USD Million) by Type (2018-2022)
8.2.3 North America Solar Photovoltaic Glass Revenue (USD Million) by Applications (2018-2022)
8.3 Europe Solar Photovoltaic Glass Revenue (USD Million), by Type, and Applications (USD Million) (2018-2022)
8.3.1 Europe Solar Photovoltaic Glass Revenue (USD Million), by Country (2018-2022)
8.3.2 Europe Solar Photovoltaic Glass Revenue (USD Million) by Type (2018-2022)
8.3.3 Europe Solar Photovoltaic Glass Revenue (USD Million) by Applications (2018-2022)
8.4 Asia Pacific Solar Photovoltaic Glass Revenue (USD Million), and Revenue (USD Million) by Type, and Applications (2018-2022)
8.4.1 Asia Pacific Solar Photovoltaic Glass Revenue (USD Million) by Country (2018-2022)
8.4.2 Asia Pacific Solar Photovoltaic Glass Revenue (USD Million) by Type (2018-2022)
8.4.3 Asia Pacific Solar Photovoltaic Glass Revenue (USD Million) by Applications (2018-2022)
8.5 South America Solar Photovoltaic Glass Revenue (USD Million), by Type, and Applications (2018-2022)
8.5.1 South America Solar Photovoltaic Glass Revenue (USD Million), by Country (2018-2022)
8.5.2 South America Solar Photovoltaic Glass Revenue (USD Million) by Type (2018-2022)
8.5.3 South America Solar Photovoltaic Glass Revenue (USD Million) by Applications (2018-2022)
8.6 Middle East and Africa Solar Photovoltaic Glass Revenue (USD Million), by Type, Technology, Application, Thickness (2018-2022)
8.6.1 Middle East and Africa Solar Photovoltaic Glass Revenue (USD Million) by Country (2018-2022)
8.6.2 Middle East and Africa Solar Photovoltaic Glass Revenue (USD Million) by Type (2018-2022)
8.6.3 Middle East and Africa Solar Photovoltaic Glass Revenue (USD Million) by Applications (2018-2022)
9 Company Profiles
10 Global Solar Photovoltaic Glass Market Revenue (USD Million), by Type, and Applications (2023-2030)
10.1 Global Solar Photovoltaic Glass Revenue (USD Million) and Market Share (%) by Type (2023-2030)
10.1.1 Global Solar Photovoltaic Glass Revenue (USD Million), and Market Share (%) by Type (2023-2030)
10.2 Global Solar Photovoltaic Glass Revenue (USD Million) and Market Share (%) by Applications (2023-2030)
10.2.1 Global Solar Photovoltaic Glass Revenue (USD Million), and Market Share (%) by Applications (2023-2030)
11 Global Solar Photovoltaic Glass Development Regional Status and Outlook Forecast
11.1 Global Solar Photovoltaic Glass Revenue (USD Million) By Regions (2023-2030)
11.2 North America Solar Photovoltaic Glass Revenue (USD Million) by Type, and Applications (2023-2030)
11.2.1 North America Solar Photovoltaic Glass Revenue (USD) Million by Country (2023-2030)
11.2.2 North America Solar Photovoltaic Glass Revenue (USD Million), by Type (2023-2030)
11.2.3 North America Solar Photovoltaic Glass Revenue (USD Million), Market Share (%) by Applications (2023-2030)
11.3 Europe Solar Photovoltaic Glass Revenue (USD Million), by Type, and Applications (2023-2030)
11.3.1 Europe Solar Photovoltaic Glass Revenue (USD Million), by Country (2023-2030)
11.3.2 Europe Solar Photovoltaic Glass Revenue (USD Million), by Type (2023-2030)
11.3.3 Europe Solar Photovoltaic Glass Revenue (USD Million), by Applications (2023-2030)
11.4 Asia Pacific Solar Photovoltaic Glass Revenue (USD Million) by Type, and Applications (2023-2030)
11.4.1 Asia Pacific Solar Photovoltaic Glass Revenue (USD Million), by Country (2023-2030)
11.4.2 Asia Pacific Solar Photovoltaic Glass Revenue (USD Million), by Type (2023-2030)
11.4.3 Asia Pacific Solar Photovoltaic Glass Revenue (USD Million), by Applications (2023-2030)
11.5 South America Solar Photovoltaic Glass Revenue (USD Million), by Type, and Applications (2023-2030)
11.5.1 South America Solar Photovoltaic Glass Revenue (USD Million), by Country (2023-2030)
11.5.2 South America Solar Photovoltaic Glass Revenue (USD Million), by Type (2023-2030)
11.5.3 South America Solar Photovoltaic Glass Revenue (USD Million), by Applications (2023-2030)
11.6 Middle East and Africa Solar Photovoltaic Glass Revenue (USD Million), by Type, and Applications (2023-2030)
11.6.1 Middle East and Africa Solar Photovoltaic Glass Revenue (USD Million), by region (2023-2030)
11.6.2 Middle East and Africa Solar Photovoltaic Glass Revenue (USD Million), by Type (2023-2030)
11.6.3 Middle East and Africa Solar Photovoltaic Glass Revenue (USD Million), by Applications (2023-2030)
12 Methodology and Data Sources
12.1 Methodology/Research Approach
12.1.1 Research Programs/Design
12.1.2 Market Size Estimation
12.1.3 Market Breakdown and Data Triangulation
12.2 Data Sources
12.2.1 Secondary Sources
12.2.2 Primary Sources
12.3 Disclaimer
List of Tables
Table 1 Market Segmentation Analysis
Table 2 Global Solar Photovoltaic Glass Market Companies with Areas Served
Table 3 Products Offerings Global Solar Photovoltaic Glass Market
Table 4 Low Growth Scenario Forecasts
Table 5 Reference Case Growth Scenario
Table 6 High Growth Case Scenario
Table 7 Global Solar Photovoltaic Glass Revenue (USD Million) And CAGR (%) By Type (2018-2030)
Table 8 Global Solar Photovoltaic Glass Revenue (USD Million) And CAGR (%) By Applications (2018-2030)
Table 9 Global Solar Photovoltaic Glass Revenue (USD Million) And CAGR (%) By Regions (2018-2030)
Table 10 Global Solar Photovoltaic Glass Revenue (USD Million) By Type (2018-2022)
Table 11 Global Solar Photovoltaic Glass Revenue Market Share (%) By Type (2018-2022)
Table 12 Global Solar Photovoltaic Glass Revenue (USD Million) By Applications (2018-2022)
Table 13 Global Solar Photovoltaic Glass Revenue Market Share (%) By Applications (2018-2022)
Table 14 Global Solar Photovoltaic Glass Market Revenue (USD Million) By Regions (2018-2022)
Table 15 Global Solar Photovoltaic Glass Market Share (%) By Regions (2018-2022)
Table 16 North America Solar Photovoltaic Glass Revenue (USD Million) By Country (2018-2022)
Table 17 North America Solar Photovoltaic Glass Revenue (USD Million) By Type (2018-2022)
Table 18 North America Solar Photovoltaic Glass Revenue (USD Million) By Applications (2018-2022)
Table 19 Europe Solar Photovoltaic Glass Revenue (USD Million) By Country (2018-2022)
Table 20 Europe Solar Photovoltaic Glass Revenue (USD Million) By Type (2018-2022)
Table 21 Europe Solar Photovoltaic Glass Revenue (USD Million) By Applications (2018-2022)
Table 22 Asia Pacific Solar Photovoltaic Glass Revenue (USD Million) By Country (2018-2022)
Table 23 Asia Pacific Solar Photovoltaic Glass Revenue (USD Million) By Type (2018-2022)
Table 24 Asia Pacific Solar Photovoltaic Glass Revenue (USD Million) By Applications (2018-2022)
Table 25 South America Solar Photovoltaic Glass Revenue (USD Million) By Country (2018-2022)
Table 26 South America Solar Photovoltaic Glass Revenue (USD Million) By Type (2018-2022)
Table 27 South America Solar Photovoltaic Glass Revenue (USD Million) By Applications (2018-2022)
Table 28 Middle East and Africa Solar Photovoltaic Glass Revenue (USD Million) By Region (2018-2022)
Table 29 Middle East and Africa Solar Photovoltaic Glass Revenue (USD Million) By Type (2018-2022)
Table 30 Middle East and Africa Solar Photovoltaic Glass Revenue (USD Million) By Applications (2018-2022)
Table 31 Financial Analysis
Table 32 Global Solar Photovoltaic Glass Revenue (USD Million) By Type (2023-2030)
Table 33 Global Solar Photovoltaic Glass Revenue Market Share (%) By Type (2023-2030)
Table 34 Global Solar Photovoltaic Glass Revenue (USD Million) By Applications (2023-2030)
Table 35 Global Solar Photovoltaic Glass Revenue Market Share (%) By Applications (2023-2030)
Table 36 Global Solar Photovoltaic Glass Market Revenue (USD Million), And Revenue (USD Million) By Regions (2023-2030)
Table 37 North America Solar Photovoltaic Glass Revenue (USD)By Country (2023-2030)
Table 38 North America Solar Photovoltaic Glass Revenue (USD Million) By Type (2023-2030)
Table 39 North America Solar Photovoltaic Glass Revenue (USD Million) By Applications (2023-2030)
Table 40 Europe Solar Photovoltaic Glass Revenue (USD Million) By Country (2023-2030)
Table 41 Europe Solar Photovoltaic Glass Revenue (USD Million) By Type (2023-2030)
Table 42 Europe Solar Photovoltaic Glass Revenue (USD Million) By Applications (2023-2030)
Table 43 Asia Pacific Solar Photovoltaic Glass Revenue (USD Million) By Country (2023-2030)
Table 44 Asia Pacific Solar Photovoltaic Glass Revenue (USD Million) By Type (2023-2030)
Table 45 Asia Pacific Solar Photovoltaic Glass Revenue (USD Million) By Applications (2023-2030)
Table 46 South America Solar Photovoltaic Glass Revenue (USD Million) By Country (2023-2030)
Table 47 South America Solar Photovoltaic Glass Revenue (USD Million) By Type (2023-2030)
Table 48 South America Solar Photovoltaic Glass Revenue (USD Million) By Applications (2023-2030)
Table 49 Middle East and Africa Solar Photovoltaic Glass Revenue (USD Million) By Region (2023-2030)
Table 50 Middle East and Africa Solar Photovoltaic Glass Revenue (USD Million) By Region (2023-2030)
Table 51 Middle East and Africa Solar Photovoltaic Glass Revenue (USD Million) By Type (2023-2030)
Table 52 Middle East and Africa Solar Photovoltaic Glass Revenue (USD Million) By Applications (2023-2030)
Table 53 Research Programs/Design for This Report
Table 54 Key Data Information from Secondary Sources
Table 55 Key Data Information from Primary Sources
List of Figures
Figure 1 Market Scope
Figure 2 Porter’s Five Forces
Figure 3 Global Solar Photovoltaic Glass Revenue (USD Million) By Type (2018-2022)
Figure 4 Global Solar Photovoltaic Glass Revenue Market Share (%) By Type (2022)
Figure 5 Global Solar Photovoltaic Glass Revenue (USD Million) By Applications (2018-2022)
Figure 6 Global Solar Photovoltaic Glass Revenue Market Share (%) By Applications (2022)
Figure 7 Global Solar Photovoltaic Glass Market Revenue (USD Million) By Regions (2018-2022)
Figure 8 Global Solar Photovoltaic Glass Market Share (%) By Regions (2022)
Figure 9 North America Solar Photovoltaic Glass Revenue (USD Million) By Country (2018-2022)
Figure 10 North America Solar Photovoltaic Glass Revenue (USD Million) By Type (2018-2022)
Figure 11 North America Solar Photovoltaic Glass Revenue (USD Million) By Applications (2018-2022)
Figure 12 Europe Solar Photovoltaic Glass Revenue (USD Million) By Country (2018-2022)
Figure 13 Europe Solar Photovoltaic Glass Revenue (USD Million) By Type (2018-2022)
Figure 14 Europe Solar Photovoltaic Glass Revenue (USD Million) By Applications (2018-2022)
Figure 15 Asia Pacific Solar Photovoltaic Glass Revenue (USD Million) By Country (2018-2022)
Figure 16 Asia Pacific Solar Photovoltaic Glass Revenue (USD Million) By Type (2018-2022)
Figure 17 Asia Pacific Solar Photovoltaic Glass Revenue (USD Million) By Applications (2018-2022)
Figure 18 South America Solar Photovoltaic Glass Revenue (USD Million) By Country (2018-2022)
Figure 19 South America Solar Photovoltaic Glass Revenue (USD Million) By Type (2018-2022)
Figure 20 South America Solar Photovoltaic Glass Revenue (USD Million) By Applications (2018-2022)
Figure 21 Middle East and Africa Solar Photovoltaic Glass Revenue (USD Million) By Region (2018-2022)
Figure 22 Middle East and Africa Solar Photovoltaic Glass Revenue (USD Million) By Type (2018-2022)
Figure 23 Middle East and Africa Solar Photovoltaic Glass Revenue (USD Million) By Applications (2018-2022)
Figure 24 Global Solar Photovoltaic Glass Revenue (USD Million) By Type (2023-2030)
Figure 25 Global Solar Photovoltaic Glass Revenue Market Share (%) By Type (2030)
Figure 26 Global Solar Photovoltaic Glass Revenue (USD Million) By Applications (2023-2030)
Figure 27 Global Solar Photovoltaic Glass Revenue Market Share (%) By Applications (2030)
Figure 28 Global Solar Photovoltaic Glass Market Revenue (USD Million) By Regions (2023-2030)
Figure 29 North America Solar Photovoltaic Glass Revenue (USD Million) By Country (2023-2030)
Figure 30 North America Solar Photovoltaic Glass Revenue (USD Million) By Type (2023-2030)
Figure 31 North America Solar Photovoltaic Glass Revenue (USD Million) By Applications (2023-2030)
Figure 32 Europe Solar Photovoltaic Glass Revenue (USD Million) By Country (2023-2030)
Figure 33 Europe Solar Photovoltaic Glass Revenue (USD Million) By Type (2023-2030)
Figure 34 Europe Solar Photovoltaic Glass Revenue (USD Million) By Applications (2023-2030)
Figure 35 Asia Pacific Solar Photovoltaic Glass Revenue (USD Million) By Country (2023-2030)
Figure 36 Asia Pacific Solar Photovoltaic Glass Revenue (USD Million) By Type (2023-2030)
Figure 37 Asia Pacific Solar Photovoltaic Glass Revenue (USD Million) By Applications (2023-2030)
Figure 38 South America Solar Photovoltaic Glass Revenue (USD Million) By Country (2023-2030)
Figure 39 South America Solar Photovoltaic Glass Revenue (USD Million) By Type (2023-2030)
Figure 40 South America Solar Photovoltaic Glass Revenue (USD Million) By Applications (2023-2030)
Figure 41 Middle East and Africa Solar Photovoltaic Glass Revenue (USD Million) By Region (2023-2030)
Figure 42 Middle East and Africa Solar Photovoltaic Glass Revenue (USD Million) By Region (2023-2030)
Figure 43 Middle East and Africa Solar Photovoltaic Glass Revenue (USD Million) By Type (2023-2030)
Figure 44 Middle East and Africa Solar Photovoltaic Glass Revenue (USD Million) By Applications (2023-2030)
Figure 45 Bottom-Up and Top-Down Approaches for This Report
Figure 46 Data Triangulation
