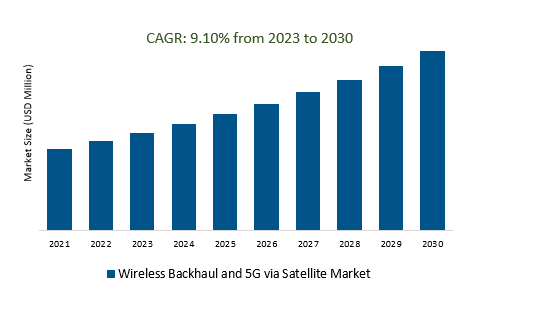
The Global Wireless Backhaul and 5G via Satellite Market Size is estimated to be US 11.5 Billion in 2023 and is poised to register 9.1% growth over the forecast period from 2023 to 2030 to reach US $ 21.2 billion in 2030.
The market growth is driven by the increasing demand for high-bandwidth services, such as video streaming, IoT applications, and online gaming, which is driving the need for robust backhaul solutions, which satellite technology can provide. Leading companies that are focused on Satellite Constellations, IoT Growth, Edge Computing, Network Densification, Aerospace and Maritime, Technological Advancements, and others to boost market shares in the industry.
Market Overview
The Wireless Backhaul and 5G via Satellite market is a growing sector that utilizes satellite technology to support 5G networks and wireless backhaul connectivity, particularly in remote and underserved areas. Key drivers include the global expansion of 5G, the need to bridge the digital divide, and the growth of IoT and edge computing. Advancements in satellite technology, including LEO satellite constellations, are enhancing the market's efficiency, although challenges like latency and cost persist. The market's future looks promising, with continued 5G expansion and technological innovation driving its growth and importance in connecting the unconnected and supporting critical applications like disaster management and aerospace communications.
Market Dynamics
Market Trends - Advancements in Satellite Technology Powering Wireless Backhaul and 5G via Satellite
Advancements in satellite technology, including High-Throughput Satellites (HTS), software-defined satellites, and Low Earth Orbit (LEO) constellations like SpaceX's Starlink and One Web, are boosting the efficiency and cost-effectiveness of Wireless Backhaul and 5G via Satellite solutions. HTS offers higher data throughput, software-defined satellites enhance flexibility, and LEO constellations reduce latency, making satellite-based backhaul crucial for expanding 5G networks and connecting remote areas efficiently.
Market Driver- Energy Sector Demand Wireless Backhaul and 5G via Satellite Market
The energy sector is driving demand for Wireless Backhaul and 5G via Satellite solutions. In remote energy facilities, such as offshore oil and gas platforms and renewable energy installations, reliable connectivity is essential for operations, safety, and data transmission. Satellite backhaul provides a dependable communication link in challenging environments, enabling real-time monitoring, control, and data transfer. As the energy sector continues to expand and modernize, the need for robust satellite-based backhaul solutions is growing, making it a key driver in this market.
Market Opportunity-Introduction of 5G Rollout
The introduction of 5G rollout is a crucial development in the Wireless Backhaul and 5G via Satellite market. It extends 5G coverage to remote areas where traditional infrastructure is impractical. Satellite technology supports emerging applications like IoT and high-bandwidth services, driving substantial market growth.
Market Share Analysis- 5G Wireless Backhaul and 5G via Satellite Market will register the fastest growth
The Global Wireless Backhaul and 5G via Satellite Market is analyzed across Cellular Backhaul, Trunking, Hybrid Networks, 5G, and others. 5G is poised to register the fastest growth. The incorporation of 5G into the Wireless Backhaul and 5G via the Satellite market is a transformative trend, extending 5G's reach to remote areas through satellite-based backhaul solutions. This integration facilitates high-speed, low-latency connectivity for emerging applications and drives market growth.
Market Share Analysis- Automobile Industry held a significant market share in 2023
The Global Wireless Backhaul and 5G via Satellite Market is analyzed across various Deployment including Electronic Products, Communication Facilities, Broadcast Media, Logistics, Automobile Industry, Aerospace, and others. Of these, the Automobile industry held a significant market share in 2023. The automobile industry is emerging as a key driver in the Wireless Backhaul and 5G via Satellite market due to the increasing need for seamless, high-speed connectivity in connected and autonomous vehicles. Satellite-based backhaul solutions play a vital role in enabling real-time navigation, vehicle-to-vehicle communication, and over-the-air updates, particularly in remote areas.
Wireless Backhaul and 5G via Satellite Market Segmentation
By Type
- Cellular Backhaul
- Trunking
- Hybrid Networks
- 5G
By Application
- Electronic Product
- Communication Facilities
- Broadcast Media
- Logistics
- Automobile Industry
- Aerospace
- Others
By Region
- North America (United States, Canada, Mexico)
- Europe (Germany, France, United Kingdom, Spain, Italy, Others)
- Asia Pacific (China, India, Japan, South Korea, Australia, Others)
- Latin America (Brazil, Argentina, Others)
- Middle East and Africa (Saudi Arabia, UAE, Kuwait, Other Middle East, South Africa, Nigeria, Other Africa)
Wireless Backhaul and 5G via Satellite Market Companies
- Eutelsat
- Huawei Technologies Co. Ltd
- Telesat
- Intelsat
- OneWeb
- SpaceX
- SES
- O3b
- LeoSat
- ViaSat
- Hispasat
- Star One
- Telenor
- Avanti Communications
- Gazprom Space Systems
- Spacecom
- ArabSat
- RSCC
- YahSat
- Starlink
- China Satcom
- AsiaSat
- Inmarsat
- Thuraya
- ABS Global
*List not exhaustive
Wireless Backhaul and 5G via Satellite Market Outlook 2023
1 Market Overview
1.1 Introduction to the Wireless Backhaul and 5G via Satellite Market
1.2 Scope of the Study
1.3 Research Objective
1.3.1 Key Market Scope and Segments
1.3.2 Players Covered
1.3.3 Years Considered
2 Executive Summary
2.1 2023 Wireless Backhaul and 5G via Satellite Industry- Market Statistics
3 Market Dynamics
3.1 Market Drivers
3.2 Market Challenges
3.3 Market Opportunities
3.4 Market Trends
4 Market Factor Analysis
4.1 Porter’s Five Forces
4.2 Market Entropy
4.2.1 Global Wireless Backhaul and 5G via Satellite Market Companies with Area Served
4.2.2 Products Offerings Global Wireless Backhaul and 5G via Satellite Market
5 COVID-19 Impact Analysis and Outlook Scenarios
5.1.1 Covid-19 Impact Analysis
5.1.2 Post-COVID-19 Scenario- Low Growth Case
5.1.3 Post-COVID-19 Scenario- Reference Growth Case
5.1.4 Post-COVID-19 Scenario- Low Growth Case
6 Global Wireless Backhaul and 5G via Satellite Market Trends
6.1 Global Wireless Backhaul and 5G via Satellite Revenue (USD Million) and CAGR (%) by Type (2018-2030)
6.2 Global Wireless Backhaul and 5G via Satellite Revenue (USD Million) and CAGR (%) by Applications (2018-2030)
6.3 Global Wireless Backhaul and 5G via Satellite Revenue (USD Million) and CAGR (%) by Regions (2018-2030)
7 Global Wireless Backhaul and 5G via Satellite Market Revenue (USD Million) by Type, and Applications (2018-2022)
7.1 Global Wireless Backhaul and 5G via Satellite Revenue (USD Million) by Type (2018-2022)
7.1.1 Global Wireless Backhaul and 5G via Satellite Revenue (USD Million), Market Share (%) by Type (2018-2022)
7.2 Global Wireless Backhaul and 5G via Satellite Revenue (USD Million) by Applications (2018-2022)
7.2.1 Global Wireless Backhaul and 5G via Satellite Revenue (USD Million), Market Share (%) by Applications (2018-2022)
8 Global Wireless Backhaul and 5G via Satellite Development Regional Status and Outlook
8.1 Global Wireless Backhaul and 5G via Satellite Revenue (USD Million) By Regions (2018-2022)
8.2 North America Wireless Backhaul and 5G via Satellite Revenue (USD Million) by Type, and Application (2018-2022)
8.2.1 North America Wireless Backhaul and 5G via Satellite Revenue (USD Million) by Country (2018-2022)
8.2.2 North America Wireless Backhaul and 5G via Satellite Revenue (USD Million) by Type (2018-2022)
8.2.3 North America Wireless Backhaul and 5G via Satellite Revenue (USD Million) by Applications (2018-2022)
8.3 Europe Wireless Backhaul and 5G via Satellite Revenue (USD Million), by Type, and Applications (USD Million) (2018-2022)
8.3.1 Europe Wireless Backhaul and 5G via Satellite Revenue (USD Million), by Country (2018-2022)
8.3.2 Europe Wireless Backhaul and 5G via Satellite Revenue (USD Million) by Type (2018-2022)
8.3.3 Europe Wireless Backhaul and 5G via Satellite Revenue (USD Million) by Applications (2018-2022)
8.4 Asia Pacific Wireless Backhaul and 5G via Satellite Revenue (USD Million), and Revenue (USD Million) by Type, and Applications (2018-2022)
8.4.1 Asia Pacific Wireless Backhaul and 5G via Satellite Revenue (USD Million) by Country (2018-2022)
8.4.2 Asia Pacific Wireless Backhaul and 5G via Satellite Revenue (USD Million) by Type (2018-2022)
8.4.3 Asia Pacific Wireless Backhaul and 5G via Satellite Revenue (USD Million) by Applications (2018-2022)
8.5 South America Wireless Backhaul and 5G via Satellite Revenue (USD Million), by Type, and Applications (2018-2022)
8.5.1 South America Wireless Backhaul and 5G via Satellite Revenue (USD Million), by Country (2018-2022)
8.5.2 South America Wireless Backhaul and 5G via Satellite Revenue (USD Million) by Type (2018-2022)
8.5.3 South America Wireless Backhaul and 5G via Satellite Revenue (USD Million) by Applications (2018-2022)
8.6 Middle East and Africa Wireless Backhaul and 5G via Satellite Revenue (USD Million), by Type, Technology, Application, Thickness (2018-2022)
8.6.1 Middle East and Africa Wireless Backhaul and 5G via Satellite Revenue (USD Million) by Country (2018-2022)
8.6.2 Middle East and Africa Wireless Backhaul and 5G via Satellite Revenue (USD Million) by Type (2018-2022)
8.6.3 Middle East and Africa Wireless Backhaul and 5G via Satellite Revenue (USD Million) by Applications (2018-2022)
9 Company Profiles
10 Global Wireless Backhaul and 5G via Satellite Market Revenue (USD Million), by Type, and Applications (2023-2030)
10.1 Global Wireless Backhaul and 5G via Satellite Revenue (USD Million) and Market Share (%) by Type (2023-2030)
10.1.1 Global Wireless Backhaul and 5G via Satellite Revenue (USD Million), and Market Share (%) by Type (2023-2030)
10.2 Global Wireless Backhaul and 5G via Satellite Revenue (USD Million) and Market Share (%) by Applications (2023-2030)
10.2.1 Global Wireless Backhaul and 5G via Satellite Revenue (USD Million), and Market Share (%) by Applications (2023-2030)
11 Global Wireless Backhaul and 5G via Satellite Development Regional Status and Outlook Forecast
11.1 Global Wireless Backhaul and 5G via Satellite Revenue (USD Million) By Regions (2023-2030)
11.2 North America Wireless Backhaul and 5G via Satellite Revenue (USD Million) by Type, and Applications (2023-2030)
11.2.1 North America Wireless Backhaul and 5G via Satellite Revenue (USD) Million by Country (2023-2030)
11.2.2 North America Wireless Backhaul and 5G via Satellite Revenue (USD Million), by Type (2023-2030)
11.2.3 North America Wireless Backhaul and 5G via Satellite Revenue (USD Million), Market Share (%) by Applications (2023-2030)
11.3 Europe Wireless Backhaul and 5G via Satellite Revenue (USD Million), by Type, and Applications (2023-2030)
11.3.1 Europe Wireless Backhaul and 5G via Satellite Revenue (USD Million), by Country (2023-2030)
11.3.2 Europe Wireless Backhaul and 5G via Satellite Revenue (USD Million), by Type (2023-2030)
11.3.3 Europe Wireless Backhaul and 5G via Satellite Revenue (USD Million), by Applications (2023-2030)
11.4 Asia Pacific Wireless Backhaul and 5G via Satellite Revenue (USD Million) by Type, and Applications (2023-2030)
11.4.1 Asia Pacific Wireless Backhaul and 5G via Satellite Revenue (USD Million), by Country (2023-2030)
11.4.2 Asia Pacific Wireless Backhaul and 5G via Satellite Revenue (USD Million), by Type (2023-2030)
11.4.3 Asia Pacific Wireless Backhaul and 5G via Satellite Revenue (USD Million), by Applications (2023-2030)
11.5 South America Wireless Backhaul and 5G via Satellite Revenue (USD Million), by Type, and Applications (2023-2030)
11.5.1 South America Wireless Backhaul and 5G via Satellite Revenue (USD Million), by Country (2023-2030)
11.5.2 South America Wireless Backhaul and 5G via Satellite Revenue (USD Million), by Type (2023-2030)
11.5.3 South America Wireless Backhaul and 5G via Satellite Revenue (USD Million), by Applications (2023-2030)
11.6 Middle East and Africa Wireless Backhaul and 5G via Satellite Revenue (USD Million), by Type, and Applications (2023-2030)
11.6.1 Middle East and Africa Wireless Backhaul and 5G via Satellite Revenue (USD Million), by Region (2023-2030)
11.6.2 Middle East and Africa Wireless Backhaul and 5G via Satellite Revenue (USD Million), by Type (2023-2030)
11.6.3 Middle East and Africa Wireless Backhaul and 5G via Satellite Revenue (USD Million), by Applications (2023-2030)
12 Methodology and Data Sources
12.1 Methodology/Research Approach
12.1.1 Research Programs/Design
12.1.2 Market Size Estimation
12.1.3 Market Breakdown and Data Triangulation
12.2 Data Sources
12.2.1 Secondary Sources
12.2.2 Primary Sources
12.3 Disclaimer
List of Tables
Table 1 Market Segmentation Analysis
Table 2 Global Wireless Backhaul and 5G via Satellite Market Companies with Areas Served
Table 3 Products Offerings Global Wireless Backhaul and 5G via Satellite Market
Table 4 Low Growth Scenario Forecasts
Table 5 Reference Case Growth Scenario
Table 6 High Growth Case Scenario
Table 7 Global Wireless Backhaul and 5G via Satellite Revenue (USD Million) And CAGR (%) By Type (2018-2030)
Table 8 Global Wireless Backhaul and 5G via Satellite Revenue (USD Million) And CAGR (%) By Applications (2018-2030)
Table 9 Global Wireless Backhaul and 5G via Satellite Revenue (USD Million) And CAGR (%) By Regions (2018-2030)
Table 10 Global Wireless Backhaul and 5G via Satellite Revenue (USD Million) By Type (2018-2022)
Table 11 Global Wireless Backhaul and 5G via Satellite Revenue Market Share (%) By Type (2018-2022)
Table 12 Global Wireless Backhaul and 5G via Satellite Revenue (USD Million) By Applications (2018-2022)
Table 13 Global Wireless Backhaul and 5G via Satellite Revenue Market Share (%) By Applications (2018-2022)
Table 14 Global Wireless Backhaul and 5G via Satellite Market Revenue (USD Million) By Regions (2018-2022)
Table 15 Global Wireless Backhaul and 5G via Satellite Market Share (%) By Regions (2018-2022)
Table 16 North America Wireless Backhaul and 5G via Satellite Revenue (USD Million) By Country (2018-2022)
Table 17 North America Wireless Backhaul and 5G via Satellite Revenue (USD Million) By Type (2018-2022)
Table 18 North America Wireless Backhaul and 5G via Satellite Revenue (USD Million) By Applications (2018-2022)
Table 19 Europe Wireless Backhaul and 5G via Satellite Revenue (USD Million) By Country (2018-2022)
Table 20 Europe Wireless Backhaul and 5G via Satellite Revenue (USD Million) By Type (2018-2022)
Table 21 Europe Wireless Backhaul and 5G via Satellite Revenue (USD Million) By Applications (2018-2022)
Table 22 Asia Pacific Wireless Backhaul and 5G via Satellite Revenue (USD Million) By Country (2018-2022)
Table 23 Asia Pacific Wireless Backhaul and 5G via Satellite Revenue (USD Million) By Type (2018-2022)
Table 24 Asia Pacific Wireless Backhaul and 5G via Satellite Revenue (USD Million) By Applications (2018-2022)
Table 25 South America Wireless Backhaul and 5G via Satellite Revenue (USD Million) By Country (2018-2022)
Table 26 South America Wireless Backhaul and 5G via Satellite Revenue (USD Million) By Type (2018-2022)
Table 27 South America Wireless Backhaul and 5G via Satellite Revenue (USD Million) By Applications (2018-2022)
Table 28 Middle East and Africa Wireless Backhaul and 5G via Satellite Revenue (USD Million) By Region (2018-2022)
Table 29 Middle East and Africa Wireless Backhaul and 5G via Satellite Revenue (USD Million) By Type (2018-2022)
Table 30 Middle East and Africa Wireless Backhaul and 5G via Satellite Revenue (USD Million) By Applications (2018-2022)
Table 31 Financial Analysis
Table 32 Global Wireless Backhaul and 5G via Satellite Revenue (USD Million) By Type (2023-2030)
Table 33 Global Wireless Backhaul and 5G via Satellite Revenue Market Share (%) By Type (2023-2030)
Table 34 Global Wireless Backhaul and 5G via Satellite Revenue (USD Million) By Applications (2023-2030)
Table 35 Global Wireless Backhaul and 5G via Satellite Revenue Market Share (%) By Applications (2023-2030)
Table 36 Global Wireless Backhaul and 5G via Satellite Market Revenue (USD Million), And Revenue (USD Million) By Regions (2023-2030)
Table 37 North America Wireless Backhaul and 5G via Satellite Revenue (USD)By Country (2023-2030)
Table 38 North America Wireless Backhaul and 5G via Satellite Revenue (USD Million) By Type (2023-2030)
Table 39 North America Wireless Backhaul and 5G via Satellite Revenue (USD Million) By Applications (2023-2030)
Table 40 Europe Wireless Backhaul and 5G via Satellite Revenue (USD Million) By Country (2023-2030)
Table 41 Europe Wireless Backhaul and 5G via Satellite Revenue (USD Million) By Type (2023-2030)
Table 42 Europe Wireless Backhaul and 5G via Satellite Revenue (USD Million) By Applications (2023-2030)
Table 43 Asia Pacific Wireless Backhaul and 5G via Satellite Revenue (USD Million) By Country (2023-2030)
Table 44 Asia Pacific Wireless Backhaul and 5G via Satellite Revenue (USD Million) By Type (2023-2030)
Table 45 Asia Pacific Wireless Backhaul and 5G via Satellite Revenue (USD Million) By Applications (2023-2030)
Table 46 South America Wireless Backhaul and 5G via Satellite Revenue (USD Million) By Country (2023-2030)
Table 47 South America Wireless Backhaul and 5G via Satellite Revenue (USD Million) By Type (2023-2030)
Table 48 South America Wireless Backhaul and 5G via Satellite Revenue (USD Million) By Applications (2023-2030)
Table 49 Middle East and Africa Wireless Backhaul and 5G via Satellite Revenue (USD Million) By Region (2023-2030)
Table 50 Middle East and Africa Wireless Backhaul and 5G via Satellite Revenue (USD Million) By Region (2023-2030)
Table 51 Middle East and Africa Wireless Backhaul and 5G via Satellite Revenue (USD Million) By Type (2023-2030)
Table 52 Middle East and Africa Wireless Backhaul and 5G via Satellite Revenue (USD Million) By Applications (2023-2030)
Table 53 Research Programs/Design for This Report
Table 54 Key Data Information from Secondary Sources
Table 55 Key Data Information from Primary Sources
List of Figures
Figure 1 Market Scope
Figure 2 Porter’s Five Forces
Figure 3 Global Wireless Backhaul and 5G via Satellite Revenue (USD Million) By Type (2018-2022)
Figure 4 Global Wireless Backhaul and 5G via Satellite Revenue Market Share (%) By Type (2022)
Figure 5 Global Wireless Backhaul and 5G via Satellite Revenue (USD Million) By Applications (2018-2022)
Figure 6 Global Wireless Backhaul and 5G via Satellite Revenue Market Share (%) By Applications (2022)
Figure 7 Global Wireless Backhaul and 5G via Satellite Market Revenue (USD Million) By Regions (2018-2022)
Figure 8 Global Wireless Backhaul and 5G via Satellite Market Share (%) By Regions (2022)
Figure 9 North America Wireless Backhaul and 5G via Satellite Revenue (USD Million) By Country (2018-2022)
Figure 10 North America Wireless Backhaul and 5G via Satellite Revenue (USD Million) By Type (2018-2022)
Figure 11 North America Wireless Backhaul and 5G via Satellite Revenue (USD Million) By Applications (2018-2022)
Figure 12 Europe Wireless Backhaul and 5G via Satellite Revenue (USD Million) By Country (2018-2022)
Figure 13 Europe Wireless Backhaul and 5G via Satellite Revenue (USD Million) By Type (2018-2022)
Figure 14 Europe Wireless Backhaul and 5G via Satellite Revenue (USD Million) By Applications (2018-2022)
Figure 15 Asia Pacific Wireless Backhaul and 5G via Satellite Revenue (USD Million) By Country (2018-2022)
Figure 16 Asia Pacific Wireless Backhaul and 5G via Satellite Revenue (USD Million) By Type (2018-2022)
Figure 17 Asia Pacific Wireless Backhaul and 5G via Satellite Revenue (USD Million) By Applications (2018-2022)
Figure 18 South America Wireless Backhaul and 5G via Satellite Revenue (USD Million) By Country (2018-2022)
Figure 19 South America Wireless Backhaul and 5G via Satellite Revenue (USD Million) By Type (2018-2022)
Figure 20 South America Wireless Backhaul and 5G via Satellite Revenue (USD Million) By Applications (2018-2022)
Figure 21 Middle East and Africa Wireless Backhaul and 5G via Satellite Revenue (USD Million) By Region (2018-2022)
Figure 22 Middle East and Africa Wireless Backhaul and 5G via Satellite Revenue (USD Million) By Type (2018-2022)
Figure 23 Middle East and Africa Wireless Backhaul and 5G via Satellite Revenue (USD Million) By Applications (2018-2022)
Figure 24 Global Wireless Backhaul and 5G via Satellite Revenue (USD Million) By Type (2023-2030)
Figure 25 Global Wireless Backhaul and 5G via Satellite Revenue Market Share (%) By Type (2030)
Figure 26 Global Wireless Backhaul and 5G via Satellite Revenue (USD Million) By Applications (2023-2030)
Figure 27 Global Wireless Backhaul and 5G via Satellite Revenue Market Share (%) By Applications (2030)
Figure 28 Global Wireless Backhaul and 5G via Satellite Market Revenue (USD Million) By Regions (2023-2030)
Figure 29 North America Wireless Backhaul and 5G via Satellite Revenue (USD Million) By Country (2023-2030)
Figure 30 North America Wireless Backhaul and 5G via Satellite Revenue (USD Million) By Type (2023-2030)
Figure 31 North America Wireless Backhaul and 5G via Satellite Revenue (USD Million) By Applications (2023-2030)
Figure 32 Europe Wireless Backhaul and 5G via Satellite Revenue (USD Million) By Country (2023-2030)
Figure 33 Europe Wireless Backhaul and 5G via Satellite Revenue (USD Million) By Type (2023-2030)
Figure 34 Europe Wireless Backhaul and 5G via Satellite Revenue (USD Million) By Applications (2023-2030)
Figure 35 Asia Pacific Wireless Backhaul and 5G via Satellite Revenue (USD Million) By Country (2023-2030)
Figure 36 Asia Pacific Wireless Backhaul and 5G via Satellite Revenue (USD Million) By Type (2023-2030)
Figure 37 Asia Pacific Wireless Backhaul and 5G via Satellite Revenue (USD Million) By Applications (2023-2030)
Figure 38 South America Wireless Backhaul and 5G via Satellite Revenue (USD Million) By Country (2023-2030)
Figure 39 South America Wireless Backhaul and 5G via Satellite Revenue (USD Million) By Type (2023-2030)
Figure 40 South America Wireless Backhaul and 5G via Satellite Revenue (USD Million) By Applications (2023-2030)
Figure 41 Middle East and Africa Wireless Backhaul and 5G via Satellite Revenue (USD Million) By Region (2023-2030)
Figure 42 Middle East and Africa Wireless Backhaul and 5G via Satellite Revenue (USD Million) By Region (2023-2030)
Figure 43 Middle East and Africa Wireless Backhaul and 5G via Satellite Revenue (USD Million) By Type (2023-2030)
Figure 44 Middle East and Africa Wireless Backhaul and 5G via Satellite Revenue (USD Million) By Applications (2023-2030)
Figure 45 Bottom-Up and Top-Down Approaches For This Report
Figure 46 Data Triangulation
