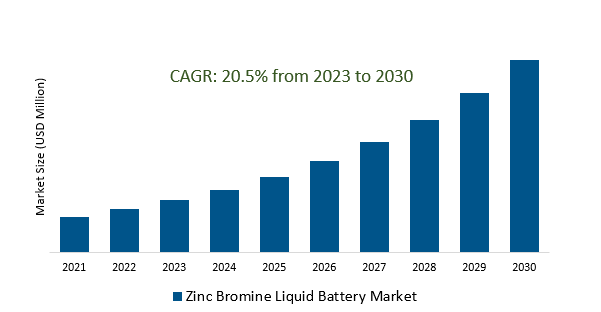
The Zinc Bromide Liquid Battery Size is estimated to register 20.5% growth over the forecast period from 2023 to 2030.
Zinc Bromide Liquid Battery Market Overview
With the rising need for grid stability and reliability, especially during peak demand periods, there's a growing requirement for energy storage solutions, driving the market demand. The increasing adoption of renewable energy sources, such as solar and wind power fuels the demand. Ongoing research and development in energy storage technologies are leading to improvements in zinc bromide batteries, making them more efficient, longer-lasting, and safer. As economies of scale are achieved, the cost per unit decreases, making these batteries more economically viable for various applications. The growing adoption of electric vehicles is creating a need for long-duration energy storage solutions to support the charging infrastructure, thereby driving the market growth.
Zinc Bromide Liquid Battery Market Dynamics
Market Trends- The increasing embrace of electric vehicles is driving the potential adoption of zinc bromide liquid batteries.
The quest for better-performing batteries, with higher energy density and longer lifespan, drives interest in alternative battery chemistries like zinc bromide. Further, their potential for scalability, safety, and energy efficiency are driving the market growth.
EV manufacturers are continuously striving to increase the driving range of electric vehicles on a single charge while also aiming for faster charging times. Market is also fuelled by the desire for cleaner and more sustainable transportation options.
Continual advancements in battery technology, rigorous testing, technological breakthroughs, regulatory support, cost-effectiveness, and the ability to meet the demanding requirements of the automotive industry are influencing the market.
Market Driver- Surging demand for energy storage solutions drives the market growth.
The increasing integration of renewable energy sources, such as solar and wind power, requires effective energy storage solutions to manage fluctuations in power generation are the major factors.
Advancements in energy storage technologies are propelling the development of zinc bromide batteries, enhancing their efficiency, safety, and overall performance.
Furthermore, the expanding industrial and commercial applications, including their use in microgrids, backup power systems, and remote areas where a stable energy supply is crucial, are further fueling the demand for these batteries.
Market Opportunity- Environmental consciousness and sustainability considerations significantly raising the revenue.
Growing emphasis on developing eco-friendly and recyclable battery technologies, aligning with the broader societal shift towards sustainability are driving the market demand.
Additionally, Companies are investing in research and development to enhance the sustainability profile of these batteries, seeking to minimize their ecological footprint throughout their lifecycle.
Additionally, regulatory pressures and governmental policies aimed at reducing carbon footprints and promoting cleaner energy sources are leading to increased interest in energy storage solutions that are environmentally sustainable.
Market Share Analysis- 80mA/cm2 will register the fastest growth.
The Zinc Bromide Liquid Battery Market is analyzed across 50mA/cm2, 80mA/cm2, 160mA/cm2 & Others. 80mA/cm2 is poised to register the fastest growth. The current density of 80mA/cm2 represents a crucial parameter that significantly influences battery performance and efficiency. Current density refers to the amount of electric current passing through a given area of the battery's electrodes. Market growth is due to its role in determining the battery's operational characteristics, such as efficiency, power output, and overall performance. Innovations in this domain aim to maximize the battery's efficiency at this specific current density, potentially leading to more reliable and high-performance energy storage solutions. Researchers and manufacturers are focusing on this particular current density to enhance battery performance, seeking to achieve higher power output without significantly compromising the battery's durability or inducing excessive heat generation.
Market Share Analysis- New Energy Storage held a significant market share in 2023
The Zinc Bromide Liquid Battery Market is analyzed across various applications including Power Station, New Energy Storage, Industry & Others. Of these, New Energy Storage held a significant market share in 2023. These batteries are increasingly explored for their potential in facilitating the integration of renewable energy sources such as solar and wind power into the grid. In this context, zinc bromide batteries serve as an efficient means to store excess energy generated during peak production periods, allowing for its utilization when demand is high or when renewable sources are not actively generating electricity. The focus on new energy storage solutions stems from the growing need for grid stabilization and management of intermittent renewable energy sources. These batteries offer scalability and the ability to store substantial amounts of energy, making them suitable for utility-scale applications.
Zinc Bromide Liquid Battery Market Segmentation
By Type
- 50mA/cm2
- 80mA/cm2
- 160mA/cm2
- Others
By Application
- Power Station
- New Energy Storage
- Industry
- Others
By Region
- North America (United States, Canada, Mexico)
- Europe (Germany, France, United Kingdom, Spain, Italy, Others)
- Asia Pacific (China, India, Japan, South Korea, Australia, Others)
- Latin America (Brazil, Argentina, Others)
- Middle East and Africa (Saudi Arabia, UAE, Kuwait, Other Middle East, South Africa, Nigeria, Other Africa)
Zinc Bromide Liquid Battery Market Companies
- Dalian Rongke Power
- Sumitomo Electric
- Primus Power
- UniEnergy Technologies
- EnSync
- Imergy
- EnerVault
- redTENERGY Storage
- Gildemeister
*List not exhaustive
Zinc Bromine Liquid Battery Market Outlook 2023
1 Market Overview
1.1 Introduction to the Zinc Bromine Liquid Battery Market
1.2 Scope of the Study
1.3 Research Objective
1.3.1 Key Market Scope and Segments
1.3.2 Players Covered
1.3.3 Years Considered
2 Executive Summary
2.1 2023 Zinc Bromine Liquid Battery Industry- Market Statistics
3 Market Dynamics
3.1 Market Drivers
3.2 Market Challenges
3.3 Market Opportunities
3.4 Market Trends
4 Market Factor Analysis
4.1 Porter’s Five Forces
4.2 Market Entropy
4.2.1 Global Zinc Bromine Liquid Battery Market Companies with Area Served
4.2.2 Products Offerings Global Zinc Bromine Liquid Battery Market
5 COVID-19 Impact Analysis and Outlook Scenarios
5.1.1 Covid-19 Impact Analysis
5.1.2 post-COVID-19 Scenario- Low Growth Case
5.1.3 post-COVID-19 Scenario- Reference Growth Case
5.1.4 post-COVID-19 Scenario- Low Growth Case
6 Global Zinc Bromine Liquid Battery Market Trends
6.1 Global Zinc Bromine Liquid Battery Revenue (USD Million) and CAGR (%) by Type (2018-2030)
6.2 Global Zinc Bromine Liquid Battery Revenue (USD Million) and CAGR (%) by Applications (2018-2030)
6.3 Global Zinc Bromine Liquid Battery Revenue (USD Million) and CAGR (%) by regions (2018-2030)
7 Global Zinc Bromine Liquid Battery Market Revenue (USD Million) by Type, and Applications (2018-2022)
7.1 Global Zinc Bromine Liquid Battery Revenue (USD Million) by Type (2018-2022)
7.1.1 Global Zinc Bromine Liquid Battery Revenue (USD Million), Market Share (%) by Type (2018-2022)
7.2 Global Zinc Bromine Liquid Battery Revenue (USD Million) by Applications (2018-2022)
7.2.1 Global Zinc Bromine Liquid Battery Revenue (USD Million), Market Share (%) by Applications (2018-2022)
8 Global Zinc Bromine Liquid Battery Development Regional Status and Outlook
8.1 Global Zinc Bromine Liquid Battery Revenue (USD Million) By Regions (2018-2022)
8.2 North America Zinc Bromine Liquid Battery Revenue (USD Million) by Type, and Application (2018-2022)
8.2.1 North America Zinc Bromine Liquid Battery Revenue (USD Million) by Country (2018-2022)
8.2.2 North America Zinc Bromine Liquid Battery Revenue (USD Million) by Type (2018-2022)
8.2.3 North America Zinc Bromine Liquid Battery Revenue (USD Million) by Applications (2018-2022)
8.3 Europe Zinc Bromine Liquid Battery Revenue (USD Million), by Type, and Applications (USD Million) (2018-2022)
8.3.1 Europe Zinc Bromine Liquid Battery Revenue (USD Million), by Country (2018-2022)
8.3.2 Europe Zinc Bromine Liquid Battery Revenue (USD Million) by Type (2018-2022)
8.3.3 Europe Zinc Bromine Liquid Battery Revenue (USD Million) by Applications (2018-2022)
8.4 Asia Pacific Zinc Bromine Liquid Battery Revenue (USD Million), and Revenue (USD Million) by Type, and Applications (2018-2022)
8.4.1 Asia Pacific Zinc Bromine Liquid Battery Revenue (USD Million) by Country (2018-2022)
8.4.2 Asia Pacific Zinc Bromine Liquid Battery Revenue (USD Million) by Type (2018-2022)
8.4.3 Asia Pacific Zinc Bromine Liquid Battery Revenue (USD Million) by Applications (2018-2022)
8.5 South America Zinc Bromine Liquid Battery Revenue (USD Million), by Type, and Applications (2018-2022)
8.5.1 South America Zinc Bromine Liquid Battery Revenue (USD Million), by Country (2018-2022)
8.5.2 South America Zinc Bromine Liquid Battery Revenue (USD Million) by Type (2018-2022)
8.5.3 South America Zinc Bromine Liquid Battery Revenue (USD Million) by Applications (2018-2022)
8.6 Middle East and Africa Zinc Bromine Liquid Battery Revenue (USD Million), by Type, Technology, Application, Thickness (2018-2022)
8.6.1 Middle East and Africa Zinc Bromine Liquid Battery Revenue (USD Million) by Country (2018-2022)
8.6.2 Middle East and Africa Zinc Bromine Liquid Battery Revenue (USD Million) by Type (2018-2022)
8.6.3 Middle East and Africa Zinc Bromine Liquid Battery Revenue (USD Million) by Applications (2018-2022)
9 Company Profiles
10 Global Zinc Bromine Liquid Battery Market Revenue (USD Million), by Type, and Applications (2023-2030)
10.1 Global Zinc Bromine Liquid Battery Revenue (USD Million) and Market Share (%) by Type (2023-2030)
10.1.1 Global Zinc Bromine Liquid Battery Revenue (USD Million), and Market Share (%) by Type (2023-2030)
10.2 Global Zinc Bromine Liquid Battery Revenue (USD Million) and Market Share (%) by Applications (2023-2030)
10.2.1 Global Zinc Bromine Liquid Battery Revenue (USD Million), and Market Share (%) by Applications (2023-2030)
11 Global Zinc Bromine Liquid Battery Development Regional Status and Outlook Forecast
11.1 Global Zinc Bromine Liquid Battery Revenue (USD Million) By Regions (2023-2030)
11.2 North America Zinc Bromine Liquid Battery Revenue (USD Million) by Type, and Applications (2023-2030)
11.2.1 North America Zinc Bromine Liquid Battery Revenue (USD) Million by Country (2023-2030)
11.2.2 North America Zinc Bromine Liquid Battery Revenue (USD Million), by Type (2023-2030)
11.2.3 North America Zinc Bromine Liquid Battery Revenue (USD Million), Market Share (%) by Applications (2023-2030)
11.3 Europe Zinc Bromine Liquid Battery Revenue (USD Million), by Type, and Applications (2023-2030)
11.3.1 Europe Zinc Bromine Liquid Battery Revenue (USD Million), by Country (2023-2030)
11.3.2 Europe Zinc Bromine Liquid Battery Revenue (USD Million), by Type (2023-2030)
11.3.3 Europe Zinc Bromine Liquid Battery Revenue (USD Million), by Applications (2023-2030)
11.4 Asia Pacific Zinc Bromine Liquid Battery Revenue (USD Million) by Type, and Applications (2023-2030)
11.4.1 Asia Pacific Zinc Bromine Liquid Battery Revenue (USD Million), by Country (2023-2030)
11.4.2 Asia Pacific Zinc Bromine Liquid Battery Revenue (USD Million), by Type (2023-2030)
11.4.3 Asia Pacific Zinc Bromine Liquid Battery Revenue (USD Million), by Applications (2023-2030)
11.5 South America Zinc Bromine Liquid Battery Revenue (USD Million), by Type, and Applications (2023-2030)
11.5.1 South America Zinc Bromine Liquid Battery Revenue (USD Million), by Country (2023-2030)
11.5.2 South America Zinc Bromine Liquid Battery Revenue (USD Million), by Type (2023-2030)
11.5.3 South America Zinc Bromine Liquid Battery Revenue (USD Million), by Applications (2023-2030)
11.6 Middle East and Africa Zinc Bromine Liquid Battery Revenue (USD Million), by Type, and Applications (2023-2030)
11.6.1 Middle East and Africa Zinc Bromine Liquid Battery Revenue (USD Million), by region (2023-2030)
11.6.2 Middle East and Africa Zinc Bromine Liquid Battery Revenue (USD Million), by Type (2023-2030)
11.6.3 Middle East and Africa Zinc Bromine Liquid Battery Revenue (USD Million), by Applications (2023-2030)
12 Methodology and Data Sources
12.1 Methodology/Research Approach
12.1.1 Research Programs/Design
12.1.2 Market Size Estimation
12.1.3 Market Breakdown and Data Triangulation
12.2 Data Sources
12.2.1 Secondary Sources
12.2.2 Primary Sources
12.3 Disclaimer
List of Tables
Table 1 Market Segmentation Analysis
Table 2 Global Zinc Bromine Liquid Battery Market Companies with Areas Served
Table 3 Products Offerings Global Zinc Bromine Liquid Battery Market
Table 4 Low Growth Scenario Forecasts
Table 5 Reference Case Growth Scenario
Table 6 High Growth Case Scenario
Table 7 Global Zinc Bromine Liquid Battery Revenue (USD Million) And CAGR (%) By Type (2018-2030)
Table 8 Global Zinc Bromine Liquid Battery Revenue (USD Million) And CAGR (%) By Applications (2018-2030)
Table 9 Global Zinc Bromine Liquid Battery Revenue (USD Million) And CAGR (%) By Regions (2018-2030)
Table 10 Global Zinc Bromine Liquid Battery Revenue (USD Million) By Type (2018-2022)
Table 11 Global Zinc Bromine Liquid Battery Revenue Market Share (%) By Type (2018-2022)
Table 12 Global Zinc Bromine Liquid Battery Revenue (USD Million) By Applications (2018-2022)
Table 13 Global Zinc Bromine Liquid Battery Revenue Market Share (%) By Applications (2018-2022)
Table 14 Global Zinc Bromine Liquid Battery Market Revenue (USD Million) By Regions (2018-2022)
Table 15 Global Zinc Bromine Liquid Battery Market Share (%) By Regions (2018-2022)
Table 16 North America Zinc Bromine Liquid Battery Revenue (USD Million) By Country (2018-2022)
Table 17 North America Zinc Bromine Liquid Battery Revenue (USD Million) By Type (2018-2022)
Table 18 North America Zinc Bromine Liquid Battery Revenue (USD Million) By Applications (2018-2022)
Table 19 Europe Zinc Bromine Liquid Battery Revenue (USD Million) By Country (2018-2022)
Table 20 Europe Zinc Bromine Liquid Battery Revenue (USD Million) By Type (2018-2022)
Table 21 Europe Zinc Bromine Liquid Battery Revenue (USD Million) By Applications (2018-2022)
Table 22 Asia Pacific Zinc Bromine Liquid Battery Revenue (USD Million) By Country (2018-2022)
Table 23 Asia Pacific Zinc Bromine Liquid Battery Revenue (USD Million) By Type (2018-2022)
Table 24 Asia Pacific Zinc Bromine Liquid Battery Revenue (USD Million) By Applications (2018-2022)
Table 25 South America Zinc Bromine Liquid Battery Revenue (USD Million) By Country (2018-2022)
Table 26 South America Zinc Bromine Liquid Battery Revenue (USD Million) By Type (2018-2022)
Table 27 South America Zinc Bromine Liquid Battery Revenue (USD Million) By Applications (2018-2022)
Table 28 Middle East and Africa Zinc Bromine Liquid Battery Revenue (USD Million) By Region (2018-2022)
Table 29 Middle East and Africa Zinc Bromine Liquid Battery Revenue (USD Million) By Type (2018-2022)
Table 30 Middle East and Africa Zinc Bromine Liquid Battery Revenue (USD Million) By Applications (2018-2022)
Table 31 Financial Analysis
Table 32 Global Zinc Bromine Liquid Battery Revenue (USD Million) By Type (2023-2030)
Table 33 Global Zinc Bromine Liquid Battery Revenue Market Share (%) By Type (2023-2030)
Table 34 Global Zinc Bromine Liquid Battery Revenue (USD Million) By Applications (2023-2030)
Table 35 Global Zinc Bromine Liquid Battery Revenue Market Share (%) By Applications (2023-2030)
Table 36 Global Zinc Bromine Liquid Battery Market Revenue (USD Million), And Revenue (USD Million) By Regions (2023-2030)
Table 37 North America Zinc Bromine Liquid Battery Revenue (USD)By Country (2023-2030)
Table 38 North America Zinc Bromine Liquid Battery Revenue (USD Million) By Type (2023-2030)
Table 39 North America Zinc Bromine Liquid Battery Revenue (USD Million) By Applications (2023-2030)
Table 40 Europe Zinc Bromine Liquid Battery Revenue (USD Million) By Country (2023-2030)
Table 41 Europe Zinc Bromine Liquid Battery Revenue (USD Million) By Type (2023-2030)
Table 42 Europe Zinc Bromine Liquid Battery Revenue (USD Million) By Applications (2023-2030)
Table 43 Asia Pacific Zinc Bromine Liquid Battery Revenue (USD Million) By Country (2023-2030)
Table 44 Asia Pacific Zinc Bromine Liquid Battery Revenue (USD Million) By Type (2023-2030)
Table 45 Asia Pacific Zinc Bromine Liquid Battery Revenue (USD Million) By Applications (2023-2030)
Table 46 South America Zinc Bromine Liquid Battery Revenue (USD Million) By Country (2023-2030)
Table 47 South America Zinc Bromine Liquid Battery Revenue (USD Million) By Type (2023-2030)
Table 48 South America Zinc Bromine Liquid Battery Revenue (USD Million) By Applications (2023-2030)
Table 49 Middle East and Africa Zinc Bromine Liquid Battery Revenue (USD Million) By Region (2023-2030)
Table 50 Middle East and Africa Zinc Bromine Liquid Battery Revenue (USD Million) By Region (2023-2030)
Table 51 Middle East and Africa Zinc Bromine Liquid Battery Revenue (USD Million) By Type (2023-2030)
Table 52 Middle East and Africa Zinc Bromine Liquid Battery Revenue (USD Million) By Applications (2023-2030)
Table 53 Research Programs/Design for This Report
Table 54 Key Data Information from Secondary Sources
Table 55 Key Data Information from Primary Sources
List of Figures
Figure 1 Market Scope
Figure 2 Porter’s Five Forces
Figure 3 Global Zinc Bromine Liquid Battery Revenue (USD Million) By Type (2018-2022)
Figure 4 Global Zinc Bromine Liquid Battery Revenue Market Share (%) By Type (2022)
Figure 5 Global Zinc Bromine Liquid Battery Revenue (USD Million) By Applications (2018-2022)
Figure 6 Global Zinc Bromine Liquid Battery Revenue Market Share (%) By Applications (2022)
Figure 7 Global Zinc Bromine Liquid Battery Market Revenue (USD Million) By Regions (2018-2022)
Figure 8 Global Zinc Bromine Liquid Battery Market Share (%) By Regions (2022)
Figure 9 North America Zinc Bromine Liquid Battery Revenue (USD Million) By Country (2018-2022)
Figure 10 North America Zinc Bromine Liquid Battery Revenue (USD Million) By Type (2018-2022)
Figure 11 North America Zinc Bromine Liquid Battery Revenue (USD Million) By Applications (2018-2022)
Figure 12 Europe Zinc Bromine Liquid Battery Revenue (USD Million) By Country (2018-2022)
Figure 13 Europe Zinc Bromine Liquid Battery Revenue (USD Million) By Type (2018-2022)
Figure 14 Europe Zinc Bromine Liquid Battery Revenue (USD Million) By Applications (2018-2022)
Figure 15 Asia Pacific Zinc Bromine Liquid Battery Revenue (USD Million) By Country (2018-2022)
Figure 16 Asia Pacific Zinc Bromine Liquid Battery Revenue (USD Million) By Type (2018-2022)
Figure 17 Asia Pacific Zinc Bromine Liquid Battery Revenue (USD Million) By Applications (2018-2022)
Figure 18 South America Zinc Bromine Liquid Battery Revenue (USD Million) By Country (2018-2022)
Figure 19 South America Zinc Bromine Liquid Battery Revenue (USD Million) By Type (2018-2022)
Figure 20 South America Zinc Bromine Liquid Battery Revenue (USD Million) By Applications (2018-2022)
Figure 21 Middle East and Africa Zinc Bromine Liquid Battery Revenue (USD Million) By Region (2018-2022)
Figure 22 Middle East and Africa Zinc Bromine Liquid Battery Revenue (USD Million) By Type (2018-2022)
Figure 23 Middle East and Africa Zinc Bromine Liquid Battery Revenue (USD Million) By Applications (2018-2022)
Figure 24 Global Zinc Bromine Liquid Battery Revenue (USD Million) By Type (2023-2030)
Figure 25 Global Zinc Bromine Liquid Battery Revenue Market Share (%) By Type (2030)
Figure 26 Global Zinc Bromine Liquid Battery Revenue (USD Million) By Applications (2023-2030)
Figure 27 Global Zinc Bromine Liquid Battery Revenue Market Share (%) By Applications (2030)
Figure 28 Global Zinc Bromine Liquid Battery Market Revenue (USD Million) By Regions (2023-2030)
Figure 29 North America Zinc Bromine Liquid Battery Revenue (USD Million) By Country (2023-2030)
Figure 30 North America Zinc Bromine Liquid Battery Revenue (USD Million) By Type (2023-2030)
Figure 31 North America Zinc Bromine Liquid Battery Revenue (USD Million) By Applications (2023-2030)
Figure 32 Europe Zinc Bromine Liquid Battery Revenue (USD Million) By Country (2023-2030)
Figure 33 Europe Zinc Bromine Liquid Battery Revenue (USD Million) By Type (2023-2030)
Figure 34 Europe Zinc Bromine Liquid Battery Revenue (USD Million) By Applications (2023-2030)
Figure 35 Asia Pacific Zinc Bromine Liquid Battery Revenue (USD Million) By Country (2023-2030)
Figure 36 Asia Pacific Zinc Bromine Liquid Battery Revenue (USD Million) By Type (2023-2030)
Figure 37 Asia Pacific Zinc Bromine Liquid Battery Revenue (USD Million) By Applications (2023-2030)
Figure 38 South America Zinc Bromine Liquid Battery Revenue (USD Million) By Country (2023-2030)
Figure 39 South America Zinc Bromine Liquid Battery Revenue (USD Million) By Type (2023-2030)
Figure 40 South America Zinc Bromine Liquid Battery Revenue (USD Million) By Applications (2023-2030)
Figure 41 Middle East and Africa Zinc Bromine Liquid Battery Revenue (USD Million) By Region (2023-2030)
Figure 42 Middle East and Africa Zinc Bromine Liquid Battery Revenue (USD Million) By Region (2023-2030)
Figure 43 Middle East and Africa Zinc Bromine Liquid Battery Revenue (USD Million) By Type (2023-2030)
Figure 44 Middle East and Africa Zinc Bromine Liquid Battery Revenue (USD Million) By Applications (2023-2030)
Figure 45 Bottom-Up and Top-Down Approaches for This Report
Figure 46 Data Triangulation
