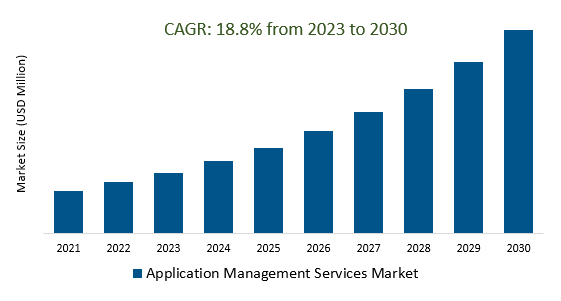
The Global Application Management Services Market Size is estimated to register 18.8% growth over the forecast period from 2023 to 2030.
The market growth is driven by an increasing complexity of application ecosystems, including legacy systems and third-party integrations, which require specialized expertise for management. Leading Companies focusing on Digital Transformation, Cloud-Native, and Hybrid Environments, Edge Computing, Cybersecurity and Compliance, Remote Work and Remote Application Management, and others to boost market shares in the industry.
Market Overview
The Application Management Services (AMS) market, characterized by the management, maintenance, and optimization of software applications, has experienced substantial growth driven by cloud migration, automation, cybersecurity focus, and customer experience enhancement. Key players included IT giants and specialized providers, serving various industry verticals. Challenges included data compliance and talent shortages. The future was expected to see further advancements, cloud adoption, application modernization, and data analytics driving the AMS market's evolution.
Market Dynamics
Market Trends- Disaster recovery and business continuity are essential for application management services because they help to ensure that applications are available and accessible to users even in the event of a disaster or disruption.
Disaster recovery and business continuity are integral components within the Application Management Services (AMS) market, as they are critical in safeguarding the availability and accessibility of applications, even in the face of unforeseen disruptions or disasters. In this context, disaster recovery strategies involve creating redundant systems and data backups, enabling a seamless switch to alternate infrastructure in case of system failures or natural calamities. Business continuity planning extends beyond this, focusing on maintaining core business operations during disruptions and making sure that applications are available to support essential functions.
Market Driver- The adoption of DevOps and agile practices is increasing the demand for application management services, as organizations seek to improve the efficiency, agility, and quality of their application development and management processes
The Application Management Services (AMS) market is experiencing a notable uptick in demand due to the rising adoption of DevOps and agile practices by organizations. These practices, which emphasize collaborative and continuous development and deployment, are driving a need for more efficient and agile application management. AMS providers play a critical role in aligning these methodologies with application lifecycles, facilitating faster development cycles, automated testing, and continuous integration, ultimately improving the overall efficiency, agility, and quality of application development and management.
Market Opportunity- Cloud migration and adoption are driving demand for application management services, as organizations seek to reduce costs, improve scalability, and accelerate innovation.
The Application Management Services (AMS) market is witnessing increased demand due to the widespread adoption of cloud migration and services, driven by organizations aiming to cut costs, enhance scalability, and accelerate innovation by effectively managing applications in the cloud. AMS providers play a crucial role in ensuring seamless integration, performance optimization, and compliance in this evolving cloud landscape, enabling greater flexibility and competitiveness in the era of digital transformation and cloud-native architectures.
Market Share Analysis- Modernization Application Management Services Market will register the fastest growth
The Global Application Management Services Market is analyzed across System Integration, Support and maintenance, Database Management, Consulting, Modernization, and others. Modernization is poised to register the fastest growth. The Modernization Application Management Services (AMS) market revolves around the upgrading and optimization of software applications to align with current technology and business requirements. It includes services that aid in modernizing legacy applications, migrating to newer platforms, and enhancing application performance. The market is poised for growth as organizations increasingly seek to stay competitive and leverage modernized applications to meet evolving technological demands.
Market Share Analysis- Cloud held a significant market share in 2023
The Global Application Management Services Market is analyzed across various Deployments including On-premise, Cloud, and others. Of these, Cloud held a significant market share in 2023. The Cloud Management Services Market involves services for the efficient oversight, security, and optimization of cloud computing resources and environments. These services, including migration, security, cost control, and performance monitoring, are crucial in assisting businesses in harnessing the full potential of cloud technologies while ensuring security, cost-effectiveness, and scalability in their cloud operations.
Application Management Services Market Segmentation
By Type
- System Integration
- Support & Maintenance
- Database Management
- Consulting
- Modernization
- Others
By Deployment
By Application
- BFSI
- Healthcare
- IT and Telecom
- Retail
- Public Sector
- Others
By Region
- North America (United States, Canada, Mexico)
- Europe (Germany, France, United Kingdom, Spain, Italy, Others)
- Asia Pacific (China, India, Japan, South Korea, Australia, Others)
- Latin America (Brazil, Argentina, Others)
- Middle East and Africa (Saudi Arabia, UAE, Kuwait, Other Middle East, South Africa, Nigeria, Other Africa)
Application Management Services Market Companies
- Accenture plc
- Cognizant Technology Solutions Corp
- IBM Corp
- Deloitte Touche Tohmatsu Ltd
- Capgemini Group S.A.
- Tata Consultancy Services Ltd
- Atos SE
- Computer Science Corp
- Infosys Ltd
- NTT Data Corp
- Mahindra Systems
- Wipro Ltd
- L&T Infotech
*List not exhaustive
Application Management Services Market Outlook 2023
1 Market Overview
1.1 Introduction to the Application Management Services Market
1.2 Scope of the Study
1.3 Research Objective
1.3.1 Key Market Scope and Segments
1.3.2 Players Covered
1.3.3 Years Considered
2 Executive Summary
2.1 2023 Application Management Services Industry- Market Statistics
3 Market Dynamics
3.1 Market Drivers
3.2 Market Challenges
3.3 Market Opportunities
3.4 Market Trends
4 Market Factor Analysis
4.1 Porter’s Five Forces
4.2 Market Entropy
4.2.1 Global Application Management Services Market Companies with Area Served
4.2.2 Products Offerings Global Application Management Services Market
5 COVID-19 Impact Analysis and Outlook Scenarios
5.1.1 Covid-19 Impact Analysis
5.1.2 post-COVID-19 Scenario- Low Growth Case
5.1.3 post-COVID-19 Scenario- Reference Growth Case
5.1.4 post-COVID-19 Scenario- Low Growth Case
6 Global Application Management Services Market Trends
6.1 Global Application Management Services Revenue (USD Million) and CAGR (%) by Type (2018-2030)
6.2 Global Application Management Services Revenue (USD Million) and CAGR (%) by Applications (2018-2030)
6.3 Global Application Management Services Revenue (USD Million) and CAGR (%) by regions (2018-2030)
7 Global Application Management Services Market Revenue (USD Million) by Type, and Applications (2018-2022)
7.1 Global Application Management Services Revenue (USD Million) by Type (2018-2022)
7.1.1 Global Application Management Services Revenue (USD Million), Market Share (%) by Type (2018-2022)
7.2 Global Application Management Services Revenue (USD Million) by Applications (2018-2022)
7.2.1 Global Application Management Services Revenue (USD Million), Market Share (%) by Applications (2018-2022)
8 Global Application Management Services Development Regional Status and Outlook
8.1 Global Application Management Services Revenue (USD Million) By Regions (2018-2022)
8.2 North America Application Management Services Revenue (USD Million) by Type, and Application (2018-2022)
8.2.1 North America Application Management Services Revenue (USD Million) by Country (2018-2022)
8.2.2 North America Application Management Services Revenue (USD Million) by Type (2018-2022)
8.2.3 North America Application Management Services Revenue (USD Million) by Applications (2018-2022)
8.3 Europe Application Management Services Revenue (USD Million), by Type, and Applications (USD Million) (2018-2022)
8.3.1 Europe Application Management Services Revenue (USD Million), by Country (2018-2022)
8.3.2 Europe Application Management Services Revenue (USD Million) by Type (2018-2022)
8.3.3 Europe Application Management Services Revenue (USD Million) by Applications (2018-2022)
8.4 Asia Pacific Application Management Services Revenue (USD Million), and Revenue (USD Million) by Type, and Applications (2018-2022)
8.4.1 Asia Pacific Application Management Services Revenue (USD Million) by Country (2018-2022)
8.4.2 Asia Pacific Application Management Services Revenue (USD Million) by Type (2018-2022)
8.4.3 Asia Pacific Application Management Services Revenue (USD Million) by Applications (2018-2022)
8.5 South America Application Management Services Revenue (USD Million), by Type, and Applications (2018-2022)
8.5.1 South America Application Management Services Revenue (USD Million), by Country (2018-2022)
8.5.2 South America Application Management Services Revenue (USD Million) by Type (2018-2022)
8.5.3 South America Application Management Services Revenue (USD Million) by Applications (2018-2022)
8.6 Middle East and Africa Application Management Services Revenue (USD Million), by Type, Technology, Application, Thickness (2018-2022)
8.6.1 Middle East and Africa Application Management Services Revenue (USD Million) by Country (2018-2022)
8.6.2 Middle East and Africa Application Management Services Revenue (USD Million) by Type (2018-2022)
8.6.3 Middle East and Africa Application Management Services Revenue (USD Million) by Applications (2018-2022)
9 Company Profiles
10 Global Application Management Services Market Revenue (USD Million), by Type, and Applications (2023-2030)
10.1 Global Application Management Services Revenue (USD Million) and Market Share (%) by Type (2023-2030)
10.1.1 Global Application Management Services Revenue (USD Million), and Market Share (%) by Type (2023-2030)
10.2 Global Application Management Services Revenue (USD Million) and Market Share (%) by Applications (2023-2030)
10.2.1 Global Application Management Services Revenue (USD Million), and Market Share (%) by Applications (2023-2030)
11 Global Application Management Services Development Regional Status and Outlook Forecast
11.1 Global Application Management Services Revenue (USD Million) By Regions (2023-2030)
11.2 North America Application Management Services Revenue (USD Million) by Type, and Applications (2023-2030)
11.2.1 North America Application Management Services Revenue (USD) Million by Country (2023-2030)
11.2.2 North America Application Management Services Revenue (USD Million), by Type (2023-2030)
11.2.3 North America Application Management Services Revenue (USD Million), Market Share (%) by Applications (2023-2030)
11.3 Europe Application Management Services Revenue (USD Million), by Type, and Applications (2023-2030)
11.3.1 Europe Application Management Services Revenue (USD Million), by Country (2023-2030)
11.3.2 Europe Application Management Services Revenue (USD Million), by Type (2023-2030)
11.3.3 Europe Application Management Services Revenue (USD Million), by Applications (2023-2030)
11.4 Asia Pacific Application Management Services Revenue (USD Million) by Type, and Applications (2023-2030)
11.4.1 Asia Pacific Application Management Services Revenue (USD Million), by Country (2023-2030)
11.4.2 Asia Pacific Application Management Services Revenue (USD Million), by Type (2023-2030)
11.4.3 Asia Pacific Application Management Services Revenue (USD Million), by Applications (2023-2030)
11.5 South America Application Management Services Revenue (USD Million), by Type, and Applications (2023-2030)
11.5.1 South America Application Management Services Revenue (USD Million), by Country (2023-2030)
11.5.2 South America Application Management Services Revenue (USD Million), by Type (2023-2030)
11.5.3 South America Application Management Services Revenue (USD Million), by Applications (2023-2030)
11.6 Middle East and Africa Application Management Services Revenue (USD Million), by Type, and Applications (2023-2030)
11.6.1 Middle East and Africa Application Management Services Revenue (USD Million), by region (2023-2030)
11.6.2 Middle East and Africa Application Management Services Revenue (USD Million), by Type (2023-2030)
11.6.3 Middle East and Africa Application Management Services Revenue (USD Million), by Applications (2023-2030)
12 Methodology and Data Sources
12.1 Methodology/Research Approach
12.1.1 Research Programs/Design
12.1.2 Market Size Estimation
12.1.3 Market Breakdown and Data Triangulation
12.2 Data Sources
12.2.1 Secondary Sources
12.2.2 Primary Sources
12.3 Disclaimer
List of Tables
Table 1 Market Segmentation Analysis
Table 2 Global Application Management Services Market Companies with Areas Served
Table 3 Products Offerings Global Application Management Services Market
Table 4 Low Growth Scenario Forecasts
Table 5 Reference Case Growth Scenario
Table 6 High Growth Case Scenario
Table 7 Global Application Management Services Revenue (USD Million) And CAGR (%) By Type (2018-2030)
Table 8 Global Application Management Services Revenue (USD Million) And CAGR (%) By Applications (2018-2030)
Table 9 Global Application Management Services Revenue (USD Million) And CAGR (%) By Regions (2018-2030)
Table 10 Global Application Management Services Revenue (USD Million) By Type (2018-2022)
Table 11 Global Application Management Services Revenue Market Share (%) By Type (2018-2022)
Table 12 Global Application Management Services Revenue (USD Million) By Applications (2018-2022)
Table 13 Global Application Management Services Revenue Market Share (%) By Applications (2018-2022)
Table 14 Global Application Management Services Market Revenue (USD Million) By Regions (2018-2022)
Table 15 Global Application Management Services Market Share (%) By Regions (2018-2022)
Table 16 North America Application Management Services Revenue (USD Million) By Country (2018-2022)
Table 17 North America Application Management Services Revenue (USD Million) By Type (2018-2022)
Table 18 North America Application Management Services Revenue (USD Million) By Applications (2018-2022)
Table 19 Europe Application Management Services Revenue (USD Million) By Country (2018-2022)
Table 20 Europe Application Management Services Revenue (USD Million) By Type (2018-2022)
Table 21 Europe Application Management Services Revenue (USD Million) By Applications (2018-2022)
Table 22 Asia Pacific Application Management Services Revenue (USD Million) By Country (2018-2022)
Table 23 Asia Pacific Application Management Services Revenue (USD Million) By Type (2018-2022)
Table 24 Asia Pacific Application Management Services Revenue (USD Million) By Applications (2018-2022)
Table 25 South America Application Management Services Revenue (USD Million) By Country (2018-2022)
Table 26 South America Application Management Services Revenue (USD Million) By Type (2018-2022)
Table 27 South America Application Management Services Revenue (USD Million) By Applications (2018-2022)
Table 28 Middle East and Africa Application Management Services Revenue (USD Million) By Region (2018-2022)
Table 29 Middle East and Africa Application Management Services Revenue (USD Million) By Type (2018-2022)
Table 30 Middle East and Africa Application Management Services Revenue (USD Million) By Applications (2018-2022)
Table 31 Financial Analysis
Table 32 Global Application Management Services Revenue (USD Million) By Type (2023-2030)
Table 33 Global Application Management Services Revenue Market Share (%) By Type (2023-2030)
Table 34 Global Application Management Services Revenue (USD Million) By Applications (2023-2030)
Table 35 Global Application Management Services Revenue Market Share (%) By Applications (2023-2030)
Table 36 Global Application Management Services Market Revenue (USD Million), And Revenue (USD Million) By Regions (2023-2030)
Table 37 North America Application Management Services Revenue (USD)By Country (2023-2030)
Table 38 North America Application Management Services Revenue (USD Million) By Type (2023-2030)
Table 39 North America Application Management Services Revenue (USD Million) By Applications (2023-2030)
Table 40 Europe Application Management Services Revenue (USD Million) By Country (2023-2030)
Table 41 Europe Application Management Services Revenue (USD Million) By Type (2023-2030)
Table 42 Europe Application Management Services Revenue (USD Million) By Applications (2023-2030)
Table 43 Asia Pacific Application Management Services Revenue (USD Million) By Country (2023-2030)
Table 44 Asia Pacific Application Management Services Revenue (USD Million) By Type (2023-2030)
Table 45 Asia Pacific Application Management Services Revenue (USD Million) By Applications (2023-2030)
Table 46 South America Application Management Services Revenue (USD Million) By Country (2023-2030)
Table 47 South America Application Management Services Revenue (USD Million) By Type (2023-2030)
Table 48 South America Application Management Services Revenue (USD Million) By Applications (2023-2030)
Table 49 Middle East and Africa Application Management Services Revenue (USD Million) By Region (2023-2030)
Table 50 Middle East and Africa Application Management Services Revenue (USD Million) By Region (2023-2030)
Table 51 Middle East and Africa Application Management Services Revenue (USD Million) By Type (2023-2030)
Table 52 Middle East and Africa Application Management Services Revenue (USD Million) By Applications (2023-2030)
Table 53 Research Programs/Design for This Report
Table 54 Key Data Information from Secondary Sources
Table 55 Key Data Information from Primary Sources
List of Figures
Figure 1 Market Scope
Figure 2 Porter’s Five Forces
Figure 3 Global Application Management Services Revenue (USD Million) By Type (2018-2022)
Figure 4 Global Application Management Services Revenue Market Share (%) By Type (2022)
Figure 5 Global Application Management Services Revenue (USD Million) By Applications (2018-2022)
Figure 6 Global Application Management Services Revenue Market Share (%) By Applications (2022)
Figure 7 Global Application Management Services Market Revenue (USD Million) By Regions (2018-2022)
Figure 8 Global Application Management Services Market Share (%) By Regions (2022)
Figure 9 North America Application Management Services Revenue (USD Million) By Country (2018-2022)
Figure 10 North America Application Management Services Revenue (USD Million) By Type (2018-2022)
Figure 11 North America Application Management Services Revenue (USD Million) By Applications (2018-2022)
Figure 12 Europe Application Management Services Revenue (USD Million) By Country (2018-2022)
Figure 13 Europe Application Management Services Revenue (USD Million) By Type (2018-2022)
Figure 14 Europe Application Management Services Revenue (USD Million) By Applications (2018-2022)
Figure 15 Asia Pacific Application Management Services Revenue (USD Million) By Country (2018-2022)
Figure 16 Asia Pacific Application Management Services Revenue (USD Million) By Type (2018-2022)
Figure 17 Asia Pacific Application Management Services Revenue (USD Million) By Applications (2018-2022)
Figure 18 South America Application Management Services Revenue (USD Million) By Country (2018-2022)
Figure 19 South America Application Management Services Revenue (USD Million) By Type (2018-2022)
Figure 20 South America Application Management Services Revenue (USD Million) By Applications (2018-2022)
Figure 21 Middle East and Africa Application Management Services Revenue (USD Million) By Region (2018-2022)
Figure 22 Middle East and Africa Application Management Services Revenue (USD Million) By Type (2018-2022)
Figure 23 Middle East and Africa Application Management Services Revenue (USD Million) By Applications (2018-2022)
Figure 24 Global Application Management Services Revenue (USD Million) By Type (2023-2030)
Figure 25 Global Application Management Services Revenue Market Share (%) By Type (2030)
Figure 26 Global Application Management Services Revenue (USD Million) By Applications (2023-2030)
Figure 27 Global Application Management Services Revenue Market Share (%) By Applications (2030)
Figure 28 Global Application Management Services Market Revenue (USD Million) By Regions (2023-2030)
Figure 29 North America Application Management Services Revenue (USD Million) By Country (2023-2030)
Figure 30 North America Application Management Services Revenue (USD Million) By Type (2023-2030)
Figure 31 North America Application Management Services Revenue (USD Million) By Applications (2023-2030)
Figure 32 Europe Application Management Services Revenue (USD Million) By Country (2023-2030)
Figure 33 Europe Application Management Services Revenue (USD Million) By Type (2023-2030)
Figure 34 Europe Application Management Services Revenue (USD Million) By Applications (2023-2030)
Figure 35 Asia Pacific Application Management Services Revenue (USD Million) By Country (2023-2030)
Figure 36 Asia Pacific Application Management Services Revenue (USD Million) By Type (2023-2030)
Figure 37 Asia Pacific Application Management Services Revenue (USD Million) By Applications (2023-2030)
Figure 38 South America Application Management Services Revenue (USD Million) By Country (2023-2030)
Figure 39 South America Application Management Services Revenue (USD Million) By Type (2023-2030)
Figure 40 South America Application Management Services Revenue (USD Million) By Applications (2023-2030)
Figure 41 Middle East and Africa Application Management Services Revenue (USD Million) By Region (2023-2030)
Figure 42 Middle East and Africa Application Management Services Revenue (USD Million) By Region (2023-2030)
Figure 43 Middle East and Africa Application Management Services Revenue (USD Million) By Type (2023-2030)
Figure 44 Middle East and Africa Application Management Services Revenue (USD Million) By Applications (2023-2030)
Figure 45 Bottom-Up and Top-Down Approaches for This Report
Figure 46 Data Triangulation
