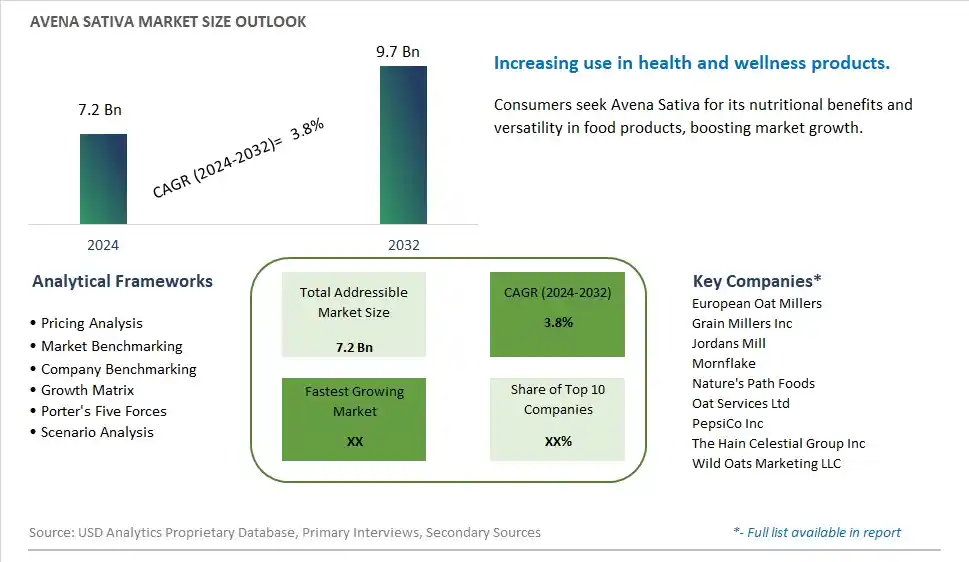
Global Avena Sativa Market Size is valued at $7.2 Billion in 2024 and is forecast to register a growth rate (CAGR) of 3.8% to reach $9.7 Billion by 2032.
The global Avena Sativa Market Comprehensive Study analyzes and forecasts the market size across 6 regions and 24 countries for diverse segments -By Type (Organic, Conventional), By End-User (Food, Cosmetic Care, Animal Feed), By Distribution Channel (Supermarkets/Hypermarkets, Convenience Store, Online Store, Others)
An Introduction to Avena Sativa Market
In 2024, the Avena sativa (oat) market is thriving, fueled by the demand for nutritious and versatile grains used in various food products. Avena sativa, known for its high fiber content and heart health benefits, is used in oatmeal, granola, and bakery items. The market benefits from advancements in oat cultivation and processing technologies that enhance product quality and nutritional value. The trend towards clean label and natural ingredients is influencing product development. Increasing consumer interest in healthy eating and the popularity of whole grains are further supporting market growth.
Avena Sativa Competitive Landscape
The market report analyses the leading companies in the industry including European Oat Millers, Grain Millers Inc, Jordans Mill, Mornflake, Nature's Path Foods, Oat Services Ltd, PepsiCo Inc, The Hain Celestial Group Inc, Wild Oats Marketing LLC, and Others.
Avena Sativa Market Dynamics
Avena Sativa Market Trend: Growing Use in Health and Wellness Products
The most prominent trend in the Avena Sativa Market is the growing use in health and wellness products. Avena sativa, commonly known as oat, is being increasingly incorporated into a variety of health foods, dietary supplements, and skincare products, driven by its nutritional benefits and versatility. This trend is fueled by the growing awareness of the health benefits of oats, such as high fiber content and antioxidant properties.
Avena Sativa Market Driver: Health Consciousness and Demand for Natural Ingredients
A key driver in the Avena Sativa Market is health consciousness and the demand for natural ingredients. As more individuals focus on improving their diet and incorporating nutrient-dense foods, there is a rising demand for Avena sativa that provides essential vitamins, minerals, and fiber. This demand supports the growth of the market as consumers seek natural and minimally processed food ingredients.
Avena Sativa Market Opportunity: Innovation in Food and Beverage Applications
One significant opportunity in the Avena Sativa Market lies in innovation in food and beverage applications. Companies can develop new products that incorporate Avena sativa into various formulations, such as cereals, protein bars, and health drinks, offering consumers convenient and health-focused options. By highlighting the benefits and versatility of Avena sativa, manufacturers can attract a broader consumer base and drive market growth.
Avena Sativa Market Share Analysis- Largest Segment by Type
Within the Avena Sativa Market, the Conventional segment is currently the largest. This dominance can be attributed to several factors. Conventional oats are more widely produced and distributed due to their lower cost of production compared to organic oats. Conventional farming methods benefit from established supply chains and economies of scale, which translate into lower prices for end consumers. Additionally, conventional oats are prevalent in various food products and industrial applications, further reinforcing their market leadership. Despite the growing interest in organic products, the widespread availability and affordability of conventional oats maintain their position as the largest segment in the Avena Sativa Market.
Avena Sativa Market Share Analysis- Poised to Grow Fastest Over the Next Five Years by End-User
The Cosmetic Care segment within the Avena Sativa Market is poised for the fastest growth over the next five years. This rapid expansion is fueled by increasing consumer awareness of natural and organic ingredients in personal care products. Oats are valued for their soothing and moisturizing properties, making them a popular choice in skincare and cosmetic formulations. The rising trend towards natural beauty products and the growing emphasis on skin health are driving demand for oat-based ingredients. Additionally, the versatility of oats in cosmetic applications, from facial masks to body scrubs, enhances their attractiveness to manufacturers. As the cosmetic industry continues to innovate and prioritize natural ingredients, the growth of the cosmetic care segment in the Avena Sativa Market is expected to outpace other end-user applications.
Avena Sativa Market Share Analysis- Largest Segment by Distribution Channel
In the Avena Sativa Market, the Supermarkets/Hypermarkets segment is the largest distribution channel. This prominence is due to the extensive reach and high consumer traffic of these retail formats. Supermarkets and hypermarkets offer a wide range of oat products, including various types of oats and oat-based products, which attracts a diverse customer base. The convenience of one-stop shopping and the ability to stock large quantities of products make these stores the preferred choice for both regular consumers and bulk buyers. Additionally, these retail formats benefit from strong supplier relationships and logistical networks that ensure consistent availability of products. The prominence of supermarkets and hypermarkets in the distribution of Avena Sativa products underscores their critical role in meeting consumer demand on a broad scale.
Avena Sativa Market Segmentation
By Type
Organic
Conventional
By End-User
Food
Cosmetic Care
Animal Feed
By Distribution Channel
Supermarkets/Hypermarkets
Convenience Store
Online Store
Others
Countries Analyzed
North America (US, Canada, Mexico)
Europe (Germany, UK, France, Spain, Italy, Russia, Rest of Europe)
Asia Pacific (China, India, Japan, South Korea, Australia, South East Asia, Rest of Asia)
South America (Brazil, Argentina, Rest of South America)
Middle East and Africa (Saudi Arabia, UAE, Rest of Middle East, South Africa, Egypt, Rest of Africa)
Avena Sativa Companies Profiled in the Study
European Oat Millers
Grain Millers Inc
Jordans Mill
Mornflake
Nature's Path Foods
Oat Services Ltd
PepsiCo Inc
The Hain Celestial Group Inc
Wild Oats Marketing LLC
*- List Not Exhaustive
Chapter 1. TABLE OF CONTENTS
Chapter 2. Introduction to Avena Sativa Market
2.1. Market Overview
2.2. Key Statistics and Report Highlights
2.3. Scope of the Comprehensive Study
2.3.1. Market Definition
2.3.2 Countries and Regions Covered
2.3.3 Research Objective
2.3.4 Units, Currency, and Conversions
2.3.5 Industry Value Chain
2.4. Key Market Segments
2.5. Key Companies
2.6. Study Period
Chapter 3. Strategic Analysis Review
3.1. Avena Sativa Pricing Analysis and Forecast
3.2. Porter’s Five Forces
3.3. Market Ecosystem
3.4. SWOT Analysis
3.5. Regulatory Scenario
3.3. Effects of Inflation, Russia-Ukraine War, moderating economic growth, and other macroeconomic factors
Chapter 4. Competitive Landscape
4.1. Market Share Analysis
4.1.1. Global Avena Sativa Market Share by Company, 2023
4.1.2. Product Offerings of Leading Avena Sativa Companies
4.2. Market Entropy
4.2.1. New Product Launches in the Industry
4.2.2. Mergers, Acquisitions, Joint ventures, and Partnerships
4.3. Key Strategies and Best Practices
Chapter 5. Global Market Projections: Best, Reference, and Low Case Scenarios
5.1. Growth Analysis- Case Scenario Definitions
5.2. Low Growth Case Scenario Forecasts
5.3. Reference Growth Case Scenario Forecasts
5.4. High Growth Case Scenario Forecasts
Chapter 6. Market Dynamics
6.1. Avena Sativa Market Drivers
6.2. Avena Sativa Market Challenges
6.6. Avena Sativa Market Opportunities
6.4. Avena Sativa Market Trends
Chapter 7. Global Avena Sativa Market Outlook Trends
7.1. Global Avena Sativa Revenue (USD Million) and CAGR (%) by Type (2021-2032)
7.2. Global Avena Sativa Revenue (USD Million) and CAGR (%) by Application (2021-2032)
7.3. Global Avena Sativa Revenue (USD Million) and CAGR (%) by Product (2021-2032)
By Type
Organic
Conventional
By End-User
Food
Cosmetic Care
Animal Feed
By Distribution Channel
Supermarkets/Hypermarkets
Convenience Store
Online Store
Others
Chapter 8. Global Avena Sativa Regional Analysis and Outlook
8.1. Global Avena Sativa Revenue (USD Million) By Regions (2021- 2032)
8.2. North America Avena Sativa Revenue (USD Million) by Country (2021-2032)
8.2.1. United States Avena Sativa Regional Analysis and Outlook
8.2.2. Canada Avena Sativa Regional Analysis and Outlook
8.2.3. Mexico Avena Sativa Regional Analysis and Outlook
8.3. Europe Avena Sativa Revenue (USD Million), by Country (2021-2032)
8.3.1. Germany Avena Sativa Regional Analysis and Outlook
8.3.2. France Avena Sativa Regional Analysis and Outlook
8.3.3. United Kingdom Avena Sativa Regional Analysis and Outlook
8.3.4. Spain Avena Sativa Regional Analysis and Outlook
8.3.5. Italy Avena Sativa Regional Analysis and Outlook
8.3.6. Russia Avena Sativa Regional Analysis and Outlook
8.3.7. Rest of Europe Avena Sativa Regional Analysis and Outlook
8.4. Asia Pacific Avena Sativa Revenue (USD Million) by Country (2021-2032)
8.4.1. China Avena Sativa Regional Analysis and Outlook
8.4.2. Japan Avena Sativa Regional Analysis and Outlook
8.4.3. India Avena Sativa Regional Analysis and Outlook
8.4.4. South Korea Avena Sativa Regional Analysis and Outlook
8.4.5. Australia Avena Sativa Regional Analysis and Outlook
8.4.6. South East Asia Avena Sativa Regional Analysis and Outlook
8.4.7. Rest of Asia Pacific Avena Sativa Regional Analysis and Outlook
8.5. South America Avena Sativa Revenue (USD Million), by Country (2021-2032)
8.5.1. Brazil Avena Sativa Regional Analysis and Outlook
8.5.2. Argentina Avena Sativa Regional Analysis and Outlook
8.5.3. Rest of South America Avena Sativa Regional Analysis and Outlook
8.6. Middle East and Africa Avena Sativa Revenue (USD Million) by Country (2021-2032)
8.6.1. Middle East Avena Sativa Regional Analysis and Outlook
8.6.2. Africa Avena Sativa Regional Analysis and Outlook
Chapter 9. North America Avena Sativa Analysis and Outlook
9.1. North America Avena Sativa Revenue (USD Million) by Segments (2021-2032)
9.1.1. North America Avena Sativa Revenue (USD Million) by Type (2021-2032)
9.1.2. North America Avena Sativa Revenue (USD Million) by Application (2021-2032)
9.1.3. North America Avena Sativa Revenue (USD Million) by Product (2021-2032)
By Type
Organic
Conventional
By End-User
Food
Cosmetic Care
Animal Feed
By Distribution Channel
Supermarkets/Hypermarkets
Convenience Store
Online Store
Others
Chapter 10. Europe Avena Sativa Analysis and Outlook
10.1. Europe Avena Sativa Revenue (USD Million), by Segments (USD Million) (2021-2032)
10.1.1. Europe Avena Sativa Revenue (USD Million) by Type (2021-2032)
10.1.2. Europe Avena Sativa Revenue (USD Million) by Application (2021-2032)
10.1.3. Europe Avena Sativa Revenue (USD Million) by Product (2021-2032)
By Type
Organic
Conventional
By End-User
Food
Cosmetic Care
Animal Feed
By Distribution Channel
Supermarkets/Hypermarkets
Convenience Store
Online Store
Others
Chapter 11. Asia Pacific Avena Sativa Analysis and Outlook
11.1. Asia Pacific Avena Sativa Revenue (USD Million), and Revenue (USD Million) by Segments (2021-2032)
11.1.1. Asia Pacific Avena Sativa Revenue (USD Million) by Type (2021-2032)
11.1.2. Asia Pacific Avena Sativa Revenue (USD Million) by Application (2021-2032)
11.1.3. Asia Pacific Avena Sativa Revenue (USD Million) by Product (2021-2032)
By Type
Organic
Conventional
By End-User
Food
Cosmetic Care
Animal Feed
By Distribution Channel
Supermarkets/Hypermarkets
Convenience Store
Online Store
Others
Chapter 12. South America Avena Sativa Analysis and Outlook
12.1. South America Avena Sativa Revenue (USD Million), by Segments (2021-2032)
12.1.1. South America Avena Sativa Revenue (USD Million) by Type (2021-2032)
12.1.2. South America Avena Sativa Revenue (USD Million) by Application (2021-2032)
12.1.3. South America Avena Sativa Revenue (USD Million) by Product (2021-2032)
By Type
Organic
Conventional
By End-User
Food
Cosmetic Care
Animal Feed
By Distribution Channel
Supermarkets/Hypermarkets
Convenience Store
Online Store
Others
Chapter 13. Middle East and Africa Avena Sativa Analysis and Outlook
13.1. Middle East and Africa Avena Sativa Revenue (USD Million), by Segments (2021-2032)
13.1.1. Middle East and Africa Avena Sativa Revenue (USD Million) by Type (2021-2032)
13.1.2. Middle East and Africa Avena Sativa Revenue (USD Million) by Application (2021-2032)
13.1.3. Middle East and Africa Avena Sativa Revenue (USD Million) by Product (2021-2032)
By Type
Organic
Conventional
By End-User
Food
Cosmetic Care
Animal Feed
By Distribution Channel
Supermarkets/Hypermarkets
Convenience Store
Online Store
Others
Chapter 14. Avena Sativa Company Profiles
14.1 Business Overview
14.2 Product Profiles
14.3 SWOT Profiles
14.5 Recent Developments
14.6 Financial Profile
List of Companies
European Oat Millers
Grain Millers Inc
Jordans Mill
Mornflake
Nature's Path Foods
Oat Services Ltd
PepsiCo Inc
The Hain Celestial Group Inc
Wild Oats Marketing LLC
15. Methodology and Data Sources
15.1 Customization Offerings
15.2 Subscription Services
15.3 Related Reports
15.4 Publisher Expertise
LIST OF TABLES
Table 1 Market Segmentation Analysis
Table 2 Global Avena Sativa Market Share of Leading Companies, 2023
Table 3 Product Offerings of Leading Companies
Table 4 Low Growth Scenario Forecasts
Table 5 Reference Case Growth Scenario
Table 6 High Growth Case Scenario
Table 7 Global Avena Sativa Revenue (USD Million) And CAGR (%) By Type (2021-2032)
Table 8 Global Avena Sativa Revenue (USD Million) And CAGR (%) By Application (2021-2032)
Table 9 Global Avena Sativa Revenue (USD Million) And CAGR (%) By Product (2021-2032)
Table 10 Global Avena Sativa Market Revenue (USD Million) By Regions (2021-2032)
Table 11 Global Avena Sativa Market Share (%) By Regions (2021-2032)
Table 12 North America Avena Sativa Revenue (USD Million) By Country (2021-2032)
Table 13 Europe Avena Sativa Revenue (USD Million) By Country (2021-2032)
Table 14 Asia Pacific Avena Sativa Revenue (USD Million) By Country (2021-2032)
Table 15 South America Avena Sativa Revenue (USD Million) By Country (2021-2032)
Table 16 Middle East and Africa Avena Sativa Revenue (USD Million) By Region (2021-2032)
Table 17 North America Avena Sativa Revenue (USD Million) By Type (2021-2032)
Table 18 North America Avena Sativa Revenue (USD Million) By Application (2021-2032)
Table 19 North America Avena Sativa Revenue (USD Million) By Product (2021-2032)
Table 20 Europe Avena Sativa Revenue (USD Million) By Type (2021-2032)
Table 21 Europe Avena Sativa Revenue (USD Million) By Application (2021-2032)
Table 22 Europe Avena Sativa Revenue (USD Million) By Product (2021-2032)
Table 23 Asia Pacific Avena Sativa Revenue (USD Million) By Type (2021-2032)
Table 24 Asia Pacific Avena Sativa Revenue (USD Million) By Application (2021-2032)
Table 25 Asia Pacific Avena Sativa Revenue (USD Million) By Product (2021-2032)
Table 26 South America Avena Sativa Revenue (USD Million) By Type (2021-2032)
Table 27 South America Avena Sativa Revenue (USD Million) By Application (2021-2032)
Table 28 South America Avena Sativa Revenue (USD Million) By Product (2021-2032)
Table 29 Middle East and Africa Avena Sativa Revenue (USD Million) By Type (2021-2032)
Table 30 Middle East and Africa Avena Sativa Revenue (USD Million) By Application (2021-2032)
Table 31 Middle East and Africa Avena Sativa Revenue (USD Million) By Product (2021-2032)
LIST OF FIGURES
Figure 1. Market Scope
Figure 2. Pricing Forecasts Per Unit, 2023- 2032
Figure 3. Porter’s Five Forces
Figure 4. Global Avena Sativa Market Revenue (USD Million) By Regions (2021-2032)
Figure 5. Global Avena Sativa Market Share (%) By Regions (2023)
Figure 6. North America Avena Sativa Revenue (USD Million) By Country (2021-2032)
Figure 7. United States Avena Sativa Revenue (USD Million) By Country (2021-2032)
Figure 8. Canada Avena Sativa Revenue (USD Million) By Country (2021-2032)
Figure 9. Mexico Avena Sativa Revenue (USD Million) By Country (2021-2032)
Figure 10. Europe Avena Sativa Revenue (USD Million) By Country (2021-2032)
Figure 11. Germany Avena Sativa Revenue (USD Million) By Country (2021-2032)
Figure 12. France Avena Sativa Revenue (USD Million) By Country (2021-2032)
Figure 13. United Kingdom Avena Sativa Revenue (USD Million) By Country (2021-2032)
Figure 14. Spain Avena Sativa Revenue (USD Million) By Country (2021-2032)
Figure 15. Italy Avena Sativa Revenue (USD Million) By Country (2021-2032)
Figure 16. Russia Avena Sativa Revenue (USD Million) By Country (2021-2032)
Figure 17. Rest of Europe Avena Sativa Revenue (USD Million) By Country (2021-2032)
Figure 11. Asia Pacific Avena Sativa Revenue (USD Million) By Country (2021-2032)
Figure 12. China Avena Sativa Revenue (USD Million) By Country (2021-2032)
Figure 13. Japan Avena Sativa Revenue (USD Million) By Country (2021-2032)
Figure 14. India Avena Sativa Revenue (USD Million) By Country (2021-2032)
Figure 15. South Korea Avena Sativa Revenue (USD Million) By Country (2021-2032)
Figure 16. Australia Avena Sativa Revenue (USD Million) By Country (2021-2032)
Figure 17. South East Asia Avena Sativa Revenue (USD Million) By Country (2021-2032)
Figure 18. South America Avena Sativa Revenue (USD Million) By Country (2021-2032)
Figure 19. Brazil Avena Sativa Revenue (USD Million) By Country (2021-2032)
Figure 20. Argentina Avena Sativa Revenue (USD Million) By Country (2021-2032)
Figure 21. Rest of Asia Pacific Avena Sativa Revenue (USD Million) By Country (2021-2032)
Figure 22. Middle East and Africa Avena Sativa Revenue (USD Million) By Region (2021-2032)
Figure 23. Saudi Arabia Avena Sativa Revenue (USD Million) By Region (2021-2032)
Figure 24. The UAE Avena Sativa Revenue (USD Million) By Region (2021-2032)
Figure 25. Rest of Middle East Avena Sativa Revenue (USD Million) By Region (2021-2032)
Figure 26. South Africa Avena Sativa Revenue (USD Million) By Region (2021-2032)
Figure 27. Africa Avena Sativa Revenue (USD Million) By Region (2021-2032)
Figure 28. North America Avena Sativa Revenue (USD Million) By Type (2021-2032)
Figure 29. North America Avena Sativa Revenue (USD Million) By Application (2021-2032)
Figure 30. North America Avena Sativa Revenue (USD Million) By Product (2021-2032)
Figure 31. Europe Avena Sativa Revenue (USD Million) By Type (2021-2032)
Figure 32. Europe Avena Sativa Revenue (USD Million) By Application (2021-2032)
Figure 33. Europe Avena Sativa Revenue (USD Million) By Product (2021-2032)
Figure 34. Asia Pacific Avena Sativa Revenue (USD Million) By Type (2021-2032)
Figure 35. Asia Pacific Avena Sativa Revenue (USD Million) By Application (2021-2032)
Figure 36. Asia Pacific Avena Sativa Revenue (USD Million) By Product (2021-2032)
Figure 37. South America Avena Sativa Revenue (USD Million) By Type (2021-2032)
Figure 38. South America Avena Sativa Revenue (USD Million) By Application (2021-2032)
Figure 39. South America Avena Sativa Revenue (USD Million) By Product (2021-2032)
Figure 40. Middle East and Africa Avena Sativa Revenue (USD Million) By Type (2021-2032)
Figure 41. Middle East and Africa Avena Sativa Revenue (USD Million) By Application (2021-2032)
Figure 42. Middle East and Africa Avena Sativa Revenue (USD Million) By Product (2021-2032)
By Type
Organic
Conventional
By End-User
Food
Cosmetic Care
Animal Feed
By Distribution Channel
Supermarkets/Hypermarkets
Convenience Store
Online Store
Others
Countries Analyzed
North America (US, Canada, Mexico)
Europe (Germany, UK, France, Spain, Italy, Russia, Rest of Europe)
Asia Pacific (China, India, Japan, South Korea, Australia, South East Asia, Rest of Asia)
South America (Brazil, Argentina, Rest of South America)
Middle East and Africa (Saudi Arabia, UAE, Rest of Middle East, South Africa, Egypt, Rest of Africa)
