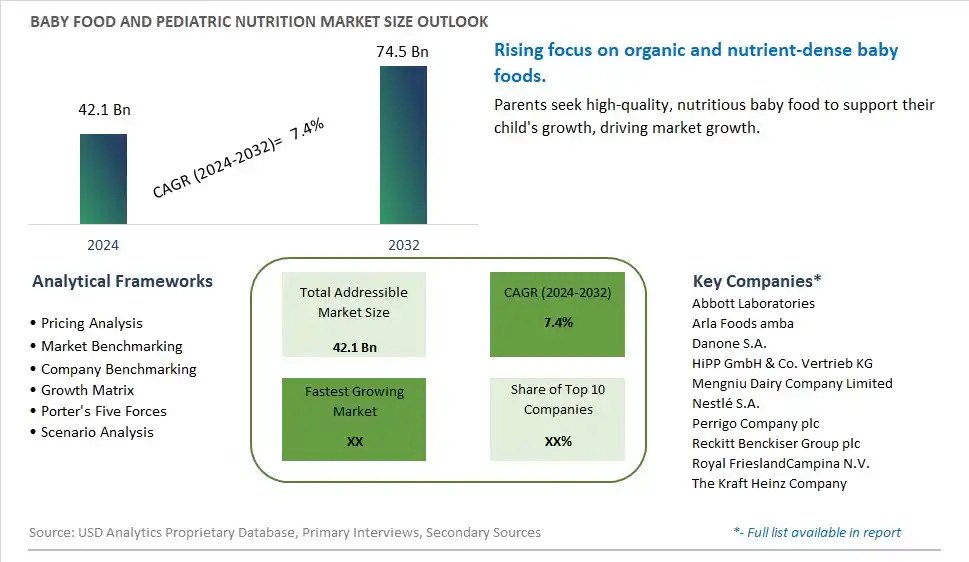
Global Baby Food and Pediatric Nutrition Market Size is valued at $42.1 Billion in 2024 and is forecast to register a growth rate (CAGR) of 7.4% to reach $74.5 Billion by 2032.
The global Baby Food and Pediatric Nutrition Market Comprehensive Study analyzes and forecasts the market size across 6 regions and 24 countries for diverse segments -By Type (Bottled Baby food, Baby cereals, Baby snacks, Baby soups, Canned and Frozen Baby foods), By Application (Dried Baby Food, Milk Formula, Prepared Baby Food, Others)
An Introduction to Baby Food and Pediatric Nutrition Market
In 2024, the baby food and pediatric nutrition market is thriving, fueled by the demand for safe, nutritious, and convenient food products for infants and young children. Baby food, including purees, cereals, and snacks, is formulated to meet the specific nutritional needs of growing children. The market benefits from advancements in food formulation and packaging technologies that enhance product safety and convenience. The trend towards clean label and natural ingredients is influencing product development. Increasing awareness of early childhood nutrition and the popularity of organic baby foods are further supporting market growth.
Baby Food and Pediatric Nutrition Competitive Landscape
The market report analyses the leading companies in the industry including Abbott Laboratories, Arla Foods amba, Danone S.A., HiPP GmbH & Co. Vertrieb KG, Mengniu Dairy Company Limited, Nestlé S.A., Perrigo Company plc, Reckitt Benckiser Group plc, Royal FrieslandCampina N.V., The Kraft Heinz Company, and Others.
Baby Food and Pediatric Nutrition Market Dynamics
Baby Food and Pediatric Nutrition Market Trend: Shift Towards Organic and Natural Products
The most prominent trend in the Baby Food and Pediatric Nutrition Market is the shift towards organic and natural products. Parents are increasingly concerned about the presence of synthetic additives and pesticides in baby food, leading to a growing demand for organic, non-GMO, and clean-label products. This trend reflects the broader consumer movement towards healthier, more transparent food options.
Baby Food and Pediatric Nutrition Market Driver: Rising Awareness of Infant Health and Nutrition
A key driver in the Baby Food and Pediatric Nutrition Market is the rising awareness of the importance of infant health and nutrition. Parents are becoming more knowledgeable about the critical role that proper nutrition plays in early childhood development, leading to a higher demand for nutrient-rich and balanced baby food products. This heightened awareness drives market growth as parents seek the best for their children.
Baby Food and Pediatric Nutrition Market Opportunity: Innovation in Functional Foods for Infants
One significant opportunity in the Baby Food and Pediatric Nutrition Market lies in innovation in functional foods for infants. Companies can develop new products that not only meet basic nutritional needs but also offer additional health benefits, such as improved digestion, enhanced immunity, and cognitive development support. By creating innovative, health-focused baby food products, manufacturers can attract health-conscious parents and expand their market share.
Baby Food and Pediatric Nutrition Market Share Analysis- Largest Segment by Type
In the Baby Food and Pediatric Nutrition Market, Bottled Baby Food is the largest segment. This dominance is due to several key factors, including convenience, ease of use, and long shelf life. Bottled baby food provides a ready-to-eat solution that simplifies meal preparation for parents, making it a popular choice. Additionally, the wide variety of flavors and formulations available in bottled form caters to different stages of infant development and dietary needs. The established market presence and consumer preference for bottled baby food reinforce its position as the leading segment. Furthermore, the strong distribution networks and marketing strategies employed by manufacturers contribute to the sustained popularity and market leadership of bottled baby food.
Baby Food and Pediatric Nutrition Market Share Analysis- Poised to Grow Fastest Over the Next Five Years by Application
The Milk Formula application segment in the Baby Food and Pediatric Nutrition Market is expected to grow the fastest over the next five years. This growth is driven by increasing awareness of the nutritional needs of infants and the growing demand for convenient and nutritionally complete feeding solutions. Milk formula provides essential nutrients and is a critical alternative for parents who may be unable to breastfeed. The rise in dual-income households and the increasing focus on infant health and nutrition further bolster the demand for milk formula. Additionally, advancements in formula formulations, including tailored options for different age groups and dietary requirements, contribute to the segment’s rapid expansion. As more parents seek reliable and high-quality feeding solutions, the milk formula segment is set to experience significant growth.
Baby Food and Pediatric Nutrition Market Segmentation
By Type
Bottled Baby food
Baby cereals
Baby snacks
Baby soups
Canned and Frozen Baby foods
By Application
Dried Baby Food
Milk Formula
Prepared Baby Food
Others
Countries Analyzed
North America (US, Canada, Mexico)
Europe (Germany, UK, France, Spain, Italy, Russia, Rest of Europe)
Asia Pacific (China, India, Japan, South Korea, Australia, South East Asia, Rest of Asia)
South America (Brazil, Argentina, Rest of South America)
Middle East and Africa (Saudi Arabia, UAE, Rest of Middle East, South Africa, Egypt, Rest of Africa)
Baby Food and Pediatric Nutrition Companies Profiled in the Study
Abbott Laboratories
Arla Foods amba
Danone S.A.
HiPP GmbH & Co. Vertrieb KG
Mengniu Dairy Company Limited
Nestlé S.A.
Perrigo Company plc
Reckitt Benckiser Group plc
Royal FrieslandCampina N.V.
The Kraft Heinz Company
*- List Not Exhaustive
Chapter 1. TABLE OF CONTENTS
Chapter 2. Introduction to Baby Food and Pediatric Nutrition Market
2.1. Market Overview
2.2. Key Statistics and Report Highlights
2.3. Scope of the Comprehensive Study
2.3.1. Market Definition
2.3.2 Countries and Regions Covered
2.3.3 Research Objective
2.3.4 Units, Currency, and Conversions
2.3.5 Industry Value Chain
2.4. Key Market Segments
2.5. Key Companies
2.6. Study Period
Chapter 3. Strategic Analysis Review
3.1. Baby Food and Pediatric Nutrition Pricing Analysis and Forecast
3.2. Porter’s Five Forces
3.3. Market Ecosystem
3.4. SWOT Analysis
3.5. Regulatory Scenario
3.3. Effects of Inflation, Russia-Ukraine War, moderating economic growth, and other macroeconomic factors
Chapter 4. Competitive Landscape
4.1. Market Share Analysis
4.1.1. Global Baby Food and Pediatric Nutrition Market Share by Company, 2023
4.1.2. Product Offerings of Leading Baby Food and Pediatric Nutrition Companies
4.2. Market Entropy
4.2.1. New Product Launches in the Industry
4.2.2. Mergers, Acquisitions, Joint ventures, and Partnerships
4.3. Key Strategies and Best Practices
Chapter 5. Global Market Projections: Best, Reference, and Low Case Scenarios
5.1. Growth Analysis- Case Scenario Definitions
5.2. Low Growth Case Scenario Forecasts
5.3. Reference Growth Case Scenario Forecasts
5.4. High Growth Case Scenario Forecasts
Chapter 6. Market Dynamics
6.1. Baby Food and Pediatric Nutrition Market Drivers
6.2. Baby Food and Pediatric Nutrition Market Challenges
6.6. Baby Food and Pediatric Nutrition Market Opportunities
6.4. Baby Food and Pediatric Nutrition Market Trends
Chapter 7. Global Baby Food and Pediatric Nutrition Market Outlook Trends
7.1. Global Baby Food and Pediatric Nutrition Revenue (USD Million) and CAGR (%) by Type (2021-2032)
7.2. Global Baby Food and Pediatric Nutrition Revenue (USD Million) and CAGR (%) by Application (2021-2032)
7.3. Global Baby Food and Pediatric Nutrition Revenue (USD Million) and CAGR (%) by Product (2021-2032)
By Type
Bottled Baby food
Baby cereals
Baby snacks
Baby soups
Canned and Frozen Baby foods
By Application
Dried Baby Food
Milk Formula
Prepared Baby Food
Others
Chapter 8. Global Baby Food and Pediatric Nutrition Regional Analysis and Outlook
8.1. Global Baby Food and Pediatric Nutrition Revenue (USD Million) By Regions (2021- 2032)
8.2. North America Baby Food and Pediatric Nutrition Revenue (USD Million) by Country (2021-2032)
8.2.1. United States Baby Food and Pediatric Nutrition Regional Analysis and Outlook
8.2.2. Canada Baby Food and Pediatric Nutrition Regional Analysis and Outlook
8.2.3. Mexico Baby Food and Pediatric Nutrition Regional Analysis and Outlook
8.3. Europe Baby Food and Pediatric Nutrition Revenue (USD Million), by Country (2021-2032)
8.3.1. Germany Baby Food and Pediatric Nutrition Regional Analysis and Outlook
8.3.2. France Baby Food and Pediatric Nutrition Regional Analysis and Outlook
8.3.3. United Kingdom Baby Food and Pediatric Nutrition Regional Analysis and Outlook
8.3.4. Spain Baby Food and Pediatric Nutrition Regional Analysis and Outlook
8.3.5. Italy Baby Food and Pediatric Nutrition Regional Analysis and Outlook
8.3.6. Russia Baby Food and Pediatric Nutrition Regional Analysis and Outlook
8.3.7. Rest of Europe Baby Food and Pediatric Nutrition Regional Analysis and Outlook
8.4. Asia Pacific Baby Food and Pediatric Nutrition Revenue (USD Million) by Country (2021-2032)
8.4.1. China Baby Food and Pediatric Nutrition Regional Analysis and Outlook
8.4.2. Japan Baby Food and Pediatric Nutrition Regional Analysis and Outlook
8.4.3. India Baby Food and Pediatric Nutrition Regional Analysis and Outlook
8.4.4. South Korea Baby Food and Pediatric Nutrition Regional Analysis and Outlook
8.4.5. Australia Baby Food and Pediatric Nutrition Regional Analysis and Outlook
8.4.6. South East Asia Baby Food and Pediatric Nutrition Regional Analysis and Outlook
8.4.7. Rest of Asia Pacific Baby Food and Pediatric Nutrition Regional Analysis and Outlook
8.5. South America Baby Food and Pediatric Nutrition Revenue (USD Million), by Country (2021-2032)
8.5.1. Brazil Baby Food and Pediatric Nutrition Regional Analysis and Outlook
8.5.2. Argentina Baby Food and Pediatric Nutrition Regional Analysis and Outlook
8.5.3. Rest of South America Baby Food and Pediatric Nutrition Regional Analysis and Outlook
8.6. Middle East and Africa Baby Food and Pediatric Nutrition Revenue (USD Million) by Country (2021-2032)
8.6.1. Middle East Baby Food and Pediatric Nutrition Regional Analysis and Outlook
8.6.2. Africa Baby Food and Pediatric Nutrition Regional Analysis and Outlook
Chapter 9. North America Baby Food and Pediatric Nutrition Analysis and Outlook
9.1. North America Baby Food and Pediatric Nutrition Revenue (USD Million) by Segments (2021-2032)
9.1.1. North America Baby Food and Pediatric Nutrition Revenue (USD Million) by Type (2021-2032)
9.1.2. North America Baby Food and Pediatric Nutrition Revenue (USD Million) by Application (2021-2032)
9.1.3. North America Baby Food and Pediatric Nutrition Revenue (USD Million) by Product (2021-2032)
By Type
Bottled Baby food
Baby cereals
Baby snacks
Baby soups
Canned and Frozen Baby foods
By Application
Dried Baby Food
Milk Formula
Prepared Baby Food
Others
Chapter 10. Europe Baby Food and Pediatric Nutrition Analysis and Outlook
10.1. Europe Baby Food and Pediatric Nutrition Revenue (USD Million), by Segments (USD Million) (2021-2032)
10.1.1. Europe Baby Food and Pediatric Nutrition Revenue (USD Million) by Type (2021-2032)
10.1.2. Europe Baby Food and Pediatric Nutrition Revenue (USD Million) by Application (2021-2032)
10.1.3. Europe Baby Food and Pediatric Nutrition Revenue (USD Million) by Product (2021-2032)
By Type
Bottled Baby food
Baby cereals
Baby snacks
Baby soups
Canned and Frozen Baby foods
By Application
Dried Baby Food
Milk Formula
Prepared Baby Food
Others
Chapter 11. Asia Pacific Baby Food and Pediatric Nutrition Analysis and Outlook
11.1. Asia Pacific Baby Food and Pediatric Nutrition Revenue (USD Million), and Revenue (USD Million) by Segments (2021-2032)
11.1.1. Asia Pacific Baby Food and Pediatric Nutrition Revenue (USD Million) by Type (2021-2032)
11.1.2. Asia Pacific Baby Food and Pediatric Nutrition Revenue (USD Million) by Application (2021-2032)
11.1.3. Asia Pacific Baby Food and Pediatric Nutrition Revenue (USD Million) by Product (2021-2032)
By Type
Bottled Baby food
Baby cereals
Baby snacks
Baby soups
Canned and Frozen Baby foods
By Application
Dried Baby Food
Milk Formula
Prepared Baby Food
Others
Chapter 12. South America Baby Food and Pediatric Nutrition Analysis and Outlook
12.1. South America Baby Food and Pediatric Nutrition Revenue (USD Million), by Segments (2021-2032)
12.1.1. South America Baby Food and Pediatric Nutrition Revenue (USD Million) by Type (2021-2032)
12.1.2. South America Baby Food and Pediatric Nutrition Revenue (USD Million) by Application (2021-2032)
12.1.3. South America Baby Food and Pediatric Nutrition Revenue (USD Million) by Product (2021-2032)
By Type
Bottled Baby food
Baby cereals
Baby snacks
Baby soups
Canned and Frozen Baby foods
By Application
Dried Baby Food
Milk Formula
Prepared Baby Food
Others
Chapter 13. Middle East and Africa Baby Food and Pediatric Nutrition Analysis and Outlook
13.1. Middle East and Africa Baby Food and Pediatric Nutrition Revenue (USD Million), by Segments (2021-2032)
13.1.1. Middle East and Africa Baby Food and Pediatric Nutrition Revenue (USD Million) by Type (2021-2032)
13.1.2. Middle East and Africa Baby Food and Pediatric Nutrition Revenue (USD Million) by Application (2021-2032)
13.1.3. Middle East and Africa Baby Food and Pediatric Nutrition Revenue (USD Million) by Product (2021-2032)
By Type
Bottled Baby food
Baby cereals
Baby snacks
Baby soups
Canned and Frozen Baby foods
By Application
Dried Baby Food
Milk Formula
Prepared Baby Food
Others
Chapter 14. Baby Food and Pediatric Nutrition Company Profiles
14.1 Business Overview
14.2 Product Profiles
14.3 SWOT Profiles
14.5 Recent Developments
14.6 Financial Profile
List of Companies
Abbott Laboratories
Arla Foods amba
Danone S.A.
HiPP GmbH & Co. Vertrieb KG
Mengniu Dairy Company Limited
Nestlé S.A.
Perrigo Company plc
Reckitt Benckiser Group plc
Royal FrieslandCampina N.V.
The Kraft Heinz Company
15. Methodology and Data Sources
15.1 Customization Offerings
15.2 Subscription Services
15.3 Related Reports
15.4 Publisher Expertise
LIST OF TABLES
Table 1 Market Segmentation Analysis
Table 2 Global Baby Food and Pediatric Nutrition Market Share of Leading Companies, 2023
Table 3 Product Offerings of Leading Companies
Table 4 Low Growth Scenario Forecasts
Table 5 Reference Case Growth Scenario
Table 6 High Growth Case Scenario
Table 7 Global Baby Food and Pediatric Nutrition Revenue (USD Million) And CAGR (%) By Type (2021-2032)
Table 8 Global Baby Food and Pediatric Nutrition Revenue (USD Million) And CAGR (%) By Application (2021-2032)
Table 9 Global Baby Food and Pediatric Nutrition Revenue (USD Million) And CAGR (%) By Product (2021-2032)
Table 10 Global Baby Food and Pediatric Nutrition Market Revenue (USD Million) By Regions (2021-2032)
Table 11 Global Baby Food and Pediatric Nutrition Market Share (%) By Regions (2021-2032)
Table 12 North America Baby Food and Pediatric Nutrition Revenue (USD Million) By Country (2021-2032)
Table 13 Europe Baby Food and Pediatric Nutrition Revenue (USD Million) By Country (2021-2032)
Table 14 Asia Pacific Baby Food and Pediatric Nutrition Revenue (USD Million) By Country (2021-2032)
Table 15 South America Baby Food and Pediatric Nutrition Revenue (USD Million) By Country (2021-2032)
Table 16 Middle East and Africa Baby Food and Pediatric Nutrition Revenue (USD Million) By Region (2021-2032)
Table 17 North America Baby Food and Pediatric Nutrition Revenue (USD Million) By Type (2021-2032)
Table 18 North America Baby Food and Pediatric Nutrition Revenue (USD Million) By Application (2021-2032)
Table 19 North America Baby Food and Pediatric Nutrition Revenue (USD Million) By Product (2021-2032)
Table 20 Europe Baby Food and Pediatric Nutrition Revenue (USD Million) By Type (2021-2032)
Table 21 Europe Baby Food and Pediatric Nutrition Revenue (USD Million) By Application (2021-2032)
Table 22 Europe Baby Food and Pediatric Nutrition Revenue (USD Million) By Product (2021-2032)
Table 23 Asia Pacific Baby Food and Pediatric Nutrition Revenue (USD Million) By Type (2021-2032)
Table 24 Asia Pacific Baby Food and Pediatric Nutrition Revenue (USD Million) By Application (2021-2032)
Table 25 Asia Pacific Baby Food and Pediatric Nutrition Revenue (USD Million) By Product (2021-2032)
Table 26 South America Baby Food and Pediatric Nutrition Revenue (USD Million) By Type (2021-2032)
Table 27 South America Baby Food and Pediatric Nutrition Revenue (USD Million) By Application (2021-2032)
Table 28 South America Baby Food and Pediatric Nutrition Revenue (USD Million) By Product (2021-2032)
Table 29 Middle East and Africa Baby Food and Pediatric Nutrition Revenue (USD Million) By Type (2021-2032)
Table 30 Middle East and Africa Baby Food and Pediatric Nutrition Revenue (USD Million) By Application (2021-2032)
Table 31 Middle East and Africa Baby Food and Pediatric Nutrition Revenue (USD Million) By Product (2021-2032)
LIST OF FIGURES
Figure 1. Market Scope
Figure 2. Pricing Forecasts Per Unit, 2023- 2032
Figure 3. Porter’s Five Forces
Figure 4. Global Baby Food and Pediatric Nutrition Market Revenue (USD Million) By Regions (2021-2032)
Figure 5. Global Baby Food and Pediatric Nutrition Market Share (%) By Regions (2023)
Figure 6. North America Baby Food and Pediatric Nutrition Revenue (USD Million) By Country (2021-2032)
Figure 7. United States Baby Food and Pediatric Nutrition Revenue (USD Million) By Country (2021-2032)
Figure 8. Canada Baby Food and Pediatric Nutrition Revenue (USD Million) By Country (2021-2032)
Figure 9. Mexico Baby Food and Pediatric Nutrition Revenue (USD Million) By Country (2021-2032)
Figure 10. Europe Baby Food and Pediatric Nutrition Revenue (USD Million) By Country (2021-2032)
Figure 11. Germany Baby Food and Pediatric Nutrition Revenue (USD Million) By Country (2021-2032)
Figure 12. France Baby Food and Pediatric Nutrition Revenue (USD Million) By Country (2021-2032)
Figure 13. United Kingdom Baby Food and Pediatric Nutrition Revenue (USD Million) By Country (2021-2032)
Figure 14. Spain Baby Food and Pediatric Nutrition Revenue (USD Million) By Country (2021-2032)
Figure 15. Italy Baby Food and Pediatric Nutrition Revenue (USD Million) By Country (2021-2032)
Figure 16. Russia Baby Food and Pediatric Nutrition Revenue (USD Million) By Country (2021-2032)
Figure 17. Rest of Europe Baby Food and Pediatric Nutrition Revenue (USD Million) By Country (2021-2032)
Figure 11. Asia Pacific Baby Food and Pediatric Nutrition Revenue (USD Million) By Country (2021-2032)
Figure 12. China Baby Food and Pediatric Nutrition Revenue (USD Million) By Country (2021-2032)
Figure 13. Japan Baby Food and Pediatric Nutrition Revenue (USD Million) By Country (2021-2032)
Figure 14. India Baby Food and Pediatric Nutrition Revenue (USD Million) By Country (2021-2032)
Figure 15. South Korea Baby Food and Pediatric Nutrition Revenue (USD Million) By Country (2021-2032)
Figure 16. Australia Baby Food and Pediatric Nutrition Revenue (USD Million) By Country (2021-2032)
Figure 17. South East Asia Baby Food and Pediatric Nutrition Revenue (USD Million) By Country (2021-2032)
Figure 18. South America Baby Food and Pediatric Nutrition Revenue (USD Million) By Country (2021-2032)
Figure 19. Brazil Baby Food and Pediatric Nutrition Revenue (USD Million) By Country (2021-2032)
Figure 20. Argentina Baby Food and Pediatric Nutrition Revenue (USD Million) By Country (2021-2032)
Figure 21. Rest of Asia Pacific Baby Food and Pediatric Nutrition Revenue (USD Million) By Country (2021-2032)
Figure 22. Middle East and Africa Baby Food and Pediatric Nutrition Revenue (USD Million) By Region (2021-2032)
Figure 23. Saudi Arabia Baby Food and Pediatric Nutrition Revenue (USD Million) By Region (2021-2032)
Figure 24. The UAE Baby Food and Pediatric Nutrition Revenue (USD Million) By Region (2021-2032)
Figure 25. Rest of Middle East Baby Food and Pediatric Nutrition Revenue (USD Million) By Region (2021-2032)
Figure 26. South Africa Baby Food and Pediatric Nutrition Revenue (USD Million) By Region (2021-2032)
Figure 27. Africa Baby Food and Pediatric Nutrition Revenue (USD Million) By Region (2021-2032)
Figure 28. North America Baby Food and Pediatric Nutrition Revenue (USD Million) By Type (2021-2032)
Figure 29. North America Baby Food and Pediatric Nutrition Revenue (USD Million) By Application (2021-2032)
Figure 30. North America Baby Food and Pediatric Nutrition Revenue (USD Million) By Product (2021-2032)
Figure 31. Europe Baby Food and Pediatric Nutrition Revenue (USD Million) By Type (2021-2032)
Figure 32. Europe Baby Food and Pediatric Nutrition Revenue (USD Million) By Application (2021-2032)
Figure 33. Europe Baby Food and Pediatric Nutrition Revenue (USD Million) By Product (2021-2032)
Figure 34. Asia Pacific Baby Food and Pediatric Nutrition Revenue (USD Million) By Type (2021-2032)
Figure 35. Asia Pacific Baby Food and Pediatric Nutrition Revenue (USD Million) By Application (2021-2032)
Figure 36. Asia Pacific Baby Food and Pediatric Nutrition Revenue (USD Million) By Product (2021-2032)
Figure 37. South America Baby Food and Pediatric Nutrition Revenue (USD Million) By Type (2021-2032)
Figure 38. South America Baby Food and Pediatric Nutrition Revenue (USD Million) By Application (2021-2032)
Figure 39. South America Baby Food and Pediatric Nutrition Revenue (USD Million) By Product (2021-2032)
Figure 40. Middle East and Africa Baby Food and Pediatric Nutrition Revenue (USD Million) By Type (2021-2032)
Figure 41. Middle East and Africa Baby Food and Pediatric Nutrition Revenue (USD Million) By Application (2021-2032)
Figure 42. Middle East and Africa Baby Food and Pediatric Nutrition Revenue (USD Million) By Product (2021-2032)
By Type
Bottled Baby food
Baby cereals
Baby snacks
Baby soups
Canned and Frozen Baby foods
By Application
Dried Baby Food
Milk Formula
Prepared Baby Food
Others
Countries Analyzed
North America (US, Canada, Mexico)
Europe (Germany, UK, France, Spain, Italy, Russia, Rest of Europe)
Asia Pacific (China, India, Japan, South Korea, Australia, South East Asia, Rest of Asia)
South America (Brazil, Argentina, Rest of South America)
Middle East and Africa (Saudi Arabia, UAE, Rest of Middle East, South Africa, Egypt, Rest of Africa)
