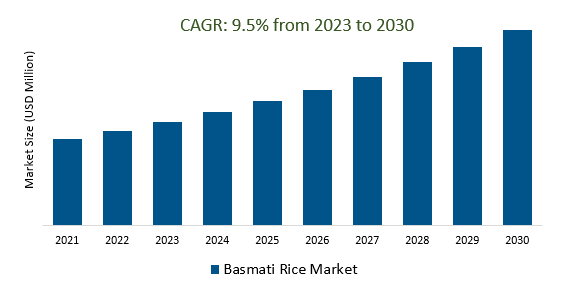
The Basmati Rice Market Size is estimated to register 9.5% growth over the forecast period from 2024 to 2030.
Basmati Rice Market Overview
The increasing demand for healthier and aromatic rice varieties, such as Basmati are driven by consumer preferences for premium-quality grains. The rising awareness of health benefits associated with Basmati rice, including its low glycemic index and gluten-free nature are influencing its popularity among health-conscious consumers. Advancements in agricultural practices, including precision farming, better irrigation techniques, and improved seed varieties are contributing to market expansion and quality, meeting the growing market demand. Additionally, Consumers are exploring various types and lengths of Basmati rice, such as traditional long-grain Basmati, extra-long grain, or aged Basmati. Further, growing culinary interest in diverse cuisines, particularly in Asian and Middle Eastern dishes are fueling the demand due to its distinct aroma, elongated grains, and excellent cooking characteristics. Factors like globalization, expanding international trade, and the extensive use in various cuisines worldwide are contributing significantly to its market growth.
Basmati Rice Market Dynamics
Market Trends- Technological advancements in rice farming greatly impact the Basmati Rice Market, boosting productivity, sustainability, and crop quality
Precision farming techniques, including the use of drones, GPS, and remote sensing are enabling farmers to optimize field management, monitor crop health, and precisely apply fertilizers and pesticides.
Further, the development of hybrid and genetically modified Basmati rice varieties with improved yield potential, disease resistance, and desirable grain qualities are contributing to enhanced productivity and market competitiveness.
Sustainable agricultural practices, such as water-efficient irrigation systems and organic farming methods are aligning with consumer preferences for eco-friendly products, fostering a positive brand image for Basmati rice producers.
Market Driver- Health and wellness preferences significantly impact the Basmati Rice Market, driving the demand for nutritional and gluten-free options like Basmati rice.
Low glycemic index makes Basmati appealing choice for individuals managing blood sugar levels or following specific diets.
The rice variety's perceived health benefits, including its suitability for various diets and its potential role in managing blood sugar levels, appeal to individuals aiming for healthier eating habits.
The preferences of health-conscious consumers seeking nutritional and better-for-you food options are propelling the market expansion.
Market Opportunity- Convenience and Innovation drives the Basmati Rice Market
Convenience-driven demands are leading to a surge in innovative Basmati rice products, such as pre-cooked or instant Basmati rice offerings, catering to consumers' fast-paced routines.
Additionally, innovations in packaging technology, like resealable pouches or portion-controlled packs, enhancing convenience and shelf-life, catering to modern consumers' preferences for ease of use and sustainability.
Further, the market is witnessing innovations in cooking methods and recipes, promoting Basmati rice as a versatile ingredient adaptable to various cuisines and culinary styles.
Market Share Analysis- White will register the fastest growth
The Basmati Rice Market is analyzed across White, Brown and Others. White is poised to register the fastest growth. It stands as a highly sought-after category due to its unique characteristics and consumer preferences. Known for its distinct aromatic fragrance, elongated grains, and fluffy texture upon cooking, white Basmati rice is a preferred choice in various culinary applications globally. Its popularity is attributed to its versatility in diverse cuisines, especially in Asian and Middle Eastern dishes. From a business viewpoint, the white Basmati rice segment presents lucrative opportunities for producers and retailers due to its higher demand, commanding premium pricing compared to other rice varieties. Its ability to cater to a broad consumer base, including health-conscious individuals seeking gluten-free and low glycemic index options, contributes significantly to its market prominence. Additionally, the white Basmati rice's export potential drives its significance in the global market, fostering trade relationships and bolstering the economies of rice-producing regions.
Market Share Analysis- Modern held a significant market share in 2023
The Basmati Rice Market is analyzed across various Sales channels including Traditional, Modern, Retail, HORECA. Of these, Modern held a significant market share in 2023. This channel comprises supermarkets, hypermarkets, and online retail platforms, catering to contemporary consumers seeking convenience and variety in their purchasing experiences. The "Modern" sales channel has gained significance due to its ability to offer a wide range of Basmati rice varieties to diverse consumer segments. It strategically leverages promotional tactics, competitive pricing strategies, and convenient shopping experiences, resonating well with modern buying preferences. Businesses operating through the modern sales channel benefit from broader market access, wider geographical reach, and effective branding opportunities. Additionally, the online retail segment within the modern sales channel provides an avenue for businesses to engage tech-savvy consumers through digital marketing, e-commerce platforms, and personalized shopping experiences, enhancing customer engagement and loyalty.
Basmati Rice Market News
India Gate Launches Nationwide Basmati Educational Campaign in Compliance with Updated FSSAI Standards.
Royal® Introduces New Ready-to-Heat White Queso & Jalapeño Seasoned Basmati Rice.
Basmati Rice Market Segmentation
By Species
By Sales Channel
- Traditional
- Modern
- Retail
By Variety
- Indian Basmati Rice
- Pakistani Basmati Rice
- Others
By Region
- North America (United States, Canada, Mexico)
- Europe (Germany, France, United Kingdom, Spain, Italy, Others)
- Asia Pacific (China, India, Japan, South Korea, Australia, Others)
- Latin America (Brazil, Argentina, Others)
- Middle East and Africa (Saudi Arabia, UAE, Kuwait, Other Middle East, South Africa, Nigeria, Other Africa)
Basmati Rice Market Companies
- KRBL Limited (India)
- Amira Nature Foods (UAE)
- LT Foods (India)
- Best Foods (India)
- Kohinoor Rice (India)
- Aeroplane Rice (India)
- Tilda Basmati Rice (Europe)
- Matco Foods (Pakistan)
- Amar Singh Chawal Wala (India)
- Hanuman Rice Mills (India)
- Adani Wilmar (India)
*List not exhaustive
Basmati Rice Market Outlook 2023
1 Market Overview
1.1 Introduction to the Basmati Rice Market
1.2 Scope of the Study
1.3 Research Objective
1.3.1 Key Market Scope and Segments
1.3.2 Players Covered
1.3.3 Years Considered
2 Executive Summary
2.1 2023 Basmati Rice Industry- Market Statistics
3 Market Dynamics
3.1 Market Drivers
3.2 Market Challenges
3.3 Market Opportunities
3.4 Market Trends
4 Market Factor Analysis
4.1 Porter’s Five Forces
4.2 Market Entropy
4.2.1 Global Basmati Rice Market Companies with Area Served
4.2.2 Products Offerings Global Basmati Rice Market
5 COVID-19 Impact Analysis and Outlook Scenarios
5.1.1 Covid-19 Impact Analysis
5.1.2 post-COVID-19 Scenario- Low Growth Case
5.1.3 Post-COVID-19 Scenario- Reference Growth Case
5.1.4 Post-COVID-19 Scenario- Low Growth Case
6 Global Basmati Rice Market Trends
6.1 Global Basmati Rice Revenue (USD Million) and CAGR (%) by Type (2018-2030)
6.2 Global Basmati Rice Revenue (USD Million) and CAGR (%) by Applications (2018-2030)
6.3 Global Basmati Rice Revenue (USD Million) and CAGR (%) by Regions (2018-2030)
7 Global Basmati Rice Market Revenue (USD Million) by Type, and Applications (2018-2022)
7.1 Global Basmati Rice Revenue (USD Million) by Type (2018-2022)
7.1.1 Global Basmati Rice Revenue (USD Million), Market Share (%) by Type (2018-2022)
7.2 Global Basmati Rice Revenue (USD Million) by Applications (2018-2022)
7.2.1 Global Basmati Rice Revenue (USD Million), Market Share (%) by Applications (2018-2022)
8 Global Basmati Rice Development Regional Status and Outlook
8.1 Global Basmati Rice Revenue (USD Million) By Regions (2018-2022)
8.2 North America Basmati Rice Revenue (USD Million) by Type, and Application (2018-2022)
8.2.1 North America Basmati Rice Revenue (USD Million) by Country (2018-2022)
8.2.2 North America Basmati Rice Revenue (USD Million) by Type (2018-2022)
8.2.3 North America Basmati Rice Revenue (USD Million) by Applications (2018-2022)
8.3 Europe Basmati Rice Revenue (USD Million), by Type, and Applications (USD Million) (2018-2022)
8.3.1 Europe Basmati Rice Revenue (USD Million), by Country (2018-2022)
8.3.2 Europe Basmati Rice Revenue (USD Million) by Type (2018-2022)
8.3.3 Europe Basmati Rice Revenue (USD Million) by Applications (2018-2022)
8.4 Asia Pacific Basmati Rice Revenue (USD Million), and Revenue (USD Million) by Type, and Applications (2018-2022)
8.4.1 Asia Pacific Basmati Rice Revenue (USD Million) by Country (2018-2022)
8.4.2 Asia Pacific Basmati Rice Revenue (USD Million) by Type (2018-2022)
8.4.3 Asia Pacific Basmati Rice Revenue (USD Million) by Applications (2018-2022)
8.5 South America Basmati Rice Revenue (USD Million), by Type, and Applications (2018-2022)
8.5.1 South America Basmati Rice Revenue (USD Million), by Country (2018-2022)
8.5.2 South America Basmati Rice Revenue (USD Million) by Type (2018-2022)
8.5.3 South America Basmati Rice Revenue (USD Million) by Applications (2018-2022)
8.6 Middle East and Africa Basmati Rice Revenue (USD Million), by Type, Technology, Application, Thickness (2018-2022)
8.6.1 Middle East and Africa Basmati Rice Revenue (USD Million) by Country (2018-2022)
8.6.2 Middle East and Africa Basmati Rice Revenue (USD Million) by Type (2018-2022)
8.6.3 Middle East and Africa Basmati Rice Revenue (USD Million) by Applications (2018-2022)
9 Company Profiles
10 Global Basmati Rice Market Revenue (USD Million), by Type, and Applications (2023-2030)
10.1 Global Basmati Rice Revenue (USD Million) and Market Share (%) by Type (2023-2030)
10.1.1 Global Basmati Rice Revenue (USD Million), and Market Share (%) by Type (2023-2030)
10.2 Global Basmati Rice Revenue (USD Million) and Market Share (%) by Applications (2023-2030)
10.2.1 Global Basmati Rice Revenue (USD Million), and Market Share (%) by Applications (2023-2030)
11 Global Basmati Rice Development Regional Status and Outlook Forecast
11.1 Global Basmati Rice Revenue (USD Million) By Regions (2023-2030)
11.2 North America Basmati Rice Revenue (USD Million) by Type, and Applications (2023-2030)
11.2.1 North America Basmati Rice Revenue (USD) Million by Country (2023-2030)
11.2.2 North America Basmati Rice Revenue (USD Million), by Type (2023-2030)
11.2.3 North America Basmati Rice Revenue (USD Million), Market Share (%) by Applications (2023-2030)
11.3 Europe Basmati Rice Revenue (USD Million), by Type, and Applications (2023-2030)
11.3.1 Europe Basmati Rice Revenue (USD Million), by Country (2023-2030)
11.3.2 Europe Basmati Rice Revenue (USD Million), by Type (2023-2030)
11.3.3 Europe Basmati Rice Revenue (USD Million), by Applications (2023-2030)
11.4 Asia Pacific Basmati Rice Revenue (USD Million) by Type, and Applications (2023-2030)
11.4.1 Asia Pacific Basmati Rice Revenue (USD Million), by Country (2023-2030)
11.4.2 Asia Pacific Basmati Rice Revenue (USD Million), by Type (2023-2030)
11.4.3 Asia Pacific Basmati Rice Revenue (USD Million), by Applications (2023-2030)
11.5 South America Basmati Rice Revenue (USD Million), by Type, and Applications (2023-2030)
11.5.1 South America Basmati Rice Revenue (USD Million), by Country (2023-2030)
11.5.2 South America Basmati Rice Revenue (USD Million), by Type (2023-2030)
11.5.3 South America Basmati Rice Revenue (USD Million), by Applications (2023-2030)
11.6 Middle East and Africa Basmati Rice Revenue (USD Million), by Type, and Applications (2023-2030)
11.6.1 Middle East and Africa Basmati Rice Revenue (USD Million), by Region (2023-2030)
11.6.2 Middle East and Africa Basmati Rice Revenue (USD Million), by Type (2023-2030)
11.6.3 Middle East and Africa Basmati Rice Revenue (USD Million), by Applications (2023-2030)
12 Methodology and Data Sources
12.1 Methodology/Research Approach
12.1.1 Research Programs/Design
12.1.2 Market Size Estimation
12.1.3 Market Breakdown and Data Triangulation
12.2 Data Sources
12.2.1 Secondary Sources
12.2.2 Primary Sources
12.3 Disclaimer
List of Tables
Table 1 Market Segmentation Analysis
Table 2 Global Basmati Rice Market Companies with Areas Served
Table 3 Products Offerings Global Basmati Rice Market
Table 4 Low Growth Scenario Forecasts
Table 5 Reference Case Growth Scenario
Table 6 High Growth Case Scenario
Table 7 Global Basmati Rice Revenue (USD Million) And CAGR (%) By Type (2018-2030)
Table 8 Global Basmati Rice Revenue (USD Million) And CAGR (%) By Applications (2018-2030)
Table 9 Global Basmati Rice Revenue (USD Million) And CAGR (%) By Regions (2018-2030)
Table 10 Global Basmati Rice Revenue (USD Million) By Type (2018-2022)
Table 11 Global Basmati Rice Revenue Market Share (%) By Type (2018-2022)
Table 12 Global Basmati Rice Revenue (USD Million) By Applications (2018-2022)
Table 13 Global Basmati Rice Revenue Market Share (%) By Applications (2018-2022)
Table 14 Global Basmati Rice Market Revenue (USD Million) By Regions (2018-2022)
Table 15 Global Basmati Rice Market Share (%) By Regions (2018-2022)
Table 16 North America Basmati Rice Revenue (USD Million) By Country (2018-2022)
Table 17 North America Basmati Rice Revenue (USD Million) By Type (2018-2022)
Table 18 North America Basmati Rice Revenue (USD Million) By Applications (2018-2022)
Table 19 Europe Basmati Rice Revenue (USD Million) By Country (2018-2022)
Table 20 Europe Basmati Rice Revenue (USD Million) By Type (2018-2022)
Table 21 Europe Basmati Rice Revenue (USD Million) By Applications (2018-2022)
Table 22 Asia Pacific Basmati Rice Revenue (USD Million) By Country (2018-2022)
Table 23 Asia Pacific Basmati Rice Revenue (USD Million) By Type (2018-2022)
Table 24 Asia Pacific Basmati Rice Revenue (USD Million) By Applications (2018-2022)
Table 25 South America Basmati Rice Revenue (USD Million) By Country (2018-2022)
Table 26 South America Basmati Rice Revenue (USD Million) By Type (2018-2022)
Table 27 South America Basmati Rice Revenue (USD Million) By Applications (2018-2022)
Table 28 Middle East and Africa Basmati Rice Revenue (USD Million) By Region (2018-2022)
Table 29 Middle East and Africa Basmati Rice Revenue (USD Million) By Type (2018-2022)
Table 30 Middle East and Africa Basmati Rice Revenue (USD Million) By Applications (2018-2022)
Table 31 Financial Analysis
Table 32 Global Basmati Rice Revenue (USD Million) By Type (2023-2030)
Table 33 Global Basmati Rice Revenue Market Share (%) By Type (2023-2030)
Table 34 Global Basmati Rice Revenue (USD Million) By Applications (2023-2030)
Table 35 Global Basmati Rice Revenue Market Share (%) By Applications (2023-2030)
Table 36 Global Basmati Rice Market Revenue (USD Million), And Revenue (USD Million) By Regions (2023-2030)
Table 37 North America Basmati Rice Revenue (USD)By Country (2023-2030)
Table 38 North America Basmati Rice Revenue (USD Million) By Type (2023-2030)
Table 39 North America Basmati Rice Revenue (USD Million) By Applications (2023-2030)
Table 40 Europe Basmati Rice Revenue (USD Million) By Country (2023-2030)
Table 41 Europe Basmati Rice Revenue (USD Million) By Type (2023-2030)
Table 42 Europe Basmati Rice Revenue (USD Million) By Applications (2023-2030)
Table 43 Asia Pacific Basmati Rice Revenue (USD Million) By Country (2023-2030)
Table 44 Asia Pacific Basmati Rice Revenue (USD Million) By Type (2023-2030)
Table 45 Asia Pacific Basmati Rice Revenue (USD Million) By Applications (2023-2030)
Table 46 South America Basmati Rice Revenue (USD Million) By Country (2023-2030)
Table 47 South America Basmati Rice Revenue (USD Million) By Type (2023-2030)
Table 48 South America Basmati Rice Revenue (USD Million) By Applications (2023-2030)
Table 49 Middle East and Africa Basmati Rice Revenue (USD Million) By Region (2023-2030)
Table 50 Middle East and Africa Basmati Rice Revenue (USD Million) By Region (2023-2030)
Table 51 Middle East and Africa Basmati Rice Revenue (USD Million) By Type (2023-2030)
Table 52 Middle East and Africa Basmati Rice Revenue (USD Million) By Applications (2023-2030)
Table 53 Research Programs/Design for This Report
Table 54 Key Data Information from Secondary Sources
Table 55 Key Data Information from Primary Sources
List of Figures
Figure 1 Market Scope
Figure 2 Porter’s Five Forces
Figure 3 Global Basmati Rice Revenue (USD Million) By Type (2018-2022)
Figure 4 Global Basmati Rice Revenue Market Share (%) By Type (2022)
Figure 5 Global Basmati Rice Revenue (USD Million) By Applications (2018-2022)
Figure 6 Global Basmati Rice Revenue Market Share (%) By Applications (2022)
Figure 7 Global Basmati Rice Market Revenue (USD Million) By Regions (2018-2022)
Figure 8 Global Basmati Rice Market Share (%) By Regions (2022)
Figure 9 North America Basmati Rice Revenue (USD Million) By Country (2018-2022)
Figure 10 North America Basmati Rice Revenue (USD Million) By Type (2018-2022)
Figure 11 North America Basmati Rice Revenue (USD Million) By Applications (2018-2022)
Figure 12 Europe Basmati Rice Revenue (USD Million) By Country (2018-2022)
Figure 13 Europe Basmati Rice Revenue (USD Million) By Type (2018-2022)
Figure 14 Europe Basmati Rice Revenue (USD Million) By Applications (2018-2022)
Figure 15 Asia Pacific Basmati Rice Revenue (USD Million) By Country (2018-2022)
Figure 16 Asia Pacific Basmati Rice Revenue (USD Million) By Type (2018-2022)
Figure 17 Asia Pacific Basmati Rice Revenue (USD Million) By Applications (2018-2022)
Figure 18 South America Basmati Rice Revenue (USD Million) By Country (2018-2022)
Figure 19 South America Basmati Rice Revenue (USD Million) By Type (2018-2022)
Figure 20 South America Basmati Rice Revenue (USD Million) By Applications (2018-2022)
Figure 21 Middle East and Africa Basmati Rice Revenue (USD Million) By Region (2018-2022)
Figure 22 Middle East and Africa Basmati Rice Revenue (USD Million) By Type (2018-2022)
Figure 23 Middle East and Africa Basmati Rice Revenue (USD Million) By Applications (2018-2022)
Figure 24 Global Basmati Rice Revenue (USD Million) By Type (2023-2030)
Figure 25 Global Basmati Rice Revenue Market Share (%) By Type (2030)
Figure 26 Global Basmati Rice Revenue (USD Million) By Applications (2023-2030)
Figure 27 Global Basmati Rice Revenue Market Share (%) By Applications (2030)
Figure 28 Global Basmati Rice Market Revenue (USD Million) By Regions (2023-2030)
Figure 29 North America Basmati Rice Revenue (USD Million) By Country (2023-2030)
Figure 30 North America Basmati Rice Revenue (USD Million) By Type (2023-2030)
Figure 31 North America Basmati Rice Revenue (USD Million) By Applications (2023-2030)
Figure 32 Europe Basmati Rice Revenue (USD Million) By Country (2023-2030)
Figure 33 Europe Basmati Rice Revenue (USD Million) By Type (2023-2030)
Figure 34 Europe Basmati Rice Revenue (USD Million) By Applications (2023-2030)
Figure 35 Asia Pacific Basmati Rice Revenue (USD Million) By Country (2023-2030)
Figure 36 Asia Pacific Basmati Rice Revenue (USD Million) By Type (2023-2030)
Figure 37 Asia Pacific Basmati Rice Revenue (USD Million) By Applications (2023-2030)
Figure 38 South America Basmati Rice Revenue (USD Million) By Country (2023-2030)
Figure 39 South America Basmati Rice Revenue (USD Million) By Type (2023-2030)
Figure 40 South America Basmati Rice Revenue (USD Million) By Applications (2023-2030)
Figure 41 Middle East and Africa Basmati Rice Revenue (USD Million) By Region (2023-2030)
Figure 42 Middle East and Africa Basmati Rice Revenue (USD Million) By Region (2023-2030)
Figure 43 Middle East and Africa Basmati Rice Revenue (USD Million) By Type (2023-2030)
Figure 44 Middle East and Africa Basmati Rice Revenue (USD Million) By Applications (2023-2030)
Figure 45 Bottom-Up and Top-Down Approaches For This Report
Figure 46 Data Triangulation
