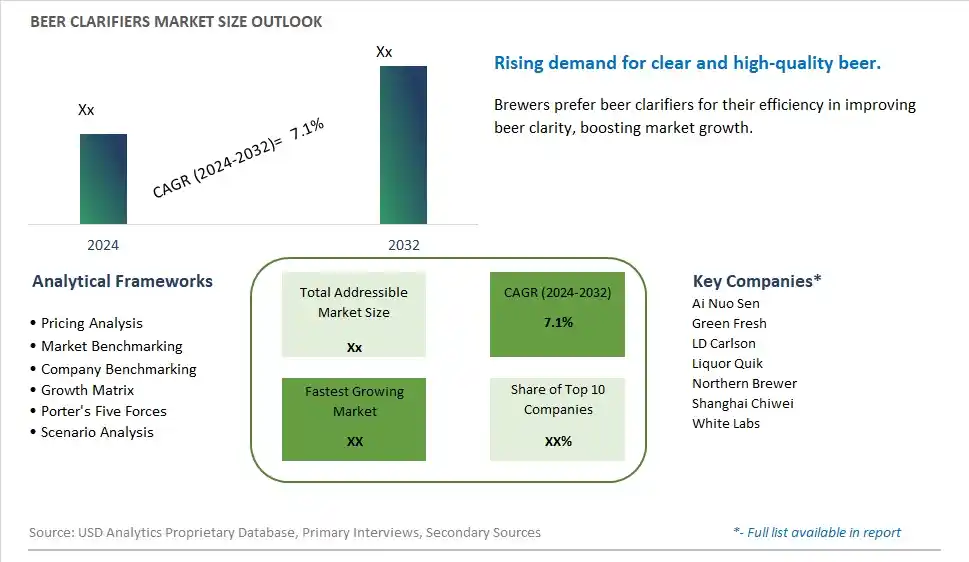
Global Beer Clarifiers Market Size is valued at $XX Million in 2024 and is forecast to register a growth rate (CAGR) of 7.1% to reach $XX Million by 2032.
The global Beer Clarifiers Market Comprehensive Study analyzes and forecasts the market size across 6 regions and 24 countries for diverse segments -By Type (Warm Beer Clarifiers, Cold Beer Clarifiers, Others), By Application (Ordinary Beer, Craft Beer)
An Introduction to Beer Clarifiers Market
The beer clarifiers market in 2024 is expanding rapidly, driven by the demand for high-quality clarifying agents used in brewing to improve beer clarity and stability. Beer clarifiers, including isinglass, silica gel, and PVPP, help remove haze-causing particles from beer. The market benefits from innovations in clarifier formulation and application technologies that enhance product efficacy and efficiency. The trend towards clean label and natural ingredients is influencing product development. Increasing consumer interest in craft and premium beers, supported by the popularity of homebrewing and small-batch production, is further propelling market growth.
Beer Clarifiers Competitive Landscape
The market report analyses the leading companies in the industry including Ai Nuo Sen, Green Fresh, LD Carlson, Liquor Quik, Northern Brewer, Shanghai Chiwei, White Labs, and Others.
Beer Clarifiers Market Dynamics
Beer Clarifiers Market Trend: Increasing Demand for High-Quality Craft Beers
The most prominent trend in the Beer Clarifiers Market is the increasing demand for high-quality craft beers. As consumers seek unique and premium beer experiences, there is a rising need for effective clarifying agents that enhance the appearance, taste, and stability of craft beers. This trend is driven by the growing popularity of craft brewing and the desire for visually appealing and flavorful beers.
Beer Clarifiers Market Driver: Growth in the Craft Brewing Industry
A key driver in the Beer Clarifiers Market is the growth of the craft brewing industry. Small and independent breweries are proliferating, leading to a higher demand for specialized brewing ingredients and processes. Beer clarifiers play a crucial role in achieving the desired clarity and quality in craft beers, supporting market growth as the craft brewing sector expands.
Beer Clarifiers Market Opportunity: Innovation in Natural and Eco-friendly Clarifiers
One significant opportunity in the Beer Clarifiers Market lies in innovation in natural and eco-friendly clarifiers. Companies can develop new clarifying agents derived from natural sources, such as plant extracts or sustainable materials, appealing to environmentally conscious brewers and consumers. By offering eco-friendly clarifiers that maintain beer quality, manufacturers can attract a growing segment of the market focused on sustainability.
Beer Clarifiers Market Share Analysis- Largest Segment by Type
In the Beer Clarifiers Market, Cold Beer Clarifiers are the largest segment. This is due to their effectiveness in stabilizing and clarifying beer at lower temperatures, which is essential for achieving the desired clarity and quality in chilled beer. Cold beer clarifiers, such as polyvinylpolypyrrolidone (PVPP) and silica gel, are widely used in the brewing industry to remove haze-forming proteins and polyphenols, ensuring a clear and aesthetically appealing final product. The preference for cold beer clarifiers is reinforced by their efficiency in both commercial and craft brewing applications, making them the dominant choice in the beer clarifiers market.
Beer Clarifiers Market Share Analysis- Poised to Grow Fastest Over the Next Five Years by Application
The Craft Beer application segment in the Beer Clarifiers Market is poised to grow the fastest over the next five years. This growth is driven by the rapid expansion of the craft beer industry, which is characterized by a diverse range of unique and artisanal beer styles. Craft brewers are increasingly adopting advanced clarifying agents to enhance the appearance and stability of their specialty beers, which often have higher haze potential due to the use of various grains and ingredients. The rising consumer demand for high-quality, visually appealing craft beers, coupled with the growing number of craft breweries, fuels this segment's rapid expansion in the beer clarifiers market.
Beer Clarifiers Market Segmentation
By Type
Warm Beer Clarifiers
Cold Beer Clarifiers
Others
By Application
Ordinary Beer
Craft Beer
Countries Analyzed
North America (US, Canada, Mexico)
Europe (Germany, UK, France, Spain, Italy, Russia, Rest of Europe)
Asia Pacific (China, India, Japan, South Korea, Australia, South East Asia, Rest of Asia)
South America (Brazil, Argentina, Rest of South America)
Middle East and Africa (Saudi Arabia, UAE, Rest of Middle East, South Africa, Egypt, Rest of Africa)
Beer Clarifiers Companies Profiled in the Study
Ai Nuo Sen
Green Fresh
LD Carlson
Liquor Quik
Northern Brewer
Shanghai Chiwei
White Labs
*- List Not Exhaustive
Chapter 1. TABLE OF CONTENTS
Chapter 2. Introduction to Beer Clarifiers Market
2.1. Market Overview
2.2. Key Statistics and Report Highlights
2.3. Scope of the Comprehensive Study
2.3.1. Market Definition
2.3.2 Countries and Regions Covered
2.3.3 Research Objective
2.3.4 Units, Currency, and Conversions
2.3.5 Industry Value Chain
2.4. Key Market Segments
2.5. Key Companies
2.6. Study Period
Chapter 3. Strategic Analysis Review
3.1. Beer Clarifiers Pricing Analysis and Forecast
3.2. Porter’s Five Forces
3.3. Market Ecosystem
3.4. SWOT Analysis
3.5. Regulatory Scenario
3.3. Effects of Inflation, Russia-Ukraine War, moderating economic growth, and other macroeconomic factors
Chapter 4. Competitive Landscape
4.1. Market Share Analysis
4.1.1. Global Beer Clarifiers Market Share by Company, 2023
4.1.2. Product Offerings of Leading Beer Clarifiers Companies
4.2. Market Entropy
4.2.1. New Product Launches in the Industry
4.2.2. Mergers, Acquisitions, Joint ventures, and Partnerships
4.3. Key Strategies and Best Practices
Chapter 5. Global Market Projections: Best, Reference, and Low Case Scenarios
5.1. Growth Analysis- Case Scenario Definitions
5.2. Low Growth Case Scenario Forecasts
5.3. Reference Growth Case Scenario Forecasts
5.4. High Growth Case Scenario Forecasts
Chapter 6. Market Dynamics
6.1. Beer Clarifiers Market Drivers
6.2. Beer Clarifiers Market Challenges
6.6. Beer Clarifiers Market Opportunities
6.4. Beer Clarifiers Market Trends
Chapter 7. Global Beer Clarifiers Market Outlook Trends
7.1. Global Beer Clarifiers Revenue (USD Million) and CAGR (%) by Type (2021-2032)
7.2. Global Beer Clarifiers Revenue (USD Million) and CAGR (%) by Application (2021-2032)
7.3. Global Beer Clarifiers Revenue (USD Million) and CAGR (%) by Product (2021-2032)
By Type
Warm Beer Clarifiers
Cold Beer Clarifiers
Others
By Application
Ordinary Beer
Craft Beer
Chapter 8. Global Beer Clarifiers Regional Analysis and Outlook
8.1. Global Beer Clarifiers Revenue (USD Million) By Regions (2021- 2032)
8.2. North America Beer Clarifiers Revenue (USD Million) by Country (2021-2032)
8.2.1. United States Beer Clarifiers Regional Analysis and Outlook
8.2.2. Canada Beer Clarifiers Regional Analysis and Outlook
8.2.3. Mexico Beer Clarifiers Regional Analysis and Outlook
8.3. Europe Beer Clarifiers Revenue (USD Million), by Country (2021-2032)
8.3.1. Germany Beer Clarifiers Regional Analysis and Outlook
8.3.2. France Beer Clarifiers Regional Analysis and Outlook
8.3.3. United Kingdom Beer Clarifiers Regional Analysis and Outlook
8.3.4. Spain Beer Clarifiers Regional Analysis and Outlook
8.3.5. Italy Beer Clarifiers Regional Analysis and Outlook
8.3.6. Russia Beer Clarifiers Regional Analysis and Outlook
8.3.7. Rest of Europe Beer Clarifiers Regional Analysis and Outlook
8.4. Asia Pacific Beer Clarifiers Revenue (USD Million) by Country (2021-2032)
8.4.1. China Beer Clarifiers Regional Analysis and Outlook
8.4.2. Japan Beer Clarifiers Regional Analysis and Outlook
8.4.3. India Beer Clarifiers Regional Analysis and Outlook
8.4.4. South Korea Beer Clarifiers Regional Analysis and Outlook
8.4.5. Australia Beer Clarifiers Regional Analysis and Outlook
8.4.6. South East Asia Beer Clarifiers Regional Analysis and Outlook
8.4.7. Rest of Asia Pacific Beer Clarifiers Regional Analysis and Outlook
8.5. South America Beer Clarifiers Revenue (USD Million), by Country (2021-2032)
8.5.1. Brazil Beer Clarifiers Regional Analysis and Outlook
8.5.2. Argentina Beer Clarifiers Regional Analysis and Outlook
8.5.3. Rest of South America Beer Clarifiers Regional Analysis and Outlook
8.6. Middle East and Africa Beer Clarifiers Revenue (USD Million) by Country (2021-2032)
8.6.1. Middle East Beer Clarifiers Regional Analysis and Outlook
8.6.2. Africa Beer Clarifiers Regional Analysis and Outlook
Chapter 9. North America Beer Clarifiers Analysis and Outlook
9.1. North America Beer Clarifiers Revenue (USD Million) by Segments (2021-2032)
9.1.1. North America Beer Clarifiers Revenue (USD Million) by Type (2021-2032)
9.1.2. North America Beer Clarifiers Revenue (USD Million) by Application (2021-2032)
9.1.3. North America Beer Clarifiers Revenue (USD Million) by Product (2021-2032)
By Type
Warm Beer Clarifiers
Cold Beer Clarifiers
Others
By Application
Ordinary Beer
Craft Beer
Chapter 10. Europe Beer Clarifiers Analysis and Outlook
10.1. Europe Beer Clarifiers Revenue (USD Million), by Segments (USD Million) (2021-2032)
10.1.1. Europe Beer Clarifiers Revenue (USD Million) by Type (2021-2032)
10.1.2. Europe Beer Clarifiers Revenue (USD Million) by Application (2021-2032)
10.1.3. Europe Beer Clarifiers Revenue (USD Million) by Product (2021-2032)
By Type
Warm Beer Clarifiers
Cold Beer Clarifiers
Others
By Application
Ordinary Beer
Craft Beer
Chapter 11. Asia Pacific Beer Clarifiers Analysis and Outlook
11.1. Asia Pacific Beer Clarifiers Revenue (USD Million), and Revenue (USD Million) by Segments (2021-2032)
11.1.1. Asia Pacific Beer Clarifiers Revenue (USD Million) by Type (2021-2032)
11.1.2. Asia Pacific Beer Clarifiers Revenue (USD Million) by Application (2021-2032)
11.1.3. Asia Pacific Beer Clarifiers Revenue (USD Million) by Product (2021-2032)
By Type
Warm Beer Clarifiers
Cold Beer Clarifiers
Others
By Application
Ordinary Beer
Craft Beer
Chapter 12. South America Beer Clarifiers Analysis and Outlook
12.1. South America Beer Clarifiers Revenue (USD Million), by Segments (2021-2032)
12.1.1. South America Beer Clarifiers Revenue (USD Million) by Type (2021-2032)
12.1.2. South America Beer Clarifiers Revenue (USD Million) by Application (2021-2032)
12.1.3. South America Beer Clarifiers Revenue (USD Million) by Product (2021-2032)
By Type
Warm Beer Clarifiers
Cold Beer Clarifiers
Others
By Application
Ordinary Beer
Craft Beer
Chapter 13. Middle East and Africa Beer Clarifiers Analysis and Outlook
13.1. Middle East and Africa Beer Clarifiers Revenue (USD Million), by Segments (2021-2032)
13.1.1. Middle East and Africa Beer Clarifiers Revenue (USD Million) by Type (2021-2032)
13.1.2. Middle East and Africa Beer Clarifiers Revenue (USD Million) by Application (2021-2032)
13.1.3. Middle East and Africa Beer Clarifiers Revenue (USD Million) by Product (2021-2032)
By Type
Warm Beer Clarifiers
Cold Beer Clarifiers
Others
By Application
Ordinary Beer
Craft Beer
Chapter 14. Beer Clarifiers Company Profiles
14.1 Business Overview
14.2 Product Profiles
14.3 SWOT Profiles
14.5 Recent Developments
14.6 Financial Profile
List of Companies
Ai Nuo Sen
Green Fresh
LD Carlson
Liquor Quik
Northern Brewer
Shanghai Chiwei
White Labs
15. Methodology and Data Sources
15.1 Customization Offerings
15.2 Subscription Services
15.3 Related Reports
15.4 Publisher Expertise
LIST OF TABLES
Table 1 Market Segmentation Analysis
Table 2 Global Beer Clarifiers Market Share of Leading Companies, 2023
Table 3 Product Offerings of Leading Companies
Table 4 Low Growth Scenario Forecasts
Table 5 Reference Case Growth Scenario
Table 6 High Growth Case Scenario
Table 7 Global Beer Clarifiers Revenue (USD Million) And CAGR (%) By Type (2021-2032)
Table 8 Global Beer Clarifiers Revenue (USD Million) And CAGR (%) By Application (2021-2032)
Table 9 Global Beer Clarifiers Revenue (USD Million) And CAGR (%) By Product (2021-2032)
Table 10 Global Beer Clarifiers Market Revenue (USD Million) By Regions (2021-2032)
Table 11 Global Beer Clarifiers Market Share (%) By Regions (2021-2032)
Table 12 North America Beer Clarifiers Revenue (USD Million) By Country (2021-2032)
Table 13 Europe Beer Clarifiers Revenue (USD Million) By Country (2021-2032)
Table 14 Asia Pacific Beer Clarifiers Revenue (USD Million) By Country (2021-2032)
Table 15 South America Beer Clarifiers Revenue (USD Million) By Country (2021-2032)
Table 16 Middle East and Africa Beer Clarifiers Revenue (USD Million) By Region (2021-2032)
Table 17 North America Beer Clarifiers Revenue (USD Million) By Type (2021-2032)
Table 18 North America Beer Clarifiers Revenue (USD Million) By Application (2021-2032)
Table 19 North America Beer Clarifiers Revenue (USD Million) By Product (2021-2032)
Table 20 Europe Beer Clarifiers Revenue (USD Million) By Type (2021-2032)
Table 21 Europe Beer Clarifiers Revenue (USD Million) By Application (2021-2032)
Table 22 Europe Beer Clarifiers Revenue (USD Million) By Product (2021-2032)
Table 23 Asia Pacific Beer Clarifiers Revenue (USD Million) By Type (2021-2032)
Table 24 Asia Pacific Beer Clarifiers Revenue (USD Million) By Application (2021-2032)
Table 25 Asia Pacific Beer Clarifiers Revenue (USD Million) By Product (2021-2032)
Table 26 South America Beer Clarifiers Revenue (USD Million) By Type (2021-2032)
Table 27 South America Beer Clarifiers Revenue (USD Million) By Application (2021-2032)
Table 28 South America Beer Clarifiers Revenue (USD Million) By Product (2021-2032)
Table 29 Middle East and Africa Beer Clarifiers Revenue (USD Million) By Type (2021-2032)
Table 30 Middle East and Africa Beer Clarifiers Revenue (USD Million) By Application (2021-2032)
Table 31 Middle East and Africa Beer Clarifiers Revenue (USD Million) By Product (2021-2032)
LIST OF FIGURES
Figure 1. Market Scope
Figure 2. Pricing Forecasts Per Unit, 2023- 2032
Figure 3. Porter’s Five Forces
Figure 4. Global Beer Clarifiers Market Revenue (USD Million) By Regions (2021-2032)
Figure 5. Global Beer Clarifiers Market Share (%) By Regions (2023)
Figure 6. North America Beer Clarifiers Revenue (USD Million) By Country (2021-2032)
Figure 7. United States Beer Clarifiers Revenue (USD Million) By Country (2021-2032)
Figure 8. Canada Beer Clarifiers Revenue (USD Million) By Country (2021-2032)
Figure 9. Mexico Beer Clarifiers Revenue (USD Million) By Country (2021-2032)
Figure 10. Europe Beer Clarifiers Revenue (USD Million) By Country (2021-2032)
Figure 11. Germany Beer Clarifiers Revenue (USD Million) By Country (2021-2032)
Figure 12. France Beer Clarifiers Revenue (USD Million) By Country (2021-2032)
Figure 13. United Kingdom Beer Clarifiers Revenue (USD Million) By Country (2021-2032)
Figure 14. Spain Beer Clarifiers Revenue (USD Million) By Country (2021-2032)
Figure 15. Italy Beer Clarifiers Revenue (USD Million) By Country (2021-2032)
Figure 16. Russia Beer Clarifiers Revenue (USD Million) By Country (2021-2032)
Figure 17. Rest of Europe Beer Clarifiers Revenue (USD Million) By Country (2021-2032)
Figure 11. Asia Pacific Beer Clarifiers Revenue (USD Million) By Country (2021-2032)
Figure 12. China Beer Clarifiers Revenue (USD Million) By Country (2021-2032)
Figure 13. Japan Beer Clarifiers Revenue (USD Million) By Country (2021-2032)
Figure 14. India Beer Clarifiers Revenue (USD Million) By Country (2021-2032)
Figure 15. South Korea Beer Clarifiers Revenue (USD Million) By Country (2021-2032)
Figure 16. Australia Beer Clarifiers Revenue (USD Million) By Country (2021-2032)
Figure 17. South East Asia Beer Clarifiers Revenue (USD Million) By Country (2021-2032)
Figure 18. South America Beer Clarifiers Revenue (USD Million) By Country (2021-2032)
Figure 19. Brazil Beer Clarifiers Revenue (USD Million) By Country (2021-2032)
Figure 20. Argentina Beer Clarifiers Revenue (USD Million) By Country (2021-2032)
Figure 21. Rest of Asia Pacific Beer Clarifiers Revenue (USD Million) By Country (2021-2032)
Figure 22. Middle East and Africa Beer Clarifiers Revenue (USD Million) By Region (2021-2032)
Figure 23. Saudi Arabia Beer Clarifiers Revenue (USD Million) By Region (2021-2032)
Figure 24. The UAE Beer Clarifiers Revenue (USD Million) By Region (2021-2032)
Figure 25. Rest of Middle East Beer Clarifiers Revenue (USD Million) By Region (2021-2032)
Figure 26. South Africa Beer Clarifiers Revenue (USD Million) By Region (2021-2032)
Figure 27. Africa Beer Clarifiers Revenue (USD Million) By Region (2021-2032)
Figure 28. North America Beer Clarifiers Revenue (USD Million) By Type (2021-2032)
Figure 29. North America Beer Clarifiers Revenue (USD Million) By Application (2021-2032)
Figure 30. North America Beer Clarifiers Revenue (USD Million) By Product (2021-2032)
Figure 31. Europe Beer Clarifiers Revenue (USD Million) By Type (2021-2032)
Figure 32. Europe Beer Clarifiers Revenue (USD Million) By Application (2021-2032)
Figure 33. Europe Beer Clarifiers Revenue (USD Million) By Product (2021-2032)
Figure 34. Asia Pacific Beer Clarifiers Revenue (USD Million) By Type (2021-2032)
Figure 35. Asia Pacific Beer Clarifiers Revenue (USD Million) By Application (2021-2032)
Figure 36. Asia Pacific Beer Clarifiers Revenue (USD Million) By Product (2021-2032)
Figure 37. South America Beer Clarifiers Revenue (USD Million) By Type (2021-2032)
Figure 38. South America Beer Clarifiers Revenue (USD Million) By Application (2021-2032)
Figure 39. South America Beer Clarifiers Revenue (USD Million) By Product (2021-2032)
Figure 40. Middle East and Africa Beer Clarifiers Revenue (USD Million) By Type (2021-2032)
Figure 41. Middle East and Africa Beer Clarifiers Revenue (USD Million) By Application (2021-2032)
Figure 42. Middle East and Africa Beer Clarifiers Revenue (USD Million) By Product (2021-2032)
By Type
Warm Beer Clarifiers
Cold Beer Clarifiers
Others
By Application
Ordinary Beer
Craft Beer
Countries Analyzed
North America (US, Canada, Mexico)
Europe (Germany, UK, France, Spain, Italy, Russia, Rest of Europe)
Asia Pacific (China, India, Japan, South Korea, Australia, South East Asia, Rest of Asia)
South America (Brazil, Argentina, Rest of South America)
Middle East and Africa (Saudi Arabia, UAE, Rest of Middle East, South Africa, Egypt, Rest of Africa)
