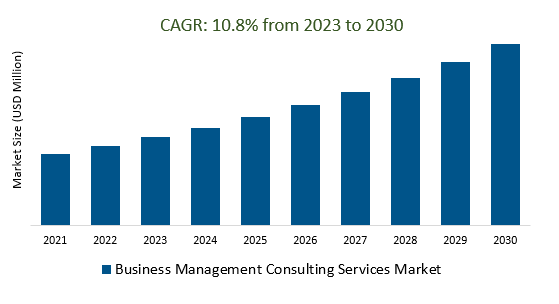
The Global Business Management Consulting Services Market Size is estimated to register 10.8% growth over the forecast period from 2023 to 2030.
The Business Management Consulting Services Market is shaped by various drivers and trends, including digital transformation, globalization, data analytics and AI, sustainability, cybersecurity, change management, industry-specific expertise, remote work and collaboration tools, supply chain resilience, customer experience enhancement, regulatory compliance, cost optimization, M&A advisory, remote consulting services, and diversity, equity, and inclusion (DEI). These services help businesses navigate digital transformation, navigate complex global markets, develop sustainable practices, assess vulnerabilities, implement security measures, and respond to cyber incidents. They also help businesses navigate changes due to mergers, acquisitions, restructuring, or cultural shifts.
Unlocking Value Through Data Analytics and AI Consulting Services is boosting the market.
Organizations strive to remain competitive and adapt to the rapidly evolving business landscape, they recognize the need to harness the power of data and artificial intelligence. Consulting firms specializing in these areas are playing a pivotal role in helping businesses unlock new opportunities, optimize operations, and make data-driven decisions. This surge in demand for data analytics and AI consulting services underscores their pivotal role in shaping the future of business management consulting. As industries continue to digitize and embrace technology, these services are becoming indispensable for achieving sustainable growth and innovation.
Achieving Success by Harnessing Industry-Specific Expertise is creating a demand in the market.
In the ever-evolving landscape of the Business Management Consulting Services Market, the key to achieving remarkable success lies in harnessing industry-specific expertise. Companies are increasingly recognizing the significance of partnering with consultants who possess in-depth knowledge and insights tailored to their particular sector. This demand surge is driven by the realization that specialized expertise not only streamlines decision-making but also ensures a competitive edge in a rapidly changing business environment. As industries become more complex, businesses seek consultants who can navigate the intricacies of their specific sectors, offering solutions and strategies that are finely tuned to address unique challenges. Consequently, this trend is reshaping the consulting services market, with industry-focused consultants at the forefront of innovation and growth.
Navigating the Complex Landscape of Regulatory Compliance is attracting a wide customer base.
Navigating the Complex Landscape of Regulatory Compliance has emerged as a highly sought-after service in the Business Management Consulting Services Market. This trend can be attributed to the growing complexity of regulatory frameworks across industries. Businesses are increasingly seeking expert guidance to ensure they remain compliant with evolving regulations, avoid legal complications, and maintain their reputation. As a result, a diverse range of companies, from startups to large enterprises, are turning to consulting firms specializing in regulatory compliance. This surge in demand underscores the critical role these services play in helping businesses navigate the intricate web of rules and regulations, ultimately contributing to their long-term success and sustainability.
Market Share Analysis:
Strategy advisory services hold a dominant position in the business management consulting services market.
The services play a crucial role in guiding organizations towards achieving their business objectives by offering expertise in areas like market research, competitive analysis, scenario planning, and strategic development. Given the ever-changing business landscape, there is a substantial demand for strategy consultants who can help companies adapt to new challenges, discover fresh opportunities, create innovative products and services, and explore untapped markets. This growth in the strategy consulting sector is attributed to several factors, including the rising complexity of the business environment, the imperative for businesses to foster innovation, and the increasing emphasis on sustainability.
The most dominant client segment in the business management consulting services market is the above 5000 million market capitalization segment.
The dominant client segment in the business management consulting services market is companies with market capitalizations exceeding $5 billion. These large corporations are the primary beneficiaries of consulting services due to their substantial resources and complex business needs. They often seek assistance in various areas such as strategy development, operational efficiency enhancement, financial performance improvement, human capital management, and technology integration. In 2023, this above $5 billion market capitalization segment is projected to maintain its prominence, with an estimated 10.2% compound annual growth rate (CAGR) from 2022 to 2031. This growth can be attributed to the increasing complexity of business challenges, the necessity for large companies to maintain a competitive edge, and the growing recognition of the advantages offered by management consulting services.
The IT and Telecommunication sector stands out as the predominant end-user segment within the Business Management Consulting Services Market.
The IT and Telecommunication industry is known for its rapid pace of technological advancements and innovations, which constantly necessitate strategic guidance and expert consulting to remain competitive. These companies require assistance in areas like digital transformation, cybersecurity, data analytics, and cloud computing strategy. Secondly, the increasing complexity of global telecommunications networks, along with the continuous evolution of digital infrastructure, demands specialized consulting services to optimize operations and navigate regulatory challenges effectively. Thirdly, the IT and Telecommunication sector is critical to the functioning of various other industries, serving as the backbone for modern businesses. Consequently, any disruptions or inefficiencies within this sector can have cascading effects on other industries, further emphasizing the need for expert consulting. Lastly, the sector's contribution to the global economy is substantial, making it a significant driver for the business management consulting market. Its reliance on consulting services to adapt to ever-changing market dynamics and technological landscapes solidifies its position as the predominant end-user segment in the Business Management Consulting Services Market.
North America holds a prominent position in the business management consulting services market.
The region boasts a significant concentration of multinational corporations eager to leverage consulting services for strategic growth. Furthermore, North America experiences robust demand for consulting expertise across various industries, including financial services, healthcare, and IT, underpinning its dominance. Additionally, the region benefits from a substantial talent pool of experienced and highly skilled consultants, contributing to its status as a leading hub for business management consulting services.
Business Management Consulting Services Market Segmentation
By Type
- Operations Advisory
- Financial Advisory
- Technology Advisory
- Strategy Advisory
- HR Advisory
By Client’s Market Capitalization
- Less than 300 million
- 300 to 2000 million
- 2000 to 5000 million
- Above 5000 million
By End-User
- IT and Telecommunication
- Healthcare
- Hotel
- Media and Entertainment
- Real Estate
- Other
By Region
- North America (United States, Canada, Mexico)
- Europe (Germany, France, United Kingdom, Spain, Italy, Others)
- Asia Pacific (China, India, Japan, South Korea, Australia, Others)
- Latin America (Brazil, Argentina, Others)
- Middle East and Africa (Saudi Arabia, UAE, Kuwait, Other Middle East, South Africa, Nigeria, Other Africa)
Business Management Consulting Services Market Companies
- McKinsey & Company
- Deloitte Consulting
- Bain & Company
- Booz Allen Hamilton
- The Boston Consulting Group
- KPMG International
- Accenture
- IBM Global Business Service
- Barkawi Management Consultants
- Ramboll Group
- Solon Management Consulting
- Pöyry PLC
- Implement Consulting Group
- Management Consulting Group PLC
- Altair
*List not exhaustive
Business Management Consulting Services Market Outlook 2023
1 Market Overview
1.1 Introduction to the Business Management Consulting Services Market
1.2 Scope of the Study
1.3 Research Objective
1.3.1 Key Market Scope and Segments
1.3.2 Players Covered
1.3.3 Years Considered
2 Executive Summary
2.1 2023 Business Management Consulting Services Industry- Market Statistics
3 Market Dynamics
3.1 Market Drivers
3.2 Market Challenges
3.3 Market Opportunities
3.4 Market Trends
4 Market Factor Analysis
4.1 Porter’s Five Forces
4.2 Market Entropy
4.2.1 Global Business Management Consulting Services Market Companies with Area Served
4.2.2 Products Offerings Global Business Management Consulting Services Market
5 COVID-19 Impact Analysis and Outlook Scenarios
5.1.1 Covid-19 Impact Analysis
5.1.2 Post-COVID-19 Scenario- Low Growth Case
5.1.3 Post-COVID-19 Scenario- Reference Growth Case
5.1.4 Post-COVID-19 Scenario- Low Growth Case
6 Global Business Management Consulting Services Market Trends
6.1 Global Business Management Consulting Services Revenue (USD Million) and CAGR (%) by Type (2018-2030)
6.2 Global Business Management Consulting Services Revenue (USD Million) and CAGR (%) by Applications (2018-2030)
6.3 Global Business Management Consulting Services Revenue (USD Million) and CAGR (%) by Regions (2018-2030)
7 Global Business Management Consulting Services Market Revenue (USD Million) by Type, and Applications (2018-2022)
7.1 Global Business Management Consulting Services Revenue (USD Million) by Type (2018-2022)
7.1.1 Global Business Management Consulting Services Revenue (USD Million), Market Share (%) by Type (2018-2022)
7.2 Global Business Management Consulting Services Revenue (USD Million) by Applications (2018-2022)
7.2.1 Global Business Management Consulting Services Revenue (USD Million), Market Share (%) by Applications (2018-2022)
8 Global Business Management Consulting Services Development Regional Status and Outlook
8.1 Global Business Management Consulting Services Revenue (USD Million) By Regions (2018-2022)
8.2 North America Business Management Consulting Services Revenue (USD Million) by Type, and Application (2018-2022)
8.2.1 North America Business Management Consulting Services Revenue (USD Million) by Country (2018-2022)
8.2.2 North America Business Management Consulting Services Revenue (USD Million) by Type (2018-2022)
8.2.3 North America Business Management Consulting Services Revenue (USD Million) by Applications (2018-2022)
8.3 Europe Business Management Consulting Services Revenue (USD Million), by Type, and Applications (USD Million) (2018-2022)
8.3.1 Europe Business Management Consulting Services Revenue (USD Million), by Country (2018-2022)
8.3.2 Europe Business Management Consulting Services Revenue (USD Million) by Type (2018-2022)
8.3.3 Europe Business Management Consulting Services Revenue (USD Million) by Applications (2018-2022)
8.4 Asia Pacific Business Management Consulting Services Revenue (USD Million), and Revenue (USD Million) by Type, and Applications (2018-2022)
8.4.1 Asia Pacific Business Management Consulting Services Revenue (USD Million) by Country (2018-2022)
8.4.2 Asia Pacific Business Management Consulting Services Revenue (USD Million) by Type (2018-2022)
8.4.3 Asia Pacific Business Management Consulting Services Revenue (USD Million) by Applications (2018-2022)
8.5 South America Business Management Consulting Services Revenue (USD Million), by Type, and Applications (2018-2022)
8.5.1 South America Business Management Consulting Services Revenue (USD Million), by Country (2018-2022)
8.5.2 South America Business Management Consulting Services Revenue (USD Million) by Type (2018-2022)
8.5.3 South America Business Management Consulting Services Revenue (USD Million) by Applications (2018-2022)
8.6 Middle East and Africa Business Management Consulting Services Revenue (USD Million), by Type, Technology, Application, Thickness (2018-2022)
8.6.1 Middle East and Africa Business Management Consulting Services Revenue (USD Million) by Country (2018-2022)
8.6.2 Middle East and Africa Business Management Consulting Services Revenue (USD Million) by Type (2018-2022)
8.6.3 Middle East and Africa Business Management Consulting Services Revenue (USD Million) by Applications (2018-2022)
9 Company Profiles
10 Global Business Management Consulting Services Market Revenue (USD Million), by Type, and Applications (2023-2030)
10.1 Global Business Management Consulting Services Revenue (USD Million) and Market Share (%) by Type (2023-2030)
10.1.1 Global Business Management Consulting Services Revenue (USD Million), and Market Share (%) by Type (2023-2030)
10.2 Global Business Management Consulting Services Revenue (USD Million) and Market Share (%) by Applications (2023-2030)
10.2.1 Global Business Management Consulting Services Revenue (USD Million), and Market Share (%) by Applications (2023-2030)
11 Global Business Management Consulting Services Development Regional Status and Outlook Forecast
11.1 Global Business Management Consulting Services Revenue (USD Million) By Regions (2023-2030)
11.2 North America Business Management Consulting Services Revenue (USD Million) by Type, and Applications (2023-2030)
11.2.1 North America Business Management Consulting Services Revenue (USD) Million by Country (2023-2030)
11.2.2 North America Business Management Consulting Services Revenue (USD Million), by Type (2023-2030)
11.2.3 North America Business Management Consulting Services Revenue (USD Million), Market Share (%) by Applications (2023-2030)
11.3 Europe Business Management Consulting Services Revenue (USD Million), by Type, and Applications (2023-2030)
11.3.1 Europe Business Management Consulting Services Revenue (USD Million), by Country (2023-2030)
11.3.2 Europe Business Management Consulting Services Revenue (USD Million), by Type (2023-2030)
11.3.3 Europe Business Management Consulting Services Revenue (USD Million), by Applications (2023-2030)
11.4 Asia Pacific Business Management Consulting Services Revenue (USD Million) by Type, and Applications (2023-2030)
11.4.1 Asia Pacific Business Management Consulting Services Revenue (USD Million), by Country (2023-2030)
11.4.2 Asia Pacific Business Management Consulting Services Revenue (USD Million), by Type (2023-2030)
11.4.3 Asia Pacific Business Management Consulting Services Revenue (USD Million), by Applications (2023-2030)
11.5 South America Business Management Consulting Services Revenue (USD Million), by Type, and Applications (2023-2030)
11.5.1 South America Business Management Consulting Services Revenue (USD Million), by Country (2023-2030)
11.5.2 South America Business Management Consulting Services Revenue (USD Million), by Type (2023-2030)
11.5.3 South America Business Management Consulting Services Revenue (USD Million), by Applications (2023-2030)
11.6 Middle East and Africa Business Management Consulting Services Revenue (USD Million), by Type, and Applications (2023-2030)
11.6.1 Middle East and Africa Business Management Consulting Services Revenue (USD Million), by Region (2023-2030)
11.6.2 Middle East and Africa Business Management Consulting Services Revenue (USD Million), by Type (2023-2030)
11.6.3 Middle East and Africa Business Management Consulting Services Revenue (USD Million), by Applications (2023-2030)
12 Methodology and Data Sources
12.1 Methodology/Research Approach
12.1.1 Research Programs/Design
12.1.2 Market Size Estimation
12.1.3 Market Breakdown and Data Triangulation
12.2 Data Sources
12.2.1 Secondary Sources
12.2.2 Primary Sources
12.3 Disclaimer
List of Tables
Table 1 Market Segmentation Analysis
Table 2 Global Business Management Consulting Services Market Companies with Areas Served
Table 3 Products Offerings Global Business Management Consulting Services Market
Table 4 Low Growth Scenario Forecasts
Table 5 Reference Case Growth Scenario
Table 6 High Growth Case Scenario
Table 7 Global Business Management Consulting Services Revenue (USD Million) And CAGR (%) By Type (2018-2030)
Table 8 Global Business Management Consulting Services Revenue (USD Million) And CAGR (%) By Applications (2018-2030)
Table 9 Global Business Management Consulting Services Revenue (USD Million) And CAGR (%) By Regions (2018-2030)
Table 10 Global Business Management Consulting Services Revenue (USD Million) By Type (2018-2022)
Table 11 Global Business Management Consulting Services Revenue Market Share (%) By Type (2018-2022)
Table 12 Global Business Management Consulting Services Revenue (USD Million) By Applications (2018-2022)
Table 13 Global Business Management Consulting Services Revenue Market Share (%) By Applications (2018-2022)
Table 14 Global Business Management Consulting Services Market Revenue (USD Million) By Regions (2018-2022)
Table 15 Global Business Management Consulting Services Market Share (%) By Regions (2018-2022)
Table 16 North America Business Management Consulting Services Revenue (USD Million) By Country (2018-2022)
Table 17 North America Business Management Consulting Services Revenue (USD Million) By Type (2018-2022)
Table 18 North America Business Management Consulting Services Revenue (USD Million) By Applications (2018-2022)
Table 19 Europe Business Management Consulting Services Revenue (USD Million) By Country (2018-2022)
Table 20 Europe Business Management Consulting Services Revenue (USD Million) By Type (2018-2022)
Table 21 Europe Business Management Consulting Services Revenue (USD Million) By Applications (2018-2022)
Table 22 Asia Pacific Business Management Consulting Services Revenue (USD Million) By Country (2018-2022)
Table 23 Asia Pacific Business Management Consulting Services Revenue (USD Million) By Type (2018-2022)
Table 24 Asia Pacific Business Management Consulting Services Revenue (USD Million) By Applications (2018-2022)
Table 25 South America Business Management Consulting Services Revenue (USD Million) By Country (2018-2022)
Table 26 South America Business Management Consulting Services Revenue (USD Million) By Type (2018-2022)
Table 27 South America Business Management Consulting Services Revenue (USD Million) By Applications (2018-2022)
Table 28 Middle East and Africa Business Management Consulting Services Revenue (USD Million) By Region (2018-2022)
Table 29 Middle East and Africa Business Management Consulting Services Revenue (USD Million) By Type (2018-2022)
Table 30 Middle East and Africa Business Management Consulting Services Revenue (USD Million) By Applications (2018-2022)
Table 31 Financial Analysis
Table 32 Global Business Management Consulting Services Revenue (USD Million) By Type (2023-2030)
Table 33 Global Business Management Consulting Services Revenue Market Share (%) By Type (2023-2030)
Table 34 Global Business Management Consulting Services Revenue (USD Million) By Applications (2023-2030)
Table 35 Global Business Management Consulting Services Revenue Market Share (%) By Applications (2023-2030)
Table 36 Global Business Management Consulting Services Market Revenue (USD Million), And Revenue (USD Million) By Regions (2023-2030)
Table 37 North America Business Management Consulting Services Revenue (USD)By Country (2023-2030)
Table 38 North America Business Management Consulting Services Revenue (USD Million) By Type (2023-2030)
Table 39 North America Business Management Consulting Services Revenue (USD Million) By Applications (2023-2030)
Table 40 Europe Business Management Consulting Services Revenue (USD Million) By Country (2023-2030)
Table 41 Europe Business Management Consulting Services Revenue (USD Million) By Type (2023-2030)
Table 42 Europe Business Management Consulting Services Revenue (USD Million) By Applications (2023-2030)
Table 43 Asia Pacific Business Management Consulting Services Revenue (USD Million) By Country (2023-2030)
Table 44 Asia Pacific Business Management Consulting Services Revenue (USD Million) By Type (2023-2030)
Table 45 Asia Pacific Business Management Consulting Services Revenue (USD Million) By Applications (2023-2030)
Table 46 South America Business Management Consulting Services Revenue (USD Million) By Country (2023-2030)
Table 47 South America Business Management Consulting Services Revenue (USD Million) By Type (2023-2030)
Table 48 South America Business Management Consulting Services Revenue (USD Million) By Applications (2023-2030)
Table 49 Middle East and Africa Business Management Consulting Services Revenue (USD Million) By Region (2023-2030)
Table 50 Middle East and Africa Business Management Consulting Services Revenue (USD Million) By Region (2023-2030)
Table 51 Middle East and Africa Business Management Consulting Services Revenue (USD Million) By Type (2023-2030)
Table 52 Middle East and Africa Business Management Consulting Services Revenue (USD Million) By Applications (2023-2030)
Table 53 Research Programs/Design for This Report
Table 54 Key Data Information from Secondary Sources
Table 55 Key Data Information from Primary Sources
List of Figures
Figure 1 Market Scope
Figure 2 Porter’s Five Forces
Figure 3 Global Business Management Consulting Services Revenue (USD Million) By Type (2018-2022)
Figure 4 Global Business Management Consulting Services Revenue Market Share (%) By Type (2022)
Figure 5 Global Business Management Consulting Services Revenue (USD Million) By Applications (2018-2022)
Figure 6 Global Business Management Consulting Services Revenue Market Share (%) By Applications (2022)
Figure 7 Global Business Management Consulting Services Market Revenue (USD Million) By Regions (2018-2022)
Figure 8 Global Business Management Consulting Services Market Share (%) By Regions (2022)
Figure 9 North America Business Management Consulting Services Revenue (USD Million) By Country (2018-2022)
Figure 10 North America Business Management Consulting Services Revenue (USD Million) By Type (2018-2022)
Figure 11 North America Business Management Consulting Services Revenue (USD Million) By Applications (2018-2022)
Figure 12 Europe Business Management Consulting Services Revenue (USD Million) By Country (2018-2022)
Figure 13 Europe Business Management Consulting Services Revenue (USD Million) By Type (2018-2022)
Figure 14 Europe Business Management Consulting Services Revenue (USD Million) By Applications (2018-2022)
Figure 15 Asia Pacific Business Management Consulting Services Revenue (USD Million) By Country (2018-2022)
Figure 16 Asia Pacific Business Management Consulting Services Revenue (USD Million) By Type (2018-2022)
Figure 17 Asia Pacific Business Management Consulting Services Revenue (USD Million) By Applications (2018-2022)
Figure 18 South America Business Management Consulting Services Revenue (USD Million) By Country (2018-2022)
Figure 19 South America Business Management Consulting Services Revenue (USD Million) By Type (2018-2022)
Figure 20 South America Business Management Consulting Services Revenue (USD Million) By Applications (2018-2022)
Figure 21 Middle East and Africa Business Management Consulting Services Revenue (USD Million) By Region (2018-2022)
Figure 22 Middle East and Africa Business Management Consulting Services Revenue (USD Million) By Type (2018-2022)
Figure 23 Middle East and Africa Business Management Consulting Services Revenue (USD Million) By Applications (2018-2022)
Figure 24 Global Business Management Consulting Services Revenue (USD Million) By Type (2023-2030)
Figure 25 Global Business Management Consulting Services Revenue Market Share (%) By Type (2030)
Figure 26 Global Business Management Consulting Services Revenue (USD Million) By Applications (2023-2030)
Figure 27 Global Business Management Consulting Services Revenue Market Share (%) By Applications (2030)
Figure 28 Global Business Management Consulting Services Market Revenue (USD Million) By Regions (2023-2030)
Figure 29 North America Business Management Consulting Services Revenue (USD Million) By Country (2023-2030)
Figure 30 North America Business Management Consulting Services Revenue (USD Million) By Type (2023-2030)
Figure 31 North America Business Management Consulting Services Revenue (USD Million) By Applications (2023-2030)
Figure 32 Europe Business Management Consulting Services Revenue (USD Million) By Country (2023-2030)
Figure 33 Europe Business Management Consulting Services Revenue (USD Million) By Type (2023-2030)
Figure 34 Europe Business Management Consulting Services Revenue (USD Million) By Applications (2023-2030)
Figure 35 Asia Pacific Business Management Consulting Services Revenue (USD Million) By Country (2023-2030)
Figure 36 Asia Pacific Business Management Consulting Services Revenue (USD Million) By Type (2023-2030)
Figure 37 Asia Pacific Business Management Consulting Services Revenue (USD Million) By Applications (2023-2030)
Figure 38 South America Business Management Consulting Services Revenue (USD Million) By Country (2023-2030)
Figure 39 South America Business Management Consulting Services Revenue (USD Million) By Type (2023-2030)
Figure 40 South America Business Management Consulting Services Revenue (USD Million) By Applications (2023-2030)
Figure 41 Middle East and Africa Business Management Consulting Services Revenue (USD Million) By Region (2023-2030)
Figure 42 Middle East and Africa Business Management Consulting Services Revenue (USD Million) By Region (2023-2030)
Figure 43 Middle East and Africa Business Management Consulting Services Revenue (USD Million) By Type (2023-2030)
Figure 44 Middle East and Africa Business Management Consulting Services Revenue (USD Million) By Applications (2023-2030)
Figure 45 Bottom-Up and Top-Down Approaches For This Report
Figure 46 Data Triangulation
