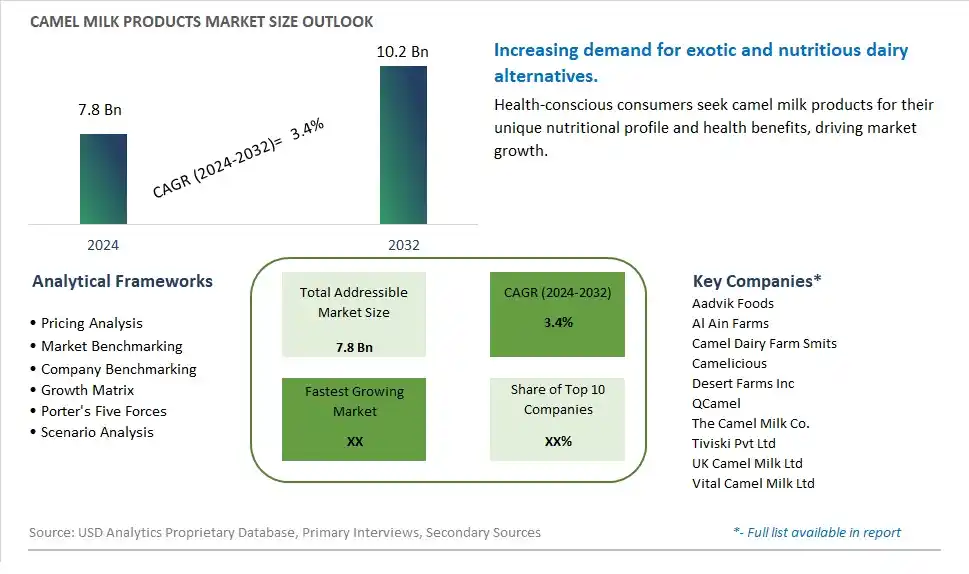
Global Camel Milk Products Market Size is valued at $7.8 Billion in 2024 and is forecast to register a growth rate (CAGR) of 3.4% to reach $10.2 Billion by 2032.
The global Camel Milk Products Market Comprehensive Study analyzes and forecasts the market size across 6 regions and 24 countries for diverse segments -By Product (Plain Milk, Flavored Milk, Powder, Ice Cream, Fermented, Others), By Distribution Channel (Offline, Online)
An Introduction to Camel Milk Products Market
In 2024, the market for camel milk products is experiencing rapid expansion, driven by growing awareness of the nutritional benefits and therapeutic properties of camel milk. Traditionally consumed in regions where camels are prevalent, such as parts of Africa, the Middle East, and Asia, camel milk is gaining popularity worldwide as a nutritious and sustainable alternative to cow's milk. Rich in vitamins, minerals, and immune-boosting compounds, camel milk offers numerous health benefits, including improved digestion, enhanced immunity, and management of certain health conditions such as diabetes and autoimmune disorders. In response to increasing demand, manufacturers are diversifying their product offerings to include a wide range of camel milk products, including fresh milk, yogurt, cheese, and skincare products. Moreover, advancements in processing and packaging technologies have extended the shelf life and accessibility of camel milk products, making them more readily available to consumers around the globe.
Camel Milk Products Competitive Landscape
The market report analyses the leading companies in the industry including Aadvik Foods, Al Ain Farms, Camel Dairy Farm Smits, Camelicious, Desert Farms Inc, QCamel, The Camel Milk Co., Tiviski Pvt Ltd, UK Camel Milk Ltd, Vital Camel Milk Ltd, and Others.
Camel Milk Products Market Dynamics
Camel Milk Products Market Trend: Growing Interest in Alternative Dairy Products
The most prominent market trend in the camel milk products industry is the growing interest in alternative dairy products. As consumers become more health-conscious and environmentally aware, there is a rising demand for dairy alternatives that offer unique nutritional benefits and sustainable production practices. Camel milk, known for its distinct flavor profile, rich nutrients, and potential health benefits, has gained traction as a viable alternative to traditional cow's milk. This trend is driven by increasing consumer curiosity about novel dairy products, coupled with concerns about lactose intolerance, dairy allergies, and ethical considerations in animal agriculture.
Market Driver: Health and Nutritional Benefits of Camel Milk
The primary market driver for camel milk products is the perceived health and nutritional benefits associated with camel milk consumption. Camel milk is renowned for its unique composition, containing higher levels of vitamins, minerals, and proteins compared to cow's milk. It is also lower in lactose and cholesterol, making it suitable for individuals with lactose intolerance or dietary restrictions. The presence of bioactive compounds in camel milk, such as lactoferrin and immunoglobulins, has led to its reputation as a functional food with potential therapeutic properties, including immune system support, gut health promotion, and management of certain health conditions. These health benefits drive consumer interest and adoption of camel milk products, fueling market growth.
Market Opportunity: Diversification and Innovation in Camel Milk Product Offerings
An opportunity for the camel milk products market lies in diversification and innovation to meet evolving consumer preferences and market demands. Manufacturers can capitalize on the growing interest in camel milk by expanding product offerings beyond traditional milk to include value-added products such as yogurt, cheese, ice cream, and skincare products. By leveraging the unique properties of camel milk and incorporating it into a diverse range of dairy and non-dairy products, companies can cater to different consumer segments and enhance market penetration. Additionally, there is an opportunity to invest in research and development to explore novel formulations, flavors, and packaging formats that appeal to modern consumers seeking innovative and convenient dairy alternatives. This approach can drive product differentiation, brand loyalty, and market competitiveness in the burgeoning camel milk products sector.
Camel Milk Products Market Share Analysis: Plain Milk held the dominant market share in 2024
Plain milk is the largest segment in the camel milk products market due to its simplicity, nutritional benefits, and versatile usage. Camel milk, known for its unique composition and potential health benefits, is primarily consumed in its plain form by consumers seeking a dairy alternative. Plain camel milk is rich in vitamins, minerals, and proteins, making it a nutritious choice for individuals with lactose intolerance or other dairy sensitivities. Further, the rising awareness of camel milk's potential health benefits, including its immune-boosting properties and potential for managing certain health conditions, further drives its popularity among health-conscious consumers. The simplicity and purity of plain camel milk make it a preferred choice for consumers seeking natural and wholesome dairy products. As consumer interest in alternative dairy products continues to grow, the plain milk segment maintains its dominance in the camel milk products market, catering to the demand for nutritious and sustainable dairy alternatives.
Camel Milk Products Market Share Analysis: Online market is poised to register the fastest growth rae over the forecast period to 2032
The Online segment is the fastest-growing in the camel milk products market, driven by the increasing consumer preference for convenience, wider product selection, and the growing trend of online shopping. With the rise of e-commerce platforms and the ease of doorstep delivery, more consumers are opting to purchase camel milk products online. Online retailers offer a diverse range of camel milk products, including plain milk, flavored milk, powder, and more, often at competitive prices, allowing consumers to easily access and purchase their preferred products from the comfort of their homes. Additionally, the COVID-19 pandemic has accelerated the adoption of online shopping as consumers sought safe and contactless purchasing options. The convenience of online shopping, coupled with the availability of a wider selection and promotional discounts, drives the rapid growth of the Online segment in the camel milk products market. As consumers continue to prioritize convenience and accessibility in their shopping experiences, the Online segment is expected to maintain its momentum and expand its market share further.
Camel Milk Products Market Segmentation
By Product
Plain Milk
Flavored Milk
Powder
Ice Cream
Fermented
Others
By Distribution Channel
Offline
Online
Countries Analyzed
North America (US, Canada, Mexico)
Europe (Germany, UK, France, Spain, Italy, Russia, Rest of Europe)
Asia Pacific (China, India, Japan, South Korea, Australia, South East Asia, Rest of Asia)
South America (Brazil, Argentina, Rest of South America)
Middle East and Africa (Saudi Arabia, UAE, Rest of Middle East, South Africa, Egypt, Rest of Africa)
Camel Milk Products Companies Profiled in the Study
Aadvik Foods
Al Ain Farms
Camel Dairy Farm Smits
Camelicious
Desert Farms Inc
QCamel
The Camel Milk Co.
Tiviski Pvt Ltd
UK Camel Milk Ltd
Vital Camel Milk Ltd
*- List Not Exhaustive
Chapter 1. TABLE OF CONTENTS
Chapter 2. Introduction to Camel Milk Products Market
2.1. Market Overview
2.2. Key Statistics and Report Highlights
2.3. Scope of the Comprehensive Study
2.3.1. Market Definition
2.3.2 Countries and Regions Covered
2.3.3 Research Objective
2.3.4 Units, Currency, and Conversions
2.3.5 Industry Value Chain
2.4. Key Market Segments
2.5. Key Companies
2.6. Study Period
Chapter 3. Strategic Analysis Review
3.1. Camel Milk Products Pricing Analysis and Forecast
3.2. Porter’s Five Forces
3.3. Market Ecosystem
3.4. SWOT Analysis
3.5. Regulatory Scenario
3.3. Effects of Inflation, Russia-Ukraine War, moderating economic growth, and other macroeconomic factors
Chapter 4. Competitive Landscape
4.1. Market Share Analysis
4.1.1. Global Camel Milk Products Market Share by Company, 2023
4.1.2. Product Offerings of Leading Camel Milk Products Companies
4.2. Market Entropy
4.2.1. New Product Launches in the Industry
4.2.2. Mergers, Acquisitions, Joint ventures, and Partnerships
4.3. Key Strategies and Best Practices
Chapter 5. Global Market Projections: Best, Reference, and Low Case Scenarios
5.1. Growth Analysis- Case Scenario Definitions
5.2. Low Growth Case Scenario Forecasts
5.3. Reference Growth Case Scenario Forecasts
5.4. High Growth Case Scenario Forecasts
Chapter 6. Market Dynamics
6.1. Camel Milk Products Market Drivers
6.2. Camel Milk Products Market Challenges
6.6. Camel Milk Products Market Opportunities
6.4. Camel Milk Products Market Trends
Chapter 7. Global Camel Milk Products Market Outlook Trends
7.1. Global Camel Milk Products Revenue (USD Million) and CAGR (%) by Type (2021-2032)
7.2. Global Camel Milk Products Revenue (USD Million) and CAGR (%) by Application (2021-2032)
7.3. Global Camel Milk Products Revenue (USD Million) and CAGR (%) by Product (2021-2032)
By Product
Plain Milk
Flavored Milk
Powder
Ice Cream
Fermented
Others
By Distribution Channel
Offline
Online
Chapter 8. Global Camel Milk Products Regional Analysis and Outlook
8.1. Global Camel Milk Products Revenue (USD Million) By Regions (2021- 2032)
8.2. North America Camel Milk Products Revenue (USD Million) by Country (2021-2032)
8.2.1. United States Camel Milk Products Regional Analysis and Outlook
8.2.2. Canada Camel Milk Products Regional Analysis and Outlook
8.2.3. Mexico Camel Milk Products Regional Analysis and Outlook
8.3. Europe Camel Milk Products Revenue (USD Million), by Country (2021-2032)
8.3.1. Germany Camel Milk Products Regional Analysis and Outlook
8.3.2. France Camel Milk Products Regional Analysis and Outlook
8.3.3. United Kingdom Camel Milk Products Regional Analysis and Outlook
8.3.4. Spain Camel Milk Products Regional Analysis and Outlook
8.3.5. Italy Camel Milk Products Regional Analysis and Outlook
8.3.6. Russia Camel Milk Products Regional Analysis and Outlook
8.3.7. Rest of Europe Camel Milk Products Regional Analysis and Outlook
8.4. Asia Pacific Camel Milk Products Revenue (USD Million) by Country (2021-2032)
8.4.1. China Camel Milk Products Regional Analysis and Outlook
8.4.2. Japan Camel Milk Products Regional Analysis and Outlook
8.4.3. India Camel Milk Products Regional Analysis and Outlook
8.4.4. South Korea Camel Milk Products Regional Analysis and Outlook
8.4.5. Australia Camel Milk Products Regional Analysis and Outlook
8.4.6. South East Asia Camel Milk Products Regional Analysis and Outlook
8.4.7. Rest of Asia Pacific Camel Milk Products Regional Analysis and Outlook
8.5. South America Camel Milk Products Revenue (USD Million), by Country (2021-2032)
8.5.1. Brazil Camel Milk Products Regional Analysis and Outlook
8.5.2. Argentina Camel Milk Products Regional Analysis and Outlook
8.5.3. Rest of South America Camel Milk Products Regional Analysis and Outlook
8.6. Middle East and Africa Camel Milk Products Revenue (USD Million) by Country (2021-2032)
8.6.1. Middle East Camel Milk Products Regional Analysis and Outlook
8.6.2. Africa Camel Milk Products Regional Analysis and Outlook
Chapter 9. North America Camel Milk Products Analysis and Outlook
9.1. North America Camel Milk Products Revenue (USD Million) by Segments (2021-2032)
9.1.1. North America Camel Milk Products Revenue (USD Million) by Type (2021-2032)
9.1.2. North America Camel Milk Products Revenue (USD Million) by Application (2021-2032)
9.1.3. North America Camel Milk Products Revenue (USD Million) by Product (2021-2032)
By Product
Plain Milk
Flavored Milk
Powder
Ice Cream
Fermented
Others
By Distribution Channel
Offline
Online
Chapter 10. Europe Camel Milk Products Analysis and Outlook
10.1. Europe Camel Milk Products Revenue (USD Million), by Segments (USD Million) (2021-2032)
10.1.1. Europe Camel Milk Products Revenue (USD Million) by Type (2021-2032)
10.1.2. Europe Camel Milk Products Revenue (USD Million) by Application (2021-2032)
10.1.3. Europe Camel Milk Products Revenue (USD Million) by Product (2021-2032)
By Product
Plain Milk
Flavored Milk
Powder
Ice Cream
Fermented
Others
By Distribution Channel
Offline
Online
Chapter 11. Asia Pacific Camel Milk Products Analysis and Outlook
11.1. Asia Pacific Camel Milk Products Revenue (USD Million), and Revenue (USD Million) by Segments (2021-2032)
11.1.1. Asia Pacific Camel Milk Products Revenue (USD Million) by Type (2021-2032)
11.1.2. Asia Pacific Camel Milk Products Revenue (USD Million) by Application (2021-2032)
11.1.3. Asia Pacific Camel Milk Products Revenue (USD Million) by Product (2021-2032)
By Product
Plain Milk
Flavored Milk
Powder
Ice Cream
Fermented
Others
By Distribution Channel
Offline
Online
Chapter 12. South America Camel Milk Products Analysis and Outlook
12.1. South America Camel Milk Products Revenue (USD Million), by Segments (2021-2032)
12.1.1. South America Camel Milk Products Revenue (USD Million) by Type (2021-2032)
12.1.2. South America Camel Milk Products Revenue (USD Million) by Application (2021-2032)
12.1.3. South America Camel Milk Products Revenue (USD Million) by Product (2021-2032)
By Product
Plain Milk
Flavored Milk
Powder
Ice Cream
Fermented
Others
By Distribution Channel
Offline
Online
Chapter 13. Middle East and Africa Camel Milk Products Analysis and Outlook
13.1. Middle East and Africa Camel Milk Products Revenue (USD Million), by Segments (2021-2032)
13.1.1. Middle East and Africa Camel Milk Products Revenue (USD Million) by Type (2021-2032)
13.1.2. Middle East and Africa Camel Milk Products Revenue (USD Million) by Application (2021-2032)
13.1.3. Middle East and Africa Camel Milk Products Revenue (USD Million) by Product (2021-2032)
By Product
Plain Milk
Flavored Milk
Powder
Ice Cream
Fermented
Others
By Distribution Channel
Offline
Online
Chapter 14. Camel Milk Products Company Profiles
14.1 Business Overview
14.2 Product Profiles
14.3 SWOT Profiles
14.5 Recent Developments
14.6 Financial Profile
List of Companies
Aadvik Foods
Al Ain Farms
Camel Dairy Farm Smits
Camelicious
Desert Farms Inc
QCamel
The Camel Milk Co.
Tiviski Pvt Ltd
UK Camel Milk Ltd
Vital Camel Milk Ltd
15. Methodology and Data Sources
15.1 Customization Offerings
15.2 Subscription Services
15.3 Related Reports
15.4 Publisher Expertise
LIST OF TABLES
Table 1 Market Segmentation Analysis
Table 2 Global Camel Milk Products Market Share of Leading Companies, 2023
Table 3 Product Offerings of Leading Companies
Table 4 Low Growth Scenario Forecasts
Table 5 Reference Case Growth Scenario
Table 6 High Growth Case Scenario
Table 7 Global Camel Milk Products Revenue (USD Million) And CAGR (%) By Type (2021-2032)
Table 8 Global Camel Milk Products Revenue (USD Million) And CAGR (%) By Application (2021-2032)
Table 9 Global Camel Milk Products Revenue (USD Million) And CAGR (%) By Product (2021-2032)
Table 10 Global Camel Milk Products Market Revenue (USD Million) By Regions (2021-2032)
Table 11 Global Camel Milk Products Market Share (%) By Regions (2021-2032)
Table 12 North America Camel Milk Products Revenue (USD Million) By Country (2021-2032)
Table 13 Europe Camel Milk Products Revenue (USD Million) By Country (2021-2032)
Table 14 Asia Pacific Camel Milk Products Revenue (USD Million) By Country (2021-2032)
Table 15 South America Camel Milk Products Revenue (USD Million) By Country (2021-2032)
Table 16 Middle East and Africa Camel Milk Products Revenue (USD Million) By Region (2021-2032)
Table 17 North America Camel Milk Products Revenue (USD Million) By Type (2021-2032)
Table 18 North America Camel Milk Products Revenue (USD Million) By Application (2021-2032)
Table 19 North America Camel Milk Products Revenue (USD Million) By Product (2021-2032)
Table 20 Europe Camel Milk Products Revenue (USD Million) By Type (2021-2032)
Table 21 Europe Camel Milk Products Revenue (USD Million) By Application (2021-2032)
Table 22 Europe Camel Milk Products Revenue (USD Million) By Product (2021-2032)
Table 23 Asia Pacific Camel Milk Products Revenue (USD Million) By Type (2021-2032)
Table 24 Asia Pacific Camel Milk Products Revenue (USD Million) By Application (2021-2032)
Table 25 Asia Pacific Camel Milk Products Revenue (USD Million) By Product (2021-2032)
Table 26 South America Camel Milk Products Revenue (USD Million) By Type (2021-2032)
Table 27 South America Camel Milk Products Revenue (USD Million) By Application (2021-2032)
Table 28 South America Camel Milk Products Revenue (USD Million) By Product (2021-2032)
Table 29 Middle East and Africa Camel Milk Products Revenue (USD Million) By Type (2021-2032)
Table 30 Middle East and Africa Camel Milk Products Revenue (USD Million) By Application (2021-2032)
Table 31 Middle East and Africa Camel Milk Products Revenue (USD Million) By Product (2021-2032)
LIST OF FIGURES
Figure 1. Market Scope
Figure 2. Pricing Forecasts Per Unit, 2023- 2032
Figure 3. Porter’s Five Forces
Figure 4. Global Camel Milk Products Market Revenue (USD Million) By Regions (2021-2032)
Figure 5. Global Camel Milk Products Market Share (%) By Regions (2023)
Figure 6. North America Camel Milk Products Revenue (USD Million) By Country (2021-2032)
Figure 7. United States Camel Milk Products Revenue (USD Million) By Country (2021-2032)
Figure 8. Canada Camel Milk Products Revenue (USD Million) By Country (2021-2032)
Figure 9. Mexico Camel Milk Products Revenue (USD Million) By Country (2021-2032)
Figure 10. Europe Camel Milk Products Revenue (USD Million) By Country (2021-2032)
Figure 11. Germany Camel Milk Products Revenue (USD Million) By Country (2021-2032)
Figure 12. France Camel Milk Products Revenue (USD Million) By Country (2021-2032)
Figure 13. United Kingdom Camel Milk Products Revenue (USD Million) By Country (2021-2032)
Figure 14. Spain Camel Milk Products Revenue (USD Million) By Country (2021-2032)
Figure 15. Italy Camel Milk Products Revenue (USD Million) By Country (2021-2032)
Figure 16. Russia Camel Milk Products Revenue (USD Million) By Country (2021-2032)
Figure 17. Rest of Europe Camel Milk Products Revenue (USD Million) By Country (2021-2032)
Figure 11. Asia Pacific Camel Milk Products Revenue (USD Million) By Country (2021-2032)
Figure 12. China Camel Milk Products Revenue (USD Million) By Country (2021-2032)
Figure 13. Japan Camel Milk Products Revenue (USD Million) By Country (2021-2032)
Figure 14. India Camel Milk Products Revenue (USD Million) By Country (2021-2032)
Figure 15. South Korea Camel Milk Products Revenue (USD Million) By Country (2021-2032)
Figure 16. Australia Camel Milk Products Revenue (USD Million) By Country (2021-2032)
Figure 17. South East Asia Camel Milk Products Revenue (USD Million) By Country (2021-2032)
Figure 18. South America Camel Milk Products Revenue (USD Million) By Country (2021-2032)
Figure 19. Brazil Camel Milk Products Revenue (USD Million) By Country (2021-2032)
Figure 20. Argentina Camel Milk Products Revenue (USD Million) By Country (2021-2032)
Figure 21. Rest of Asia Pacific Camel Milk Products Revenue (USD Million) By Country (2021-2032)
Figure 22. Middle East and Africa Camel Milk Products Revenue (USD Million) By Region (2021-2032)
Figure 23. Saudi Arabia Camel Milk Products Revenue (USD Million) By Region (2021-2032)
Figure 24. The UAE Camel Milk Products Revenue (USD Million) By Region (2021-2032)
Figure 25. Rest of Middle East Camel Milk Products Revenue (USD Million) By Region (2021-2032)
Figure 26. South Africa Camel Milk Products Revenue (USD Million) By Region (2021-2032)
Figure 27. Africa Camel Milk Products Revenue (USD Million) By Region (2021-2032)
Figure 28. North America Camel Milk Products Revenue (USD Million) By Type (2021-2032)
Figure 29. North America Camel Milk Products Revenue (USD Million) By Application (2021-2032)
Figure 30. North America Camel Milk Products Revenue (USD Million) By Product (2021-2032)
Figure 31. Europe Camel Milk Products Revenue (USD Million) By Type (2021-2032)
Figure 32. Europe Camel Milk Products Revenue (USD Million) By Application (2021-2032)
Figure 33. Europe Camel Milk Products Revenue (USD Million) By Product (2021-2032)
Figure 34. Asia Pacific Camel Milk Products Revenue (USD Million) By Type (2021-2032)
Figure 35. Asia Pacific Camel Milk Products Revenue (USD Million) By Application (2021-2032)
Figure 36. Asia Pacific Camel Milk Products Revenue (USD Million) By Product (2021-2032)
Figure 37. South America Camel Milk Products Revenue (USD Million) By Type (2021-2032)
Figure 38. South America Camel Milk Products Revenue (USD Million) By Application (2021-2032)
Figure 39. South America Camel Milk Products Revenue (USD Million) By Product (2021-2032)
Figure 40. Middle East and Africa Camel Milk Products Revenue (USD Million) By Type (2021-2032)
Figure 41. Middle East and Africa Camel Milk Products Revenue (USD Million) By Application (2021-2032)
Figure 42. Middle East and Africa Camel Milk Products Revenue (USD Million) By Product (2021-2032)
By Product
Plain Milk
Flavored Milk
Powder
Ice Cream
Fermented
Others
By Distribution Channel
Offline
Online
Countries Analyzed
North America (US, Canada, Mexico)
Europe (Germany, UK, France, Spain, Italy, Russia, Rest of Europe)
Asia Pacific (China, India, Japan, South Korea, Australia, South East Asia, Rest of Asia)
South America (Brazil, Argentina, Rest of South America)
Middle East and Africa (Saudi Arabia, UAE, Rest of Middle East, South Africa, Egypt, Rest of Africa)
