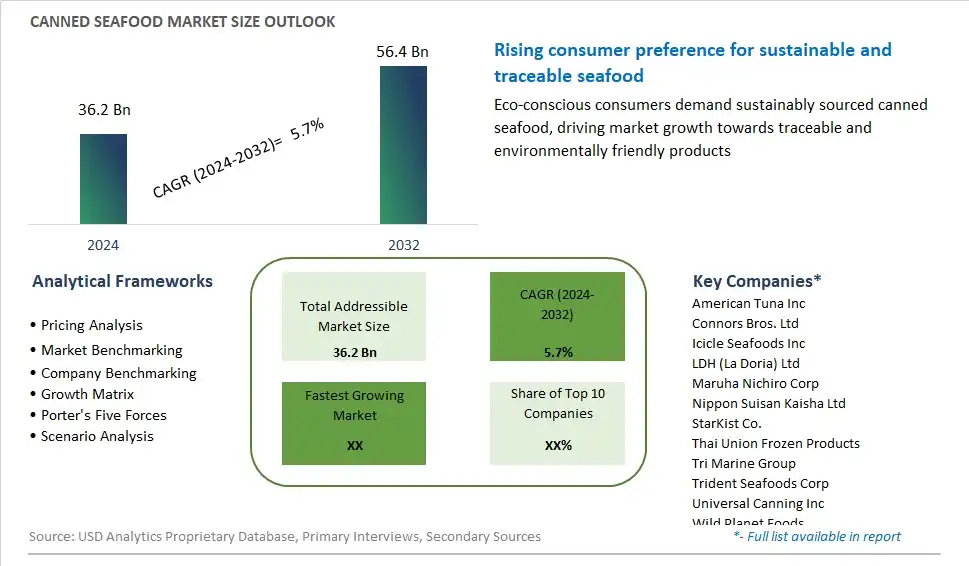
Global Canned Seafood Market Size is valued at $36.2 Billion in 2024 and is forecast to register a growth rate (CAGR) of 5.7% to reach $56.4 Billion by 2032.
The global Canned Seafood Market Comprehensive Study analyzes and forecasts the market size across 6 regions and 24 countries for diverse segments -By Product (Tuna, Salmon, Sardines, Others, Prawns, Shrimps, Others), By Distribution Channel (Foodservice, Retail)
An Introduction to Canned Seafood Market
In 2024, the canned seafood market continues to expand as consumers seek convenient, nutritious, and sustainable food options. Canned seafood, including tuna, salmon, sardines, and mackerel, provides a rich source of protein, omega-3 fatty acids, and essential nutrients, making it a popular choice for health-conscious individuals. The market is driven by advancements in canning technology that preserve the taste and nutritional value of seafood while extending shelf life. Additionally, growing concerns about overfishing and environmental sustainability are pushing manufacturers to adopt responsible sourcing practices, such as sustainable fishing methods and eco-friendly packaging. As a result, canned seafood is becoming an attractive option for consumers looking for quick, healthy meal solutions that also support marine conservation efforts.
Canned Seafood Competitive Landscape
The market report analyses the leading companies in the industry including American Tuna Inc, Connors Bros. Ltd, Icicle Seafoods Inc, LDH (La Doria) Ltd, Maruha Nichiro Corp, Nippon Suisan Kaisha Ltd, StarKist Co., Thai Union Frozen Products, Tri Marine Group, Trident Seafoods Corp, Universal Canning Inc, Wild Planet Foods, and Others.
Canned Seafood Market Dynamics
Canned Seafood Market Trend: Increasing Demand for Convenient and Sustainable Protein Sources
One of the most prominent trends in the canned seafood market is the increasing demand for convenient and sustainable protein sources. As consumers lead busier lifestyles, there is a growing preference for convenient meal solutions that require minimal preparation time. Canned seafood offers a convenient option for quick and easy meals, as it is shelf-stable and requires no refrigeration until opened. Additionally, consumers are increasingly prioritizing sustainability in their food choices, seeking products that are sourced responsibly and support ocean conservation efforts. Canned seafood, when sourced from well-managed fisheries and certified sustainable sources, aligns with these sustainability goals, making it an attractive option for environmentally conscious consumers. This trend is driving the adoption of canned seafood as a convenient, protein-rich pantry staple for households and foodservice establishments alike.
Market Driver: Long Shelf Life and Versatility in Culinary Applications
The primary driver of the canned seafood market is the long shelf life and versatility of canned seafood products. Canned seafood offers extended shelf life compared to fresh or frozen seafood, making it a convenient pantry staple that can be stored for an extended period without spoilage. This extended shelf life not only reduces food waste but also provides consumers with flexibility in meal planning and preparation. Canned seafood products can be used in a variety of culinary applications, including salads, sandwiches, pasta dishes, soups, and casseroles, making them versatile ingredients for home cooks and professional chefs alike. The convenience and versatility of canned seafood products drive demand among consumers seeking convenient meal solutions that offer nutritional value, flavor, and convenience.
Market Opportunity: Innovation in Flavor Profiles and Packaging Formats
A significant opportunity for the canned seafood market lies in innovation in flavor profiles and packaging formats. With consumer preferences evolving and demand for premium and gourmet food experiences on the rise, there is an opportunity for canned seafood manufacturers to innovate with new flavor combinations and packaging designs that appeal to modern palates. This can include introducing bold and globally inspired flavor profiles, such as Thai curry tuna, lemon pepper salmon, or Mediterranean-style sardines, to cater to diverse taste preferences. Additionally, offering convenient packaging formats, such as single-serve pouches or resealable cans, can enhance convenience and portability for on-the-go consumption. By leveraging flavor innovation and packaging versatility, canned seafood manufacturers can attract new customers, differentiate themselves in the market, and capitalize on the growing demand for convenient, flavorful, and sustainable seafood options. Moreover, investing in marketing efforts to highlight the convenience, quality, and culinary versatility of canned seafood products can help increase consumer awareness and drive sales growth in the market.
Canned Seafood Market Share Analysis: Tuna held the dominant market share in 2024
Tuna is the largest segment in the canned seafood market due to its widespread popularity, versatility, and nutritional benefits. Tuna is a highly sought-after seafood choice for consumers worldwide, known for its mild flavor, firm texture, and high protein content. Canned tuna offers convenience and long shelf life, making it a convenient pantry staple for households and foodservice establishments alike. Further, tuna is rich in omega-3 fatty acids, vitamins, and minerals, offering various health benefits such as promoting heart health and supporting brain function. Its versatility allows for a wide range of culinary applications, including salads, sandwiches, pasta dishes, and casseroles, catering to diverse consumer preferences and dietary needs. As consumers increasingly seek convenient and nutritious meal options, the tuna segment maintains its dominance in the canned seafood market, meeting the demand for flavorful and healthy seafood choices.
Canned Seafood Market Share Analysis: Foodservice market is poised to register the fastest growth rae over the forecast period to 2032
The Foodservice segment is the fastest-growing in the canned seafood market, driven by the increasing demand from restaurants, cafés, catering services, and other foodservice establishments. Canned seafood offers a convenient and cost-effective solution for foodservice operators seeking high-quality seafood ingredients with extended shelf life and consistent quality. With the growing consumer preference for seafood-based dishes in restaurants and other dining venues, foodservice establishments are incorporating canned seafood into their menus to offer a diverse range of seafood options to their customers. Additionally, the COVID-19 pandemic has prompted a shift towards takeout and delivery services, further increasing the demand for canned seafood among foodservice operators looking to streamline their operations and meet the evolving needs of their customers. As foodservice establishments continue to adapt to changing consumer preferences and operational challenges, the Foodservice segment in the canned seafood market is expected to experience sustained growth, catering to the demand for convenient and versatile seafood solutions in the foodservice industry.
Canned Seafood Market Segmentation
By Product
Tuna
Salmon
Sardines
Others
Prawns
Shrimps
Others
By Distribution Channel
Foodservice
Retail
Countries Analyzed
North America (US, Canada, Mexico)
Europe (Germany, UK, France, Spain, Italy, Russia, Rest of Europe)
Asia Pacific (China, India, Japan, South Korea, Australia, South East Asia, Rest of Asia)
South America (Brazil, Argentina, Rest of South America)
Middle East and Africa (Saudi Arabia, UAE, Rest of Middle East, South Africa, Egypt, Rest of Africa)
Canned Seafood Companies Profiled in the Study
American Tuna Inc
Connors Bros. Ltd
Icicle Seafoods Inc
LDH (La Doria) Ltd
Maruha Nichiro Corp
Nippon Suisan Kaisha Ltd
StarKist Co.
Thai Union Frozen Products
Tri Marine Group
Trident Seafoods Corp
Universal Canning Inc
Wild Planet Foods
*- List Not Exhaustive
Chapter 1. TABLE OF CONTENTS
Chapter 2. Introduction to Canned Seafood Market
2.1. Market Overview
2.2. Key Statistics and Report Highlights
2.3. Scope of the Comprehensive Study
2.3.1. Market Definition
2.3.2 Countries and Regions Covered
2.3.3 Research Objective
2.3.4 Units, Currency, and Conversions
2.3.5 Industry Value Chain
2.4. Key Market Segments
2.5. Key Companies
2.6. Study Period
Chapter 3. Strategic Analysis Review
3.1. Canned Seafood Pricing Analysis and Forecast
3.2. Porter’s Five Forces
3.3. Market Ecosystem
3.4. SWOT Analysis
3.5. Regulatory Scenario
3.3. Effects of Inflation, Russia-Ukraine War, moderating economic growth, and other macroeconomic factors
Chapter 4. Competitive Landscape
4.1. Market Share Analysis
4.1.1. Global Canned Seafood Market Share by Company, 2023
4.1.2. Product Offerings of Leading Canned Seafood Companies
4.2. Market Entropy
4.2.1. New Product Launches in the Industry
4.2.2. Mergers, Acquisitions, Joint ventures, and Partnerships
4.3. Key Strategies and Best Practices
Chapter 5. Global Market Projections: Best, Reference, and Low Case Scenarios
5.1. Growth Analysis- Case Scenario Definitions
5.2. Low Growth Case Scenario Forecasts
5.3. Reference Growth Case Scenario Forecasts
5.4. High Growth Case Scenario Forecasts
Chapter 6. Market Dynamics
6.1. Canned Seafood Market Drivers
6.2. Canned Seafood Market Challenges
6.6. Canned Seafood Market Opportunities
6.4. Canned Seafood Market Trends
Chapter 7. Global Canned Seafood Market Outlook Trends
7.1. Global Canned Seafood Revenue (USD Million) and CAGR (%) by Type (2021-2032)
7.2. Global Canned Seafood Revenue (USD Million) and CAGR (%) by Application (2021-2032)
7.3. Global Canned Seafood Revenue (USD Million) and CAGR (%) by Product (2021-2032)
By Product
Tuna
Salmon
Sardines
Others
Prawns
Shrimps
Others
By Distribution Channel
Foodservice
Retail
Chapter 8. Global Canned Seafood Regional Analysis and Outlook
8.1. Global Canned Seafood Revenue (USD Million) By Regions (2021- 2032)
8.2. North America Canned Seafood Revenue (USD Million) by Country (2021-2032)
8.2.1. United States Canned Seafood Regional Analysis and Outlook
8.2.2. Canada Canned Seafood Regional Analysis and Outlook
8.2.3. Mexico Canned Seafood Regional Analysis and Outlook
8.3. Europe Canned Seafood Revenue (USD Million), by Country (2021-2032)
8.3.1. Germany Canned Seafood Regional Analysis and Outlook
8.3.2. France Canned Seafood Regional Analysis and Outlook
8.3.3. United Kingdom Canned Seafood Regional Analysis and Outlook
8.3.4. Spain Canned Seafood Regional Analysis and Outlook
8.3.5. Italy Canned Seafood Regional Analysis and Outlook
8.3.6. Russia Canned Seafood Regional Analysis and Outlook
8.3.7. Rest of Europe Canned Seafood Regional Analysis and Outlook
8.4. Asia Pacific Canned Seafood Revenue (USD Million) by Country (2021-2032)
8.4.1. China Canned Seafood Regional Analysis and Outlook
8.4.2. Japan Canned Seafood Regional Analysis and Outlook
8.4.3. India Canned Seafood Regional Analysis and Outlook
8.4.4. South Korea Canned Seafood Regional Analysis and Outlook
8.4.5. Australia Canned Seafood Regional Analysis and Outlook
8.4.6. South East Asia Canned Seafood Regional Analysis and Outlook
8.4.7. Rest of Asia Pacific Canned Seafood Regional Analysis and Outlook
8.5. South America Canned Seafood Revenue (USD Million), by Country (2021-2032)
8.5.1. Brazil Canned Seafood Regional Analysis and Outlook
8.5.2. Argentina Canned Seafood Regional Analysis and Outlook
8.5.3. Rest of South America Canned Seafood Regional Analysis and Outlook
8.6. Middle East and Africa Canned Seafood Revenue (USD Million) by Country (2021-2032)
8.6.1. Middle East Canned Seafood Regional Analysis and Outlook
8.6.2. Africa Canned Seafood Regional Analysis and Outlook
Chapter 9. North America Canned Seafood Analysis and Outlook
9.1. North America Canned Seafood Revenue (USD Million) by Segments (2021-2032)
9.1.1. North America Canned Seafood Revenue (USD Million) by Type (2021-2032)
9.1.2. North America Canned Seafood Revenue (USD Million) by Application (2021-2032)
9.1.3. North America Canned Seafood Revenue (USD Million) by Product (2021-2032)
By Product
Tuna
Salmon
Sardines
Others
Prawns
Shrimps
Others
By Distribution Channel
Foodservice
Retail
Chapter 10. Europe Canned Seafood Analysis and Outlook
10.1. Europe Canned Seafood Revenue (USD Million), by Segments (USD Million) (2021-2032)
10.1.1. Europe Canned Seafood Revenue (USD Million) by Type (2021-2032)
10.1.2. Europe Canned Seafood Revenue (USD Million) by Application (2021-2032)
10.1.3. Europe Canned Seafood Revenue (USD Million) by Product (2021-2032)
By Product
Tuna
Salmon
Sardines
Others
Prawns
Shrimps
Others
By Distribution Channel
Foodservice
Retail
Chapter 11. Asia Pacific Canned Seafood Analysis and Outlook
11.1. Asia Pacific Canned Seafood Revenue (USD Million), and Revenue (USD Million) by Segments (2021-2032)
11.1.1. Asia Pacific Canned Seafood Revenue (USD Million) by Type (2021-2032)
11.1.2. Asia Pacific Canned Seafood Revenue (USD Million) by Application (2021-2032)
11.1.3. Asia Pacific Canned Seafood Revenue (USD Million) by Product (2021-2032)
By Product
Tuna
Salmon
Sardines
Others
Prawns
Shrimps
Others
By Distribution Channel
Foodservice
Retail
Chapter 12. South America Canned Seafood Analysis and Outlook
12.1. South America Canned Seafood Revenue (USD Million), by Segments (2021-2032)
12.1.1. South America Canned Seafood Revenue (USD Million) by Type (2021-2032)
12.1.2. South America Canned Seafood Revenue (USD Million) by Application (2021-2032)
12.1.3. South America Canned Seafood Revenue (USD Million) by Product (2021-2032)
By Product
Tuna
Salmon
Sardines
Others
Prawns
Shrimps
Others
By Distribution Channel
Foodservice
Retail
Chapter 13. Middle East and Africa Canned Seafood Analysis and Outlook
13.1. Middle East and Africa Canned Seafood Revenue (USD Million), by Segments (2021-2032)
13.1.1. Middle East and Africa Canned Seafood Revenue (USD Million) by Type (2021-2032)
13.1.2. Middle East and Africa Canned Seafood Revenue (USD Million) by Application (2021-2032)
13.1.3. Middle East and Africa Canned Seafood Revenue (USD Million) by Product (2021-2032)
By Product
Tuna
Salmon
Sardines
Others
Prawns
Shrimps
Others
By Distribution Channel
Foodservice
Retail
Chapter 14. Canned Seafood Company Profiles
14.1 Business Overview
14.2 Product Profiles
14.3 SWOT Profiles
14.5 Recent Developments
14.6 Financial Profile
List of Companies
American Tuna Inc
Connors Bros. Ltd
Icicle Seafoods Inc
LDH (La Doria) Ltd
Maruha Nichiro Corp
Nippon Suisan Kaisha Ltd
StarKist Co.
Thai Union Frozen Products
Tri Marine Group
Trident Seafoods Corp
Universal Canning Inc
Wild Planet Foods
15. Methodology and Data Sources
15.1 Customization Offerings
15.2 Subscription Services
15.3 Related Reports
15.4 Publisher Expertise
LIST OF TABLES
Table 1 Market Segmentation Analysis
Table 2 Global Canned Seafood Market Share of Leading Companies, 2023
Table 3 Product Offerings of Leading Companies
Table 4 Low Growth Scenario Forecasts
Table 5 Reference Case Growth Scenario
Table 6 High Growth Case Scenario
Table 7 Global Canned Seafood Revenue (USD Million) And CAGR (%) By Type (2021-2032)
Table 8 Global Canned Seafood Revenue (USD Million) And CAGR (%) By Application (2021-2032)
Table 9 Global Canned Seafood Revenue (USD Million) And CAGR (%) By Product (2021-2032)
Table 10 Global Canned Seafood Market Revenue (USD Million) By Regions (2021-2032)
Table 11 Global Canned Seafood Market Share (%) By Regions (2021-2032)
Table 12 North America Canned Seafood Revenue (USD Million) By Country (2021-2032)
Table 13 Europe Canned Seafood Revenue (USD Million) By Country (2021-2032)
Table 14 Asia Pacific Canned Seafood Revenue (USD Million) By Country (2021-2032)
Table 15 South America Canned Seafood Revenue (USD Million) By Country (2021-2032)
Table 16 Middle East and Africa Canned Seafood Revenue (USD Million) By Region (2021-2032)
Table 17 North America Canned Seafood Revenue (USD Million) By Type (2021-2032)
Table 18 North America Canned Seafood Revenue (USD Million) By Application (2021-2032)
Table 19 North America Canned Seafood Revenue (USD Million) By Product (2021-2032)
Table 20 Europe Canned Seafood Revenue (USD Million) By Type (2021-2032)
Table 21 Europe Canned Seafood Revenue (USD Million) By Application (2021-2032)
Table 22 Europe Canned Seafood Revenue (USD Million) By Product (2021-2032)
Table 23 Asia Pacific Canned Seafood Revenue (USD Million) By Type (2021-2032)
Table 24 Asia Pacific Canned Seafood Revenue (USD Million) By Application (2021-2032)
Table 25 Asia Pacific Canned Seafood Revenue (USD Million) By Product (2021-2032)
Table 26 South America Canned Seafood Revenue (USD Million) By Type (2021-2032)
Table 27 South America Canned Seafood Revenue (USD Million) By Application (2021-2032)
Table 28 South America Canned Seafood Revenue (USD Million) By Product (2021-2032)
Table 29 Middle East and Africa Canned Seafood Revenue (USD Million) By Type (2021-2032)
Table 30 Middle East and Africa Canned Seafood Revenue (USD Million) By Application (2021-2032)
Table 31 Middle East and Africa Canned Seafood Revenue (USD Million) By Product (2021-2032)
LIST OF FIGURES
Figure 1. Market Scope
Figure 2. Pricing Forecasts Per Unit, 2023- 2032
Figure 3. Porter’s Five Forces
Figure 4. Global Canned Seafood Market Revenue (USD Million) By Regions (2021-2032)
Figure 5. Global Canned Seafood Market Share (%) By Regions (2023)
Figure 6. North America Canned Seafood Revenue (USD Million) By Country (2021-2032)
Figure 7. United States Canned Seafood Revenue (USD Million) By Country (2021-2032)
Figure 8. Canada Canned Seafood Revenue (USD Million) By Country (2021-2032)
Figure 9. Mexico Canned Seafood Revenue (USD Million) By Country (2021-2032)
Figure 10. Europe Canned Seafood Revenue (USD Million) By Country (2021-2032)
Figure 11. Germany Canned Seafood Revenue (USD Million) By Country (2021-2032)
Figure 12. France Canned Seafood Revenue (USD Million) By Country (2021-2032)
Figure 13. United Kingdom Canned Seafood Revenue (USD Million) By Country (2021-2032)
Figure 14. Spain Canned Seafood Revenue (USD Million) By Country (2021-2032)
Figure 15. Italy Canned Seafood Revenue (USD Million) By Country (2021-2032)
Figure 16. Russia Canned Seafood Revenue (USD Million) By Country (2021-2032)
Figure 17. Rest of Europe Canned Seafood Revenue (USD Million) By Country (2021-2032)
Figure 11. Asia Pacific Canned Seafood Revenue (USD Million) By Country (2021-2032)
Figure 12. China Canned Seafood Revenue (USD Million) By Country (2021-2032)
Figure 13. Japan Canned Seafood Revenue (USD Million) By Country (2021-2032)
Figure 14. India Canned Seafood Revenue (USD Million) By Country (2021-2032)
Figure 15. South Korea Canned Seafood Revenue (USD Million) By Country (2021-2032)
Figure 16. Australia Canned Seafood Revenue (USD Million) By Country (2021-2032)
Figure 17. South East Asia Canned Seafood Revenue (USD Million) By Country (2021-2032)
Figure 18. South America Canned Seafood Revenue (USD Million) By Country (2021-2032)
Figure 19. Brazil Canned Seafood Revenue (USD Million) By Country (2021-2032)
Figure 20. Argentina Canned Seafood Revenue (USD Million) By Country (2021-2032)
Figure 21. Rest of Asia Pacific Canned Seafood Revenue (USD Million) By Country (2021-2032)
Figure 22. Middle East and Africa Canned Seafood Revenue (USD Million) By Region (2021-2032)
Figure 23. Saudi Arabia Canned Seafood Revenue (USD Million) By Region (2021-2032)
Figure 24. The UAE Canned Seafood Revenue (USD Million) By Region (2021-2032)
Figure 25. Rest of Middle East Canned Seafood Revenue (USD Million) By Region (2021-2032)
Figure 26. South Africa Canned Seafood Revenue (USD Million) By Region (2021-2032)
Figure 27. Africa Canned Seafood Revenue (USD Million) By Region (2021-2032)
Figure 28. North America Canned Seafood Revenue (USD Million) By Type (2021-2032)
Figure 29. North America Canned Seafood Revenue (USD Million) By Application (2021-2032)
Figure 30. North America Canned Seafood Revenue (USD Million) By Product (2021-2032)
Figure 31. Europe Canned Seafood Revenue (USD Million) By Type (2021-2032)
Figure 32. Europe Canned Seafood Revenue (USD Million) By Application (2021-2032)
Figure 33. Europe Canned Seafood Revenue (USD Million) By Product (2021-2032)
Figure 34. Asia Pacific Canned Seafood Revenue (USD Million) By Type (2021-2032)
Figure 35. Asia Pacific Canned Seafood Revenue (USD Million) By Application (2021-2032)
Figure 36. Asia Pacific Canned Seafood Revenue (USD Million) By Product (2021-2032)
Figure 37. South America Canned Seafood Revenue (USD Million) By Type (2021-2032)
Figure 38. South America Canned Seafood Revenue (USD Million) By Application (2021-2032)
Figure 39. South America Canned Seafood Revenue (USD Million) By Product (2021-2032)
Figure 40. Middle East and Africa Canned Seafood Revenue (USD Million) By Type (2021-2032)
Figure 41. Middle East and Africa Canned Seafood Revenue (USD Million) By Application (2021-2032)
Figure 42. Middle East and Africa Canned Seafood Revenue (USD Million) By Product (2021-2032)
By Product
Tuna
Salmon
Sardines
Others
Prawns
Shrimps
Others
By Distribution Channel
Foodservice
Retail
Countries Analyzed
North America (US, Canada, Mexico)
Europe (Germany, UK, France, Spain, Italy, Russia, Rest of Europe)
Asia Pacific (China, India, Japan, South Korea, Australia, South East Asia, Rest of Asia)
South America (Brazil, Argentina, Rest of South America)
Middle East and Africa (Saudi Arabia, UAE, Rest of Middle East, South Africa, Egypt, Rest of Africa)
