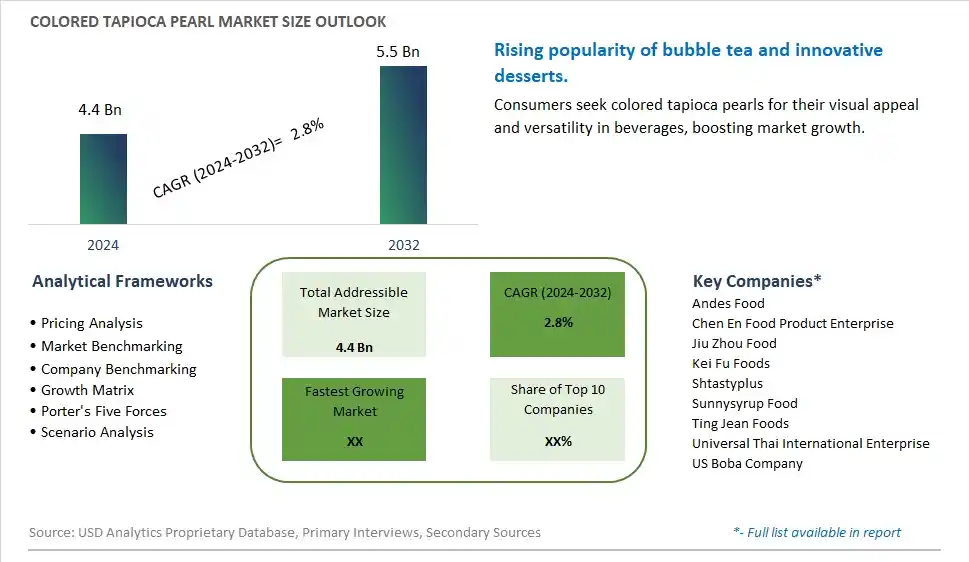
Global Colored Tapioca Pearl Market Size is valued at $4.4 Billion in 2024 and is forecast to register a growth rate (CAGR) of 2.8% to reach $5.5 Billion by 2032.
The global Colored Tapioca Pearl Market Comprehensive Study analyzes and forecasts the market size across 6 regions and 24 countries for diverse segments -By Type (Up to 5 mm, 5 to 8 mm, Above 8 mm), By Application (Food Processing, Food Service, Household Use)
An Introduction to Colored Tapioca Pearl Market
The colored tapioca pearl market in 2024 is expanding rapidly, driven by the demand for visually appealing and versatile ingredients used in beverages and desserts. Colored tapioca pearls, made from tapioca starch and natural colorants, are popular in bubble tea and various sweet dishes. The market benefits from innovations in coloring and processing technologies that enhance the appearance and texture of tapioca pearls. The trend towards clean label and natural ingredients is influencing product development. Increasing consumer interest in unique and Instagram-worthy food experiences, supported by the popularity of bubble tea, is further supporting market growth.
Colored Tapioca Pearl Competitive Landscape
The market report analyses the leading companies in the industry including Andes Food, Chen En Food Product Enterprise, Jiu Zhou Food, Kei Fu Foods, Shtastyplus, Sunnysyrup Food, Ting Jean Foods, Universal Thai International Enterprise, US Boba Company, and Others.
Colored Tapioca Pearl Market Dynamics
Colored Tapioca Pearl Market Trend: Increasing Demand for Bubble Tea and Specialty Drinks
The most prominent trend in the Colored Tapioca Pearl Market is the increasing demand for bubble tea and specialty drinks. Colored tapioca pearls, commonly used in bubble tea, are gaining popularity as consumers seek unique and visually appealing beverages. This trend is driven by the growing popularity of bubble tea shops and the desire for Instagram-worthy food and drink experiences.
Colored Tapioca Pearl Market Driver: Health Consciousness and Natural Ingredients
A key driver in the Colored Tapioca Pearl Market is health consciousness and the demand for natural ingredients. As more individuals focus on consuming products free from artificial colors and additives, there is a rising demand for colored tapioca pearls made with natural dyes. This demand supports market growth as consumers seek healthier and more natural beverage options.
Colored Tapioca Pearl Market Opportunity: Innovation in Flavors and Applications
One significant opportunity in the Colored Tapioca Pearl Market lies in innovation in flavors and applications. Companies can develop new products that offer a variety of flavors, such as fruit-infused or herbal pearls, and expand their use beyond bubble tea to other desserts and beverages. By offering diverse and innovative options, manufacturers can attract a broader consumer base and drive market growth.
Colored Tapioca Pearl Market Share Analysis- Largest Segment by Type
The 5 to 8 mm segment of the Colored Tapioca Pearl Market is the largest. This size range represents the most versatile and commonly used pearls in various culinary applications, including bubble tea, desserts, and garnishes. The 5 to 8 mm pearls offer a balance between chewiness and visual appeal, making them a popular choice among consumers and food service providers. This size is ideal for creating the desired texture and mouthfeel in beverages and dishes, contributing to its widespread use and leading market share. The consistency and versatility of 5 to 8 mm pearls ensure their dominance in the market, as they meet the diverse needs of both consumers and food manufacturers.
Colored Tapioca Pearl Market Share Analysis- Poised to Grow Fastest Over the Next Five Years by Application
The Food Service application segment in the Colored Tapioca Pearl Market is poised to grow the fastest over the next five years. This growth is driven by the expanding popularity of bubble tea and other tapioca-based products in cafes, restaurants, and fast-food outlets. As food service establishments increasingly incorporate innovative and visually appealing ingredients to attract customers, colored tapioca pearls offer a unique and enticing addition to their menus. Additionally, the trend of experiential dining and the desire for customized and premium food offerings are contributing to the rising demand for colored tapioca pearls in the food service sector. This segment's growth is expected to be fueled by its role in enhancing the customer experience and offering a distinctive product that stands out in the competitive food service market.
Colored Tapioca Pearl Market Segmentation
By Type
Up to 5 mm
5 to 8 mm
Above 8 mm
By Application
Food Processing
Food Service
Household Use
Countries Analyzed
North America (US, Canada, Mexico)
Europe (Germany, UK, France, Spain, Italy, Russia, Rest of Europe)
Asia Pacific (China, India, Japan, South Korea, Australia, South East Asia, Rest of Asia)
South America (Brazil, Argentina, Rest of South America)
Middle East and Africa (Saudi Arabia, UAE, Rest of Middle East, South Africa, Egypt, Rest of Africa)
Colored Tapioca Pearl Companies Profiled in the Study
Andes Food
Chen En Food Product Enterprise
Jiu Zhou Food
Kei Fu Foods
Shtastyplus
Sunnysyrup Food
Ting Jean Foods
Universal Thai International Enterprise
US Boba Company
*- List Not Exhaustive
Chapter 1. TABLE OF CONTENTS
Chapter 2. Introduction to Colored Tapioca Pearl Market
2.1. Market Overview
2.2. Key Statistics and Report Highlights
2.3. Scope of the Comprehensive Study
2.3.1. Market Definition
2.3.2 Countries and Regions Covered
2.3.3 Research Objective
2.3.4 Units, Currency, and Conversions
2.3.5 Industry Value Chain
2.4. Key Market Segments
2.5. Key Companies
2.6. Study Period
Chapter 3. Strategic Analysis Review
3.1. Colored Tapioca Pearl Pricing Analysis and Forecast
3.2. Porter’s Five Forces
3.3. Market Ecosystem
3.4. SWOT Analysis
3.5. Regulatory Scenario
3.3. Effects of Inflation, Russia-Ukraine War, moderating economic growth, and other macroeconomic factors
Chapter 4. Competitive Landscape
4.1. Market Share Analysis
4.1.1. Global Colored Tapioca Pearl Market Share by Company, 2023
4.1.2. Product Offerings of Leading Colored Tapioca Pearl Companies
4.2. Market Entropy
4.2.1. New Product Launches in the Industry
4.2.2. Mergers, Acquisitions, Joint ventures, and Partnerships
4.3. Key Strategies and Best Practices
Chapter 5. Global Market Projections: Best, Reference, and Low Case Scenarios
5.1. Growth Analysis- Case Scenario Definitions
5.2. Low Growth Case Scenario Forecasts
5.3. Reference Growth Case Scenario Forecasts
5.4. High Growth Case Scenario Forecasts
Chapter 6. Market Dynamics
6.1. Colored Tapioca Pearl Market Drivers
6.2. Colored Tapioca Pearl Market Challenges
6.6. Colored Tapioca Pearl Market Opportunities
6.4. Colored Tapioca Pearl Market Trends
Chapter 7. Global Colored Tapioca Pearl Market Outlook Trends
7.1. Global Colored Tapioca Pearl Revenue (USD Million) and CAGR (%) by Type (2021-2032)
7.2. Global Colored Tapioca Pearl Revenue (USD Million) and CAGR (%) by Application (2021-2032)
7.3. Global Colored Tapioca Pearl Revenue (USD Million) and CAGR (%) by Product (2021-2032)
By Type
Up to 5 mm
5 to 8 mm
Above 8 mm
By Application
Food Processing
Food Service
Household Use
Chapter 8. Global Colored Tapioca Pearl Regional Analysis and Outlook
8.1. Global Colored Tapioca Pearl Revenue (USD Million) By Regions (2021- 2032)
8.2. North America Colored Tapioca Pearl Revenue (USD Million) by Country (2021-2032)
8.2.1. United States Colored Tapioca Pearl Regional Analysis and Outlook
8.2.2. Canada Colored Tapioca Pearl Regional Analysis and Outlook
8.2.3. Mexico Colored Tapioca Pearl Regional Analysis and Outlook
8.3. Europe Colored Tapioca Pearl Revenue (USD Million), by Country (2021-2032)
8.3.1. Germany Colored Tapioca Pearl Regional Analysis and Outlook
8.3.2. France Colored Tapioca Pearl Regional Analysis and Outlook
8.3.3. United Kingdom Colored Tapioca Pearl Regional Analysis and Outlook
8.3.4. Spain Colored Tapioca Pearl Regional Analysis and Outlook
8.3.5. Italy Colored Tapioca Pearl Regional Analysis and Outlook
8.3.6. Russia Colored Tapioca Pearl Regional Analysis and Outlook
8.3.7. Rest of Europe Colored Tapioca Pearl Regional Analysis and Outlook
8.4. Asia Pacific Colored Tapioca Pearl Revenue (USD Million) by Country (2021-2032)
8.4.1. China Colored Tapioca Pearl Regional Analysis and Outlook
8.4.2. Japan Colored Tapioca Pearl Regional Analysis and Outlook
8.4.3. India Colored Tapioca Pearl Regional Analysis and Outlook
8.4.4. South Korea Colored Tapioca Pearl Regional Analysis and Outlook
8.4.5. Australia Colored Tapioca Pearl Regional Analysis and Outlook
8.4.6. South East Asia Colored Tapioca Pearl Regional Analysis and Outlook
8.4.7. Rest of Asia Pacific Colored Tapioca Pearl Regional Analysis and Outlook
8.5. South America Colored Tapioca Pearl Revenue (USD Million), by Country (2021-2032)
8.5.1. Brazil Colored Tapioca Pearl Regional Analysis and Outlook
8.5.2. Argentina Colored Tapioca Pearl Regional Analysis and Outlook
8.5.3. Rest of South America Colored Tapioca Pearl Regional Analysis and Outlook
8.6. Middle East and Africa Colored Tapioca Pearl Revenue (USD Million) by Country (2021-2032)
8.6.1. Middle East Colored Tapioca Pearl Regional Analysis and Outlook
8.6.2. Africa Colored Tapioca Pearl Regional Analysis and Outlook
Chapter 9. North America Colored Tapioca Pearl Analysis and Outlook
9.1. North America Colored Tapioca Pearl Revenue (USD Million) by Segments (2021-2032)
9.1.1. North America Colored Tapioca Pearl Revenue (USD Million) by Type (2021-2032)
9.1.2. North America Colored Tapioca Pearl Revenue (USD Million) by Application (2021-2032)
9.1.3. North America Colored Tapioca Pearl Revenue (USD Million) by Product (2021-2032)
By Type
Up to 5 mm
5 to 8 mm
Above 8 mm
By Application
Food Processing
Food Service
Household Use
Chapter 10. Europe Colored Tapioca Pearl Analysis and Outlook
10.1. Europe Colored Tapioca Pearl Revenue (USD Million), by Segments (USD Million) (2021-2032)
10.1.1. Europe Colored Tapioca Pearl Revenue (USD Million) by Type (2021-2032)
10.1.2. Europe Colored Tapioca Pearl Revenue (USD Million) by Application (2021-2032)
10.1.3. Europe Colored Tapioca Pearl Revenue (USD Million) by Product (2021-2032)
By Type
Up to 5 mm
5 to 8 mm
Above 8 mm
By Application
Food Processing
Food Service
Household Use
Chapter 11. Asia Pacific Colored Tapioca Pearl Analysis and Outlook
11.1. Asia Pacific Colored Tapioca Pearl Revenue (USD Million), and Revenue (USD Million) by Segments (2021-2032)
11.1.1. Asia Pacific Colored Tapioca Pearl Revenue (USD Million) by Type (2021-2032)
11.1.2. Asia Pacific Colored Tapioca Pearl Revenue (USD Million) by Application (2021-2032)
11.1.3. Asia Pacific Colored Tapioca Pearl Revenue (USD Million) by Product (2021-2032)
By Type
Up to 5 mm
5 to 8 mm
Above 8 mm
By Application
Food Processing
Food Service
Household Use
Chapter 12. South America Colored Tapioca Pearl Analysis and Outlook
12.1. South America Colored Tapioca Pearl Revenue (USD Million), by Segments (2021-2032)
12.1.1. South America Colored Tapioca Pearl Revenue (USD Million) by Type (2021-2032)
12.1.2. South America Colored Tapioca Pearl Revenue (USD Million) by Application (2021-2032)
12.1.3. South America Colored Tapioca Pearl Revenue (USD Million) by Product (2021-2032)
By Type
Up to 5 mm
5 to 8 mm
Above 8 mm
By Application
Food Processing
Food Service
Household Use
Chapter 13. Middle East and Africa Colored Tapioca Pearl Analysis and Outlook
13.1. Middle East and Africa Colored Tapioca Pearl Revenue (USD Million), by Segments (2021-2032)
13.1.1. Middle East and Africa Colored Tapioca Pearl Revenue (USD Million) by Type (2021-2032)
13.1.2. Middle East and Africa Colored Tapioca Pearl Revenue (USD Million) by Application (2021-2032)
13.1.3. Middle East and Africa Colored Tapioca Pearl Revenue (USD Million) by Product (2021-2032)
By Type
Up to 5 mm
5 to 8 mm
Above 8 mm
By Application
Food Processing
Food Service
Household Use
Chapter 14. Colored Tapioca Pearl Company Profiles
14.1 Business Overview
14.2 Product Profiles
14.3 SWOT Profiles
14.5 Recent Developments
14.6 Financial Profile
List of Companies
Andes Food
Chen En Food Product Enterprise
Jiu Zhou Food
Kei Fu Foods
Shtastyplus
Sunnysyrup Food
Ting Jean Foods
Universal Thai International Enterprise
US Boba Company
15. Methodology and Data Sources
15.1 Customization Offerings
15.2 Subscription Services
15.3 Related Reports
15.4 Publisher Expertise
LIST OF TABLES
Table 1 Market Segmentation Analysis
Table 2 Global Colored Tapioca Pearl Market Share of Leading Companies, 2023
Table 3 Product Offerings of Leading Companies
Table 4 Low Growth Scenario Forecasts
Table 5 Reference Case Growth Scenario
Table 6 High Growth Case Scenario
Table 7 Global Colored Tapioca Pearl Revenue (USD Million) And CAGR (%) By Type (2021-2032)
Table 8 Global Colored Tapioca Pearl Revenue (USD Million) And CAGR (%) By Application (2021-2032)
Table 9 Global Colored Tapioca Pearl Revenue (USD Million) And CAGR (%) By Product (2021-2032)
Table 10 Global Colored Tapioca Pearl Market Revenue (USD Million) By Regions (2021-2032)
Table 11 Global Colored Tapioca Pearl Market Share (%) By Regions (2021-2032)
Table 12 North America Colored Tapioca Pearl Revenue (USD Million) By Country (2021-2032)
Table 13 Europe Colored Tapioca Pearl Revenue (USD Million) By Country (2021-2032)
Table 14 Asia Pacific Colored Tapioca Pearl Revenue (USD Million) By Country (2021-2032)
Table 15 South America Colored Tapioca Pearl Revenue (USD Million) By Country (2021-2032)
Table 16 Middle East and Africa Colored Tapioca Pearl Revenue (USD Million) By Region (2021-2032)
Table 17 North America Colored Tapioca Pearl Revenue (USD Million) By Type (2021-2032)
Table 18 North America Colored Tapioca Pearl Revenue (USD Million) By Application (2021-2032)
Table 19 North America Colored Tapioca Pearl Revenue (USD Million) By Product (2021-2032)
Table 20 Europe Colored Tapioca Pearl Revenue (USD Million) By Type (2021-2032)
Table 21 Europe Colored Tapioca Pearl Revenue (USD Million) By Application (2021-2032)
Table 22 Europe Colored Tapioca Pearl Revenue (USD Million) By Product (2021-2032)
Table 23 Asia Pacific Colored Tapioca Pearl Revenue (USD Million) By Type (2021-2032)
Table 24 Asia Pacific Colored Tapioca Pearl Revenue (USD Million) By Application (2021-2032)
Table 25 Asia Pacific Colored Tapioca Pearl Revenue (USD Million) By Product (2021-2032)
Table 26 South America Colored Tapioca Pearl Revenue (USD Million) By Type (2021-2032)
Table 27 South America Colored Tapioca Pearl Revenue (USD Million) By Application (2021-2032)
Table 28 South America Colored Tapioca Pearl Revenue (USD Million) By Product (2021-2032)
Table 29 Middle East and Africa Colored Tapioca Pearl Revenue (USD Million) By Type (2021-2032)
Table 30 Middle East and Africa Colored Tapioca Pearl Revenue (USD Million) By Application (2021-2032)
Table 31 Middle East and Africa Colored Tapioca Pearl Revenue (USD Million) By Product (2021-2032)
LIST OF FIGURES
Figure 1. Market Scope
Figure 2. Pricing Forecasts Per Unit, 2023- 2032
Figure 3. Porter’s Five Forces
Figure 4. Global Colored Tapioca Pearl Market Revenue (USD Million) By Regions (2021-2032)
Figure 5. Global Colored Tapioca Pearl Market Share (%) By Regions (2023)
Figure 6. North America Colored Tapioca Pearl Revenue (USD Million) By Country (2021-2032)
Figure 7. United States Colored Tapioca Pearl Revenue (USD Million) By Country (2021-2032)
Figure 8. Canada Colored Tapioca Pearl Revenue (USD Million) By Country (2021-2032)
Figure 9. Mexico Colored Tapioca Pearl Revenue (USD Million) By Country (2021-2032)
Figure 10. Europe Colored Tapioca Pearl Revenue (USD Million) By Country (2021-2032)
Figure 11. Germany Colored Tapioca Pearl Revenue (USD Million) By Country (2021-2032)
Figure 12. France Colored Tapioca Pearl Revenue (USD Million) By Country (2021-2032)
Figure 13. United Kingdom Colored Tapioca Pearl Revenue (USD Million) By Country (2021-2032)
Figure 14. Spain Colored Tapioca Pearl Revenue (USD Million) By Country (2021-2032)
Figure 15. Italy Colored Tapioca Pearl Revenue (USD Million) By Country (2021-2032)
Figure 16. Russia Colored Tapioca Pearl Revenue (USD Million) By Country (2021-2032)
Figure 17. Rest of Europe Colored Tapioca Pearl Revenue (USD Million) By Country (2021-2032)
Figure 11. Asia Pacific Colored Tapioca Pearl Revenue (USD Million) By Country (2021-2032)
Figure 12. China Colored Tapioca Pearl Revenue (USD Million) By Country (2021-2032)
Figure 13. Japan Colored Tapioca Pearl Revenue (USD Million) By Country (2021-2032)
Figure 14. India Colored Tapioca Pearl Revenue (USD Million) By Country (2021-2032)
Figure 15. South Korea Colored Tapioca Pearl Revenue (USD Million) By Country (2021-2032)
Figure 16. Australia Colored Tapioca Pearl Revenue (USD Million) By Country (2021-2032)
Figure 17. South East Asia Colored Tapioca Pearl Revenue (USD Million) By Country (2021-2032)
Figure 18. South America Colored Tapioca Pearl Revenue (USD Million) By Country (2021-2032)
Figure 19. Brazil Colored Tapioca Pearl Revenue (USD Million) By Country (2021-2032)
Figure 20. Argentina Colored Tapioca Pearl Revenue (USD Million) By Country (2021-2032)
Figure 21. Rest of Asia Pacific Colored Tapioca Pearl Revenue (USD Million) By Country (2021-2032)
Figure 22. Middle East and Africa Colored Tapioca Pearl Revenue (USD Million) By Region (2021-2032)
Figure 23. Saudi Arabia Colored Tapioca Pearl Revenue (USD Million) By Region (2021-2032)
Figure 24. The UAE Colored Tapioca Pearl Revenue (USD Million) By Region (2021-2032)
Figure 25. Rest of Middle East Colored Tapioca Pearl Revenue (USD Million) By Region (2021-2032)
Figure 26. South Africa Colored Tapioca Pearl Revenue (USD Million) By Region (2021-2032)
Figure 27. Africa Colored Tapioca Pearl Revenue (USD Million) By Region (2021-2032)
Figure 28. North America Colored Tapioca Pearl Revenue (USD Million) By Type (2021-2032)
Figure 29. North America Colored Tapioca Pearl Revenue (USD Million) By Application (2021-2032)
Figure 30. North America Colored Tapioca Pearl Revenue (USD Million) By Product (2021-2032)
Figure 31. Europe Colored Tapioca Pearl Revenue (USD Million) By Type (2021-2032)
Figure 32. Europe Colored Tapioca Pearl Revenue (USD Million) By Application (2021-2032)
Figure 33. Europe Colored Tapioca Pearl Revenue (USD Million) By Product (2021-2032)
Figure 34. Asia Pacific Colored Tapioca Pearl Revenue (USD Million) By Type (2021-2032)
Figure 35. Asia Pacific Colored Tapioca Pearl Revenue (USD Million) By Application (2021-2032)
Figure 36. Asia Pacific Colored Tapioca Pearl Revenue (USD Million) By Product (2021-2032)
Figure 37. South America Colored Tapioca Pearl Revenue (USD Million) By Type (2021-2032)
Figure 38. South America Colored Tapioca Pearl Revenue (USD Million) By Application (2021-2032)
Figure 39. South America Colored Tapioca Pearl Revenue (USD Million) By Product (2021-2032)
Figure 40. Middle East and Africa Colored Tapioca Pearl Revenue (USD Million) By Type (2021-2032)
Figure 41. Middle East and Africa Colored Tapioca Pearl Revenue (USD Million) By Application (2021-2032)
Figure 42. Middle East and Africa Colored Tapioca Pearl Revenue (USD Million) By Product (2021-2032)
By Type
Up to 5 mm
5 to 8 mm
Above 8 mm
By Application
Food Processing
Food Service
Household Use
Countries Analyzed
North America (US, Canada, Mexico)
Europe (Germany, UK, France, Spain, Italy, Russia, Rest of Europe)
Asia Pacific (China, India, Japan, South Korea, Australia, South East Asia, Rest of Asia)
South America (Brazil, Argentina, Rest of South America)
Middle East and Africa (Saudi Arabia, UAE, Rest of Middle East, South Africa, Egypt, Rest of Africa)
