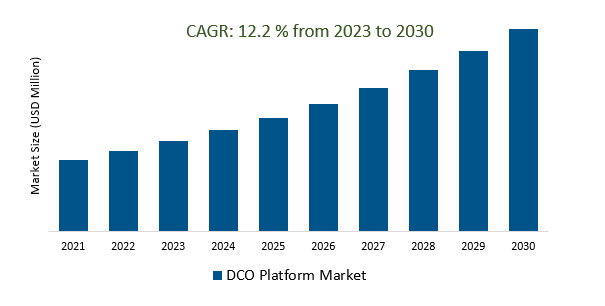
The Global DCO Platform Market Size is estimated to register 12.2% growth over the forecast period from 2023 to 2030.
The market growth is driven by an increasing growth of programmatic advertising has driven the adoption of DCO platforms, as they help automate and optimize ad creative in real-time auctions. Leading Companies focusing on AI and Machine Learning Integration, Hyper-Personalization, Cross-Device and Cross-Channel Optimization, Privacy and Compliance, Video and Interactive Content, Dynamic Content for Events and Real-Time Campaigns, and others to boost market shares in the industry.
Market Overview
The DCO (Dynamic Creative Optimization) platform market is a subset of the digital advertising and marketing industry, specializing in real-time personalized ad content. Key features include real-time personalization, cross-channel delivery, data integration, performance analytics, and optimization algorithms. Market drivers include the demand for personalization, programmatic advertising, data-driven marketing, and the e-commerce boom. Major players in the DCO market include Adform, Google Marketing Platform, Sizmek (acquired by Amazon Advertising), and Adobe Advertising Cloud. The market is expected to continue growing, with potential for consolidation, innovation, and adaptation to evolving data privacy regulations and ethical advertising practices.
Market Dynamics
Market Trends- DCO platforms enable data-driven marketing by allowing marketers to deliver personalized and targeted ads to consumers based on their individual data and preferences.
DCO platforms are at the forefront of data-driven marketing, empowering advertisers to provide highly personalized and targeted advertisements to consumers. Leveraging the wealth of available user data and preferences, these platforms create and deliver dynamic ad content in real-time. By tailoring ads to individual user profiles, DCO platforms enhance the relevance of marketing campaigns, leading to increased engagement and conversion rates.
Market Driver- The demand for DCO platforms is growing as marketers increasingly adopt data-driven marketing strategies.
The DCO platform market is experiencing a surge in demand, driven by marketers' adoption of data-driven marketing strategies. With a growing emphasis on data analysis and personalization, DCO platforms have become indispensable tools for advertisers seeking to deliver highly targeted and dynamic ad content to their audiences. This trend reflects a broader shift in the marketing landscape, where data-driven approaches are central to optimizing ad campaigns and enhancing customer engagement, ultimately underlining the market's robust growth trajectory.
Market Opportunity- DCO platforms enable cross-channel marketing by allowing marketers to deliver personalized and targeted ads to consumers across different channels, such as display, social media, and email.
DCO platforms play a pivotal role in enabling cross-channel marketing, empowering marketers to deliver highly personalized and targeted advertisements across a spectrum of digital channels, including display, social media, and email. This capability ensures consistent messaging and branding across diverse platforms, providing a seamless and integrated experience for consumers. By tailoring content to each channel, DCO platforms help marketers maintain brand identity while optimizing engagement and conversions, reflecting the increasing importance of multi-channel strategies in the DCO platform market.
Market Share Analysis- Advertisers DCO Platform Market will register the fastest growth
The Global DCO Platform Market is analyzed across Publishers, Advertisers, and others. Advertisers are poised to register the fastest growth. The Advertisers DCO Platform Market focuses on platforms that help advertisers create and deliver highly personalized and optimized ad content, enabling them to reach their target audiences effectively, enhance ad performance, and optimize campaigns across various digital channels.
Market Share Analysis- Cloud-based held a significant market share in 2023
The Global DCO Platform Market is analyzed across various Types including Cloud-based, On-premises, and others. Of these, Cloud-based held a significant market share in 2023. The Cloud-based DCO Platform Market comprises DCO platforms that operate in a cloud-based environment, providing scalable and flexible solutions for advertisers to create and deliver personalized, real-time ad content. These platforms offer advantages such as cost-effectiveness and remote accessibility, making them increasingly popular in the digital advertising industry.
DCO Platform Market Segmentation
By Application
- Publishers
- Advertisers
- Others
By Type
By Region
- North America (United States, Canada, Mexico)
- Europe (Germany, France, United Kingdom, Spain, Italy, Others)
- Asia Pacific (China, India, Japan, South Korea, Australia, Others)
- Latin America (Brazil, Argentina, Others)
- Middle East and Africa (Saudi Arabia, UAE, Kuwait, Other Middle East, South Africa, Nigeria, Other Africa)
DCO Platform Market Companies
- IBM
- Amazon
- Adobe
- Facebook
- Google
- Thunder Experience Cloud
- AdButler
- Nativo,Inc
- Adzymic
- Adylic
- Smartly.io Inc.
- Celtra Inc.
- MediaMath
- Bannerwise
- Bannerflow
- Gamned
- Storyteq
- CLINCH
- Sizmek
- Adform
- Groovinads
*List not exhaustive
DCO Platform Market Outlook 2023
1 Market Overview
1.1 Introduction to the DCO Platform Market
1.2 Scope of the Study
1.3 Research Objective
1.3.1 Key Market Scope and Segments
1.3.2 Players Covered
1.3.3 Years Considered
2 Executive Summary
2.1 2023 DCO Platform Industry- Market Statistics
3 Market Dynamics
3.1 Market Drivers
3.2 Market Challenges
3.3 Market Opportunities
3.4 Market Trends
4 Market Factor Analysis
4.1 Porter’s Five Forces
4.2 Market Entropy
4.2.1 Global DCO Platform Market Companies with Area Served
4.2.2 Products Offerings Global DCO Platform Market
5 COVID-19 Impact Analysis and Outlook Scenarios
5.1.1 Covid-19 Impact Analysis
5.1.2 post-COVID-19 Scenario- Low Growth Case
5.1.3 post-COVID-19 Scenario- Reference Growth Case
5.1.4 post-COVID-19 Scenario- Low Growth Case
6 Global DCO Platform Market Trends
6.1 Global DCO Platform Revenue (USD Million) and CAGR (%) by Type (2018-2030)
6.2 Global DCO Platform Revenue (USD Million) and CAGR (%) by Applications (2018-2030)
6.3 Global DCO Platform Revenue (USD Million) and CAGR (%) by regions (2018-2030)
7 Global DCO Platform Market Revenue (USD Million) by Type, and Applications (2018-2022)
7.1 Global DCO Platform Revenue (USD Million) by Type (2018-2022)
7.1.1 Global DCO Platform Revenue (USD Million), Market Share (%) by Type (2018-2022)
7.2 Global DCO Platform Revenue (USD Million) by Applications (2018-2022)
7.2.1 Global DCO Platform Revenue (USD Million), Market Share (%) by Applications (2018-2022)
8 Global DCO Platform Development Regional Status and Outlook
8.1 Global DCO Platform Revenue (USD Million) By Regions (2018-2022)
8.2 North America DCO Platform Revenue (USD Million) by Type, and Application (2018-2022)
8.2.1 North America DCO Platform Revenue (USD Million) by Country (2018-2022)
8.2.2 North America DCO Platform Revenue (USD Million) by Type (2018-2022)
8.2.3 North America DCO Platform Revenue (USD Million) by Applications (2018-2022)
8.3 Europe DCO Platform Revenue (USD Million), by Type, and Applications (USD Million) (2018-2022)
8.3.1 Europe DCO Platform Revenue (USD Million), by Country (2018-2022)
8.3.2 Europe DCO Platform Revenue (USD Million) by Type (2018-2022)
8.3.3 Europe DCO Platform Revenue (USD Million) by Applications (2018-2022)
8.4 Asia Pacific DCO Platform Revenue (USD Million), and Revenue (USD Million) by Type, and Applications (2018-2022)
8.4.1 Asia Pacific DCO Platform Revenue (USD Million) by Country (2018-2022)
8.4.2 Asia Pacific DCO Platform Revenue (USD Million) by Type (2018-2022)
8.4.3 Asia Pacific DCO Platform Revenue (USD Million) by Applications (2018-2022)
8.5 South America DCO Platform Revenue (USD Million), by Type, and Applications (2018-2022)
8.5.1 South America DCO Platform Revenue (USD Million), by Country (2018-2022)
8.5.2 South America DCO Platform Revenue (USD Million) by Type (2018-2022)
8.5.3 South America DCO Platform Revenue (USD Million) by Applications (2018-2022)
8.6 Middle East and Africa DCO Platform Revenue (USD Million), by Type, Technology, Application, Thickness (2018-2022)
8.6.1 Middle East and Africa DCO Platform Revenue (USD Million) by Country (2018-2022)
8.6.2 Middle East and Africa DCO Platform Revenue (USD Million) by Type (2018-2022)
8.6.3 Middle East and Africa DCO Platform Revenue (USD Million) by Applications (2018-2022)
9 Company Profiles
10 Global DCO Platform Market Revenue (USD Million), by Type, and Applications (2023-2030)
10.1 Global DCO Platform Revenue (USD Million) and Market Share (%) by Type (2023-2030)
10.1.1 Global DCO Platform Revenue (USD Million), and Market Share (%) by Type (2023-2030)
10.2 Global DCO Platform Revenue (USD Million) and Market Share (%) by Applications (2023-2030)
10.2.1 Global DCO Platform Revenue (USD Million), and Market Share (%) by Applications (2023-2030)
11 Global DCO Platform Development Regional Status and Outlook Forecast
11.1 Global DCO Platform Revenue (USD Million) By Regions (2023-2030)
11.2 North America DCO Platform Revenue (USD Million) by Type, and Applications (2023-2030)
11.2.1 North America DCO Platform Revenue (USD) Million by Country (2023-2030)
11.2.2 North America DCO Platform Revenue (USD Million), by Type (2023-2030)
11.2.3 North America DCO Platform Revenue (USD Million), Market Share (%) by Applications (2023-2030)
11.3 Europe DCO Platform Revenue (USD Million), by Type, and Applications (2023-2030)
11.3.1 Europe DCO Platform Revenue (USD Million), by Country (2023-2030)
11.3.2 Europe DCO Platform Revenue (USD Million), by Type (2023-2030)
11.3.3 Europe DCO Platform Revenue (USD Million), by Applications (2023-2030)
11.4 Asia Pacific DCO Platform Revenue (USD Million) by Type, and Applications (2023-2030)
11.4.1 Asia Pacific DCO Platform Revenue (USD Million), by Country (2023-2030)
11.4.2 Asia Pacific DCO Platform Revenue (USD Million), by Type (2023-2030)
11.4.3 Asia Pacific DCO Platform Revenue (USD Million), by Applications (2023-2030)
11.5 South America DCO Platform Revenue (USD Million), by Type, and Applications (2023-2030)
11.5.1 South America DCO Platform Revenue (USD Million), by Country (2023-2030)
11.5.2 South America DCO Platform Revenue (USD Million), by Type (2023-2030)
11.5.3 South America DCO Platform Revenue (USD Million), by Applications (2023-2030)
11.6 Middle East and Africa DCO Platform Revenue (USD Million), by Type, and Applications (2023-2030)
11.6.1 Middle East and Africa DCO Platform Revenue (USD Million), by region (2023-2030)
11.6.2 Middle East and Africa DCO Platform Revenue (USD Million), by Type (2023-2030)
11.6.3 Middle East and Africa DCO Platform Revenue (USD Million), by Applications (2023-2030)
12 Methodology and Data Sources
12.1 Methodology/Research Approach
12.1.1 Research Programs/Design
12.1.2 Market Size Estimation
12.1.3 Market Breakdown and Data Triangulation
12.2 Data Sources
12.2.1 Secondary Sources
12.2.2 Primary Sources
12.3 Disclaimer
List of Tables
Table 1 Market Segmentation Analysis
Table 2 Global DCO Platform Market Companies with Areas Served
Table 3 Products Offerings Global DCO Platform Market
Table 4 Low Growth Scenario Forecasts
Table 5 Reference Case Growth Scenario
Table 6 High Growth Case Scenario
Table 7 Global DCO Platform Revenue (USD Million) And CAGR (%) By Type (2018-2030)
Table 8 Global DCO Platform Revenue (USD Million) And CAGR (%) By Applications (2018-2030)
Table 9 Global DCO Platform Revenue (USD Million) And CAGR (%) By Regions (2018-2030)
Table 10 Global DCO Platform Revenue (USD Million) By Type (2018-2022)
Table 11 Global DCO Platform Revenue Market Share (%) By Type (2018-2022)
Table 12 Global DCO Platform Revenue (USD Million) By Applications (2018-2022)
Table 13 Global DCO Platform Revenue Market Share (%) By Applications (2018-2022)
Table 14 Global DCO Platform Market Revenue (USD Million) By Regions (2018-2022)
Table 15 Global DCO Platform Market Share (%) By Regions (2018-2022)
Table 16 North America DCO Platform Revenue (USD Million) By Country (2018-2022)
Table 17 North America DCO Platform Revenue (USD Million) By Type (2018-2022)
Table 18 North America DCO Platform Revenue (USD Million) By Applications (2018-2022)
Table 19 Europe DCO Platform Revenue (USD Million) By Country (2018-2022)
Table 20 Europe DCO Platform Revenue (USD Million) By Type (2018-2022)
Table 21 Europe DCO Platform Revenue (USD Million) By Applications (2018-2022)
Table 22 Asia Pacific DCO Platform Revenue (USD Million) By Country (2018-2022)
Table 23 Asia Pacific DCO Platform Revenue (USD Million) By Type (2018-2022)
Table 24 Asia Pacific DCO Platform Revenue (USD Million) By Applications (2018-2022)
Table 25 South America DCO Platform Revenue (USD Million) By Country (2018-2022)
Table 26 South America DCO Platform Revenue (USD Million) By Type (2018-2022)
Table 27 South America DCO Platform Revenue (USD Million) By Applications (2018-2022)
Table 28 Middle East and Africa DCO Platform Revenue (USD Million) By Region (2018-2022)
Table 29 Middle East and Africa DCO Platform Revenue (USD Million) By Type (2018-2022)
Table 30 Middle East and Africa DCO Platform Revenue (USD Million) By Applications (2018-2022)
Table 31 Financial Analysis
Table 32 Global DCO Platform Revenue (USD Million) By Type (2023-2030)
Table 33 Global DCO Platform Revenue Market Share (%) By Type (2023-2030)
Table 34 Global DCO Platform Revenue (USD Million) By Applications (2023-2030)
Table 35 Global DCO Platform Revenue Market Share (%) By Applications (2023-2030)
Table 36 Global DCO Platform Market Revenue (USD Million), And Revenue (USD Million) By Regions (2023-2030)
Table 37 North America DCO Platform Revenue (USD)By Country (2023-2030)
Table 38 North America DCO Platform Revenue (USD Million) By Type (2023-2030)
Table 39 North America DCO Platform Revenue (USD Million) By Applications (2023-2030)
Table 40 Europe DCO Platform Revenue (USD Million) By Country (2023-2030)
Table 41 Europe DCO Platform Revenue (USD Million) By Type (2023-2030)
Table 42 Europe DCO Platform Revenue (USD Million) By Applications (2023-2030)
Table 43 Asia Pacific DCO Platform Revenue (USD Million) By Country (2023-2030)
Table 44 Asia Pacific DCO Platform Revenue (USD Million) By Type (2023-2030)
Table 45 Asia Pacific DCO Platform Revenue (USD Million) By Applications (2023-2030)
Table 46 South America DCO Platform Revenue (USD Million) By Country (2023-2030)
Table 47 South America DCO Platform Revenue (USD Million) By Type (2023-2030)
Table 48 South America DCO Platform Revenue (USD Million) By Applications (2023-2030)
Table 49 Middle East and Africa DCO Platform Revenue (USD Million) By Region (2023-2030)
Table 50 Middle East and Africa DCO Platform Revenue (USD Million) By Region (2023-2030)
Table 51 Middle East and Africa DCO Platform Revenue (USD Million) By Type (2023-2030)
Table 52 Middle East and Africa DCO Platform Revenue (USD Million) By Applications (2023-2030)
Table 53 Research Programs/Design for This Report
Table 54 Key Data Information from Secondary Sources
Table 55 Key Data Information from Primary Sources
List of Figures
Figure 1 Market Scope
Figure 2 Porter’s Five Forces
Figure 3 Global DCO Platform Revenue (USD Million) By Type (2018-2022)
Figure 4 Global DCO Platform Revenue Market Share (%) By Type (2022)
Figure 5 Global DCO Platform Revenue (USD Million) By Applications (2018-2022)
Figure 6 Global DCO Platform Revenue Market Share (%) By Applications (2022)
Figure 7 Global DCO Platform Market Revenue (USD Million) By Regions (2018-2022)
Figure 8 Global DCO Platform Market Share (%) By Regions (2022)
Figure 9 North America DCO Platform Revenue (USD Million) By Country (2018-2022)
Figure 10 North America DCO Platform Revenue (USD Million) By Type (2018-2022)
Figure 11 North America DCO Platform Revenue (USD Million) By Applications (2018-2022)
Figure 12 Europe DCO Platform Revenue (USD Million) By Country (2018-2022)
Figure 13 Europe DCO Platform Revenue (USD Million) By Type (2018-2022)
Figure 14 Europe DCO Platform Revenue (USD Million) By Applications (2018-2022)
Figure 15 Asia Pacific DCO Platform Revenue (USD Million) By Country (2018-2022)
Figure 16 Asia Pacific DCO Platform Revenue (USD Million) By Type (2018-2022)
Figure 17 Asia Pacific DCO Platform Revenue (USD Million) By Applications (2018-2022)
Figure 18 South America DCO Platform Revenue (USD Million) By Country (2018-2022)
Figure 19 South America DCO Platform Revenue (USD Million) By Type (2018-2022)
Figure 20 South America DCO Platform Revenue (USD Million) By Applications (2018-2022)
Figure 21 Middle East and Africa DCO Platform Revenue (USD Million) By Region (2018-2022)
Figure 22 Middle East and Africa DCO Platform Revenue (USD Million) By Type (2018-2022)
Figure 23 Middle East and Africa DCO Platform Revenue (USD Million) By Applications (2018-2022)
Figure 24 Global DCO Platform Revenue (USD Million) By Type (2023-2030)
Figure 25 Global DCO Platform Revenue Market Share (%) By Type (2030)
Figure 26 Global DCO Platform Revenue (USD Million) By Applications (2023-2030)
Figure 27 Global DCO Platform Revenue Market Share (%) By Applications (2030)
Figure 28 Global DCO Platform Market Revenue (USD Million) By Regions (2023-2030)
Figure 29 North America DCO Platform Revenue (USD Million) By Country (2023-2030)
Figure 30 North America DCO Platform Revenue (USD Million) By Type (2023-2030)
Figure 31 North America DCO Platform Revenue (USD Million) By Applications (2023-2030)
Figure 32 Europe DCO Platform Revenue (USD Million) By Country (2023-2030)
Figure 33 Europe DCO Platform Revenue (USD Million) By Type (2023-2030)
Figure 34 Europe DCO Platform Revenue (USD Million) By Applications (2023-2030)
Figure 35 Asia Pacific DCO Platform Revenue (USD Million) By Country (2023-2030)
Figure 36 Asia Pacific DCO Platform Revenue (USD Million) By Type (2023-2030)
Figure 37 Asia Pacific DCO Platform Revenue (USD Million) By Applications (2023-2030)
Figure 38 South America DCO Platform Revenue (USD Million) By Country (2023-2030)
Figure 39 South America DCO Platform Revenue (USD Million) By Type (2023-2030)
Figure 40 South America DCO Platform Revenue (USD Million) By Applications (2023-2030)
Figure 41 Middle East and Africa DCO Platform Revenue (USD Million) By Region (2023-2030)
Figure 42 Middle East and Africa DCO Platform Revenue (USD Million) By Region (2023-2030)
Figure 43 Middle East and Africa DCO Platform Revenue (USD Million) By Type (2023-2030)
Figure 44 Middle East and Africa DCO Platform Revenue (USD Million) By Applications (2023-2030)
Figure 45 Bottom-Up and Top-Down Approaches for This Report
Figure 46 Data Triangulation
