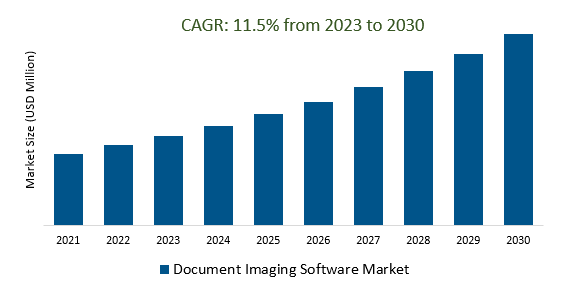
The Global Document Imaging Software Market Size is estimated to register 11.5% growth over the forecast period from 2023 to 2030.
The digital transformation of industries has led to a growing demand for document imaging software to convert paper-based documents into digital formats. This is driven by the need to improve efficiency, reduce costs, and enhance data accessibility. Compliance and regulations, particularly in healthcare and finance, have also driven the adoption of document imaging software. Cost savings can be achieved by reducing paper usage and streamlining document retrieval processes. The rise of remote work and collaboration has increased the demand for secure document sharing and collaboration. The integration of AI and automation has also led to the development of mobile-friendly document imaging applications. Cloud-based solutions, security features, seamless integration with ecosystems, improved user experience, blockchain for document verification, and environmental sustainability are also driving trends in document imaging software.
Efficiency and Accessibility in the Ongoing Digital Transformation Era is boosting the market.
Efficiency and Accessibility are becoming pivotal in the ongoing Digital Transformation Era, revolutionizing the Document Imaging Software Market. This paradigm shift is driven by the need for streamlined data management, collaboration, and accessibility. Organizations are increasingly adopting advanced imaging software solutions to optimize document processing, reducing manual efforts and errors. Furthermore, the growing reliance on remote work and the need for secure document sharing have intensified the demand for these solutions. The Document Imaging Software Market is witnessing substantial growth as businesses strive to enhance productivity, reduce costs, and improve overall document management. As technology evolves, it is poised to further expand its footprint in this transformative era, catering to an ever-widening range of industries and applications.
Document Imaging Software helps in Cost Savings and creates a demand in the market.
Document Imaging Software is a game-changer, not only streamlining business operations but also yielding substantial cost savings. This innovative technology simplifies the process of digitizing and managing documents, reducing the need for physical storage and manual paperwork. As organizations increasingly adopt Document Imaging Software, it has fueled a burgeoning demand in the market. This surge in demand is driven by the desire to enhance efficiency, boost productivity, and meet evolving compliance and data security standards. Furthermore, the Document Imaging Software market is witnessing remarkable growth, as businesses recognize the long-term benefits of transitioning to a paperless environment. This trend reflects a paradigm shift in the way businesses handle information, underscoring the software's pivotal role in shaping the future of document management.
Enhanced Security and Compliance Features in Document Imaging Software is attracting a wide customer base.
The Document Imaging Software Market is experiencing a surge in popularity, primarily due to the incorporation of enhanced security and compliance features. These advanced functionalities have become a major draw for a diverse customer base. Organizations are increasingly turning to document imaging software to safeguard sensitive information and ensure regulatory compliance. This trend is particularly evident in sectors like finance, healthcare, and legal, where data security is paramount. The adoption of such software is not only streamlining document management but also instilling confidence in clients regarding data protection. Consequently, the Document Imaging Software Market is witnessing significant growth and expanding its reach across various industries.
Market Share Analysis:
Solutions is the most dominant segment of the Document Imaging Software Market.
In the dynamic landscape of the Document Imaging Software Market, the Solutions segment stands out as the undisputed leader. Its prominence is rooted in the fact that these software solutions offer comprehensive and efficient tools for managing and processing documents. From document capture to storage, retrieval, and workflow automation, Document Imaging Solutions cater to a wide array of business needs. They empower organizations to streamline their document management processes, reduce paper-based inefficiencies, and enhance productivity. As a result, the Solutions segment continues to be the cornerstone of this ever-evolving market, driving technological innovation and shaping the way businesses manage their documents.
BFSI (Banking, Financial Services, and Insurance) is the most dominant application in the Document Imaging Software Market.
The Document Imaging Software Market is characterized by its diverse range of applications, with BFSI (Banking, Financial Services, and Insurance) standing out as the most dominant sector. This prominence can be attributed to the critical role document imaging software plays in enhancing efficiency and security within these financial sectors. Banking institutions rely on document imaging to streamline their record-keeping processes, ensuring faster access to essential financial data. In the realm of insurance, document imaging aids in the efficient management of policy documents and claims, contributing to customer satisfaction. Financial services, too, benefit greatly from document imaging software by optimizing data handling and improving compliance in a highly regulated environment.
Cloud-based document imaging software is the most dominant in the document imaging software market.
The dominance of this stems from its ability to offer unparalleled flexibility and accessibility. By harnessing the power of the cloud, users can effortlessly scan, store, and retrieve documents from anywhere with an internet connection, promoting remote work and collaboration. Moreover, the scalable nature of cloud solutions provides cost-efficiency and eliminates the need for on-premises infrastructure. As businesses increasingly prioritize digital document management, the cloud-based approach continues to set the industry standard.
North America reigns supreme in the document imaging software market due to several key factors.
The region stands out with its widespread adoption of digital technologies, a profusion of multinational corporations and government agencies, and an escalating requirement for regulatory compliance. Furthermore, the recognition of the manifold advantages of document imaging software, such as enhanced efficiency and cost reduction, bolsters North America's dominance in this market. Within North America, the United States emerges as the primary market for document imaging software. Its expansive enterprise sector plays a pivotal role in driving demand, while the US government's extensive use of such software for purposes like tax collection and law enforcement further solidifies North America's preeminence in this industry.
Document Imaging Software Market Segmentation
By Type
By Application
- BFSI
- Education
- Government
- Healthcare
- Corporate
- Others
By Deployment
- On-Premises
- Cloud-Based
- Hybrid
By Organization Size
By Region
- North America (United States, Canada, Mexico)
- Europe (Germany, France, United Kingdom, Spain, Italy, Others)
- Asia Pacific (China, India, Japan, South Korea, Australia, Others)
- Latin America (Brazil, Argentina, Others)
- Middle East and Africa (Saudi Arabia, UAE, Kuwait, Other Middle East, South Africa, Nigeria, Other Africa)
Document Imaging Software Market Companies
- IBM (United States)
- Xerox Corporation (United States)
- Adobe Systems Inc (United States)
- Epson (Japan)
- Fujitsu (Japan)
- eFile Cabinet (United States)
- Canon (Japan)
- Toshiba Corporation (Japan)
- BIT.AI (United States)
- Inco Docs (Australia)
*List not exhaustive
Document Imaging Software Market Outlook 2023
1 Market Overview
1.1 Introduction to the Document Imaging Software Market
1.2 Scope of the Study
1.3 Research Objective
1.3.1 Key Market Scope and Segments
1.3.2 Players Covered
1.3.3 Years Considered
2 Executive Summary
2.1 2023 Document Imaging Software Industry- Market Statistics
3 Market Dynamics
3.1 Market Drivers
3.2 Market Challenges
3.3 Market Opportunities
3.4 Market Trends
4 Market Factor Analysis
4.1 Porter’s Five Forces
4.2 Market Entropy
4.2.1 Global Document Imaging Software Market Companies with Area Served
4.2.2 Products Offerings Global Document Imaging Software Market
5 COVID-19 Impact Analysis and Outlook Scenarios
5.1.1 Covid-19 Impact Analysis
5.1.2 post-COVID-19 Scenario- Low Growth Case
5.1.3 post-COVID-19 Scenario- Reference Growth Case
5.1.4 post-COVID-19 Scenario- Low Growth Case
6 Global Document Imaging Software Market Trends
6.1 Global Document Imaging Software Revenue (USD Million) and CAGR (%) by Type (2018-2030)
6.2 Global Document Imaging Software Revenue (USD Million) and CAGR (%) by Applications (2018-2030)
6.3 Global Document Imaging Software Revenue (USD Million) and CAGR (%) by regions (2018-2030)
7 Global Document Imaging Software Market Revenue (USD Million) by Type, and Applications (2018-2022)
7.1 Global Document Imaging Software Revenue (USD Million) by Type (2018-2022)
7.1.1 Global Document Imaging Software Revenue (USD Million), Market Share (%) by Type (2018-2022)
7.2 Global Document Imaging Software Revenue (USD Million) by Applications (2018-2022)
7.2.1 Global Document Imaging Software Revenue (USD Million), Market Share (%) by Applications (2018-2022)
8 Global Document Imaging Software Development Regional Status and Outlook
8.1 Global Document Imaging Software Revenue (USD Million) By Regions (2018-2022)
8.2 North America Document Imaging Software Revenue (USD Million) by Type, and Application (2018-2022)
8.2.1 North America Document Imaging Software Revenue (USD Million) by Country (2018-2022)
8.2.2 North America Document Imaging Software Revenue (USD Million) by Type (2018-2022)
8.2.3 North America Document Imaging Software Revenue (USD Million) by Applications (2018-2022)
8.3 Europe Document Imaging Software Revenue (USD Million), by Type, and Applications (USD Million) (2018-2022)
8.3.1 Europe Document Imaging Software Revenue (USD Million), by Country (2018-2022)
8.3.2 Europe Document Imaging Software Revenue (USD Million) by Type (2018-2022)
8.3.3 Europe Document Imaging Software Revenue (USD Million) by Applications (2018-2022)
8.4 Asia Pacific Document Imaging Software Revenue (USD Million), and Revenue (USD Million) by Type, and Applications (2018-2022)
8.4.1 Asia Pacific Document Imaging Software Revenue (USD Million) by Country (2018-2022)
8.4.2 Asia Pacific Document Imaging Software Revenue (USD Million) by Type (2018-2022)
8.4.3 Asia Pacific Document Imaging Software Revenue (USD Million) by Applications (2018-2022)
8.5 South America Document Imaging Software Revenue (USD Million), by Type, and Applications (2018-2022)
8.5.1 South America Document Imaging Software Revenue (USD Million), by Country (2018-2022)
8.5.2 South America Document Imaging Software Revenue (USD Million) by Type (2018-2022)
8.5.3 South America Document Imaging Software Revenue (USD Million) by Applications (2018-2022)
8.6 Middle East and Africa Document Imaging Software Revenue (USD Million), by Type, Technology, Application, Thickness (2018-2022)
8.6.1 Middle East and Africa Document Imaging Software Revenue (USD Million) by Country (2018-2022)
8.6.2 Middle East and Africa Document Imaging Software Revenue (USD Million) by Type (2018-2022)
8.6.3 Middle East and Africa Document Imaging Software Revenue (USD Million) by Applications (2018-2022)
9 Company Profiles
10 Global Document Imaging Software Market Revenue (USD Million), by Type, and Applications (2023-2030)
10.1 Global Document Imaging Software Revenue (USD Million) and Market Share (%) by Type (2023-2030)
10.1.1 Global Document Imaging Software Revenue (USD Million), and Market Share (%) by Type (2023-2030)
10.2 Global Document Imaging Software Revenue (USD Million) and Market Share (%) by Applications (2023-2030)
10.2.1 Global Document Imaging Software Revenue (USD Million), and Market Share (%) by Applications (2023-2030)
11 Global Document Imaging Software Development Regional Status and Outlook Forecast
11.1 Global Document Imaging Software Revenue (USD Million) By Regions (2023-2030)
11.2 North America Document Imaging Software Revenue (USD Million) by Type, and Applications (2023-2030)
11.2.1 North America Document Imaging Software Revenue (USD) Million by Country (2023-2030)
11.2.2 North America Document Imaging Software Revenue (USD Million), by Type (2023-2030)
11.2.3 North America Document Imaging Software Revenue (USD Million), Market Share (%) by Applications (2023-2030)
11.3 Europe Document Imaging Software Revenue (USD Million), by Type, and Applications (2023-2030)
11.3.1 Europe Document Imaging Software Revenue (USD Million), by Country (2023-2030)
11.3.2 Europe Document Imaging Software Revenue (USD Million), by Type (2023-2030)
11.3.3 Europe Document Imaging Software Revenue (USD Million), by Applications (2023-2030)
11.4 Asia Pacific Document Imaging Software Revenue (USD Million) by Type, and Applications (2023-2030)
11.4.1 Asia Pacific Document Imaging Software Revenue (USD Million), by Country (2023-2030)
11.4.2 Asia Pacific Document Imaging Software Revenue (USD Million), by Type (2023-2030)
11.4.3 Asia Pacific Document Imaging Software Revenue (USD Million), by Applications (2023-2030)
11.5 South America Document Imaging Software Revenue (USD Million), by Type, and Applications (2023-2030)
11.5.1 South America Document Imaging Software Revenue (USD Million), by Country (2023-2030)
11.5.2 South America Document Imaging Software Revenue (USD Million), by Type (2023-2030)
11.5.3 South America Document Imaging Software Revenue (USD Million), by Applications (2023-2030)
11.6 Middle East and Africa Document Imaging Software Revenue (USD Million), by Type, and Applications (2023-2030)
11.6.1 Middle East and Africa Document Imaging Software Revenue (USD Million), by region (2023-2030)
11.6.2 Middle East and Africa Document Imaging Software Revenue (USD Million), by Type (2023-2030)
11.6.3 Middle East and Africa Document Imaging Software Revenue (USD Million), by Applications (2023-2030)
12 Methodology and Data Sources
12.1 Methodology/Research Approach
12.1.1 Research Programs/Design
12.1.2 Market Size Estimation
12.1.3 Market Breakdown and Data Triangulation
12.2 Data Sources
12.2.1 Secondary Sources
12.2.2 Primary Sources
12.3 Disclaimer
List of Tables
Table 1 Market Segmentation Analysis
Table 2 Global Document Imaging Software Market Companies with Areas Served
Table 3 Products Offerings Global Document Imaging Software Market
Table 4 Low Growth Scenario Forecasts
Table 5 Reference Case Growth Scenario
Table 6 High Growth Case Scenario
Table 7 Global Document Imaging Software Revenue (USD Million) And CAGR (%) By Type (2018-2030)
Table 8 Global Document Imaging Software Revenue (USD Million) And CAGR (%) By Applications (2018-2030)
Table 9 Global Document Imaging Software Revenue (USD Million) And CAGR (%) By Regions (2018-2030)
Table 10 Global Document Imaging Software Revenue (USD Million) By Type (2018-2022)
Table 11 Global Document Imaging Software Revenue Market Share (%) By Type (2018-2022)
Table 12 Global Document Imaging Software Revenue (USD Million) By Applications (2018-2022)
Table 13 Global Document Imaging Software Revenue Market Share (%) By Applications (2018-2022)
Table 14 Global Document Imaging Software Market Revenue (USD Million) By Regions (2018-2022)
Table 15 Global Document Imaging Software Market Share (%) By Regions (2018-2022)
Table 16 North America Document Imaging Software Revenue (USD Million) By Country (2018-2022)
Table 17 North America Document Imaging Software Revenue (USD Million) By Type (2018-2022)
Table 18 North America Document Imaging Software Revenue (USD Million) By Applications (2018-2022)
Table 19 Europe Document Imaging Software Revenue (USD Million) By Country (2018-2022)
Table 20 Europe Document Imaging Software Revenue (USD Million) By Type (2018-2022)
Table 21 Europe Document Imaging Software Revenue (USD Million) By Applications (2018-2022)
Table 22 Asia Pacific Document Imaging Software Revenue (USD Million) By Country (2018-2022)
Table 23 Asia Pacific Document Imaging Software Revenue (USD Million) By Type (2018-2022)
Table 24 Asia Pacific Document Imaging Software Revenue (USD Million) By Applications (2018-2022)
Table 25 South America Document Imaging Software Revenue (USD Million) By Country (2018-2022)
Table 26 South America Document Imaging Software Revenue (USD Million) By Type (2018-2022)
Table 27 South America Document Imaging Software Revenue (USD Million) By Applications (2018-2022)
Table 28 Middle East and Africa Document Imaging Software Revenue (USD Million) By Region (2018-2022)
Table 29 Middle East and Africa Document Imaging Software Revenue (USD Million) By Type (2018-2022)
Table 30 Middle East and Africa Document Imaging Software Revenue (USD Million) By Applications (2018-2022)
Table 31 Financial Analysis
Table 32 Global Document Imaging Software Revenue (USD Million) By Type (2023-2030)
Table 33 Global Document Imaging Software Revenue Market Share (%) By Type (2023-2030)
Table 34 Global Document Imaging Software Revenue (USD Million) By Applications (2023-2030)
Table 35 Global Document Imaging Software Revenue Market Share (%) By Applications (2023-2030)
Table 36 Global Document Imaging Software Market Revenue (USD Million), And Revenue (USD Million) By Regions (2023-2030)
Table 37 North America Document Imaging Software Revenue (USD)By Country (2023-2030)
Table 38 North America Document Imaging Software Revenue (USD Million) By Type (2023-2030)
Table 39 North America Document Imaging Software Revenue (USD Million) By Applications (2023-2030)
Table 40 Europe Document Imaging Software Revenue (USD Million) By Country (2023-2030)
Table 41 Europe Document Imaging Software Revenue (USD Million) By Type (2023-2030)
Table 42 Europe Document Imaging Software Revenue (USD Million) By Applications (2023-2030)
Table 43 Asia Pacific Document Imaging Software Revenue (USD Million) By Country (2023-2030)
Table 44 Asia Pacific Document Imaging Software Revenue (USD Million) By Type (2023-2030)
Table 45 Asia Pacific Document Imaging Software Revenue (USD Million) By Applications (2023-2030)
Table 46 South America Document Imaging Software Revenue (USD Million) By Country (2023-2030)
Table 47 South America Document Imaging Software Revenue (USD Million) By Type (2023-2030)
Table 48 South America Document Imaging Software Revenue (USD Million) By Applications (2023-2030)
Table 49 Middle East and Africa Document Imaging Software Revenue (USD Million) By Region (2023-2030)
Table 50 Middle East and Africa Document Imaging Software Revenue (USD Million) By Region (2023-2030)
Table 51 Middle East and Africa Document Imaging Software Revenue (USD Million) By Type (2023-2030)
Table 52 Middle East and Africa Document Imaging Software Revenue (USD Million) By Applications (2023-2030)
Table 53 Research Programs/Design for This Report
Table 54 Key Data Information from Secondary Sources
Table 55 Key Data Information from Primary Sources
List of Figures
Figure 1 Market Scope
Figure 2 Porter’s Five Forces
Figure 3 Global Document Imaging Software Revenue (USD Million) By Type (2018-2022)
Figure 4 Global Document Imaging Software Revenue Market Share (%) By Type (2022)
Figure 5 Global Document Imaging Software Revenue (USD Million) By Applications (2018-2022)
Figure 6 Global Document Imaging Software Revenue Market Share (%) By Applications (2022)
Figure 7 Global Document Imaging Software Market Revenue (USD Million) By Regions (2018-2022)
Figure 8 Global Document Imaging Software Market Share (%) By Regions (2022)
Figure 9 North America Document Imaging Software Revenue (USD Million) By Country (2018-2022)
Figure 10 North America Document Imaging Software Revenue (USD Million) By Type (2018-2022)
Figure 11 North America Document Imaging Software Revenue (USD Million) By Applications (2018-2022)
Figure 12 Europe Document Imaging Software Revenue (USD Million) By Country (2018-2022)
Figure 13 Europe Document Imaging Software Revenue (USD Million) By Type (2018-2022)
Figure 14 Europe Document Imaging Software Revenue (USD Million) By Applications (2018-2022)
Figure 15 Asia Pacific Document Imaging Software Revenue (USD Million) By Country (2018-2022)
Figure 16 Asia Pacific Document Imaging Software Revenue (USD Million) By Type (2018-2022)
Figure 17 Asia Pacific Document Imaging Software Revenue (USD Million) By Applications (2018-2022)
Figure 18 South America Document Imaging Software Revenue (USD Million) By Country (2018-2022)
Figure 19 South America Document Imaging Software Revenue (USD Million) By Type (2018-2022)
Figure 20 South America Document Imaging Software Revenue (USD Million) By Applications (2018-2022)
Figure 21 Middle East and Africa Document Imaging Software Revenue (USD Million) By Region (2018-2022)
Figure 22 Middle East and Africa Document Imaging Software Revenue (USD Million) By Type (2018-2022)
Figure 23 Middle East and Africa Document Imaging Software Revenue (USD Million) By Applications (2018-2022)
Figure 24 Global Document Imaging Software Revenue (USD Million) By Type (2023-2030)
Figure 25 Global Document Imaging Software Revenue Market Share (%) By Type (2030)
Figure 26 Global Document Imaging Software Revenue (USD Million) By Applications (2023-2030)
Figure 27 Global Document Imaging Software Revenue Market Share (%) By Applications (2030)
Figure 28 Global Document Imaging Software Market Revenue (USD Million) By Regions (2023-2030)
Figure 29 North America Document Imaging Software Revenue (USD Million) By Country (2023-2030)
Figure 30 North America Document Imaging Software Revenue (USD Million) By Type (2023-2030)
Figure 31 North America Document Imaging Software Revenue (USD Million) By Applications (2023-2030)
Figure 32 Europe Document Imaging Software Revenue (USD Million) By Country (2023-2030)
Figure 33 Europe Document Imaging Software Revenue (USD Million) By Type (2023-2030)
Figure 34 Europe Document Imaging Software Revenue (USD Million) By Applications (2023-2030)
Figure 35 Asia Pacific Document Imaging Software Revenue (USD Million) By Country (2023-2030)
Figure 36 Asia Pacific Document Imaging Software Revenue (USD Million) By Type (2023-2030)
Figure 37 Asia Pacific Document Imaging Software Revenue (USD Million) By Applications (2023-2030)
Figure 38 South America Document Imaging Software Revenue (USD Million) By Country (2023-2030)
Figure 39 South America Document Imaging Software Revenue (USD Million) By Type (2023-2030)
Figure 40 South America Document Imaging Software Revenue (USD Million) By Applications (2023-2030)
Figure 41 Middle East and Africa Document Imaging Software Revenue (USD Million) By Region (2023-2030)
Figure 42 Middle East and Africa Document Imaging Software Revenue (USD Million) By Region (2023-2030)
Figure 43 Middle East and Africa Document Imaging Software Revenue (USD Million) By Type (2023-2030)
Figure 44 Middle East and Africa Document Imaging Software Revenue (USD Million) By Applications (2023-2030)
Figure 45 Bottom-Up and Top-Down Approaches for This Report
Figure 46 Data Triangulation
