Market Overview: Energy Efficiency and Smart Technologies Driving Market Growth
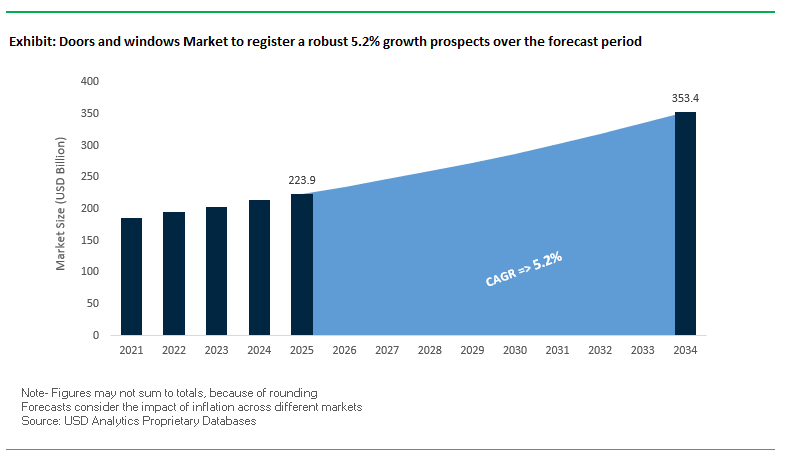
The Global Doors and Windows Market is projected to expand from USD 223.9 billion in 2025 to USD 353.3 billion by 2034, growing at a CAGR of 5.2%. As a fundamental pillar of the construction sector, this market is undergoing a transformation shaped by energy-efficient designs, premium aesthetics, and the integration of smart technologies. Increasingly stringent building codes, rising renovation activities, and a global shift toward sustainable housing solutions are positioning doors and windows as critical contributors to modern building performance.
The premiumization trend is evident with sliding doors and steel-look windows gaining traction for their modern aesthetic and functionality. Thermal performance improvements, measured by lower U-values, have become essential in both new builds and retrofits, making energy-efficient doors and windows a strong competitive differentiator. Additionally, renovation projects now account for a significant share of global demand, as homeowners invest in products that improve security, insulation, and visual appeal.
Smart home integration is also reshaping the industry, with sensors, smart locks, and automated shading systems embedded into products for greater convenience and home automation compatibility.
Key Insights for Industry Professionals:
- Renovation & repair projects drive replacement demand in mature markets.
- Sliding doors and steel-look frames dominate premium consumer preference.
- Thermal performance and energy efficiency are key differentiators in residential adoption.
- Smart windows and connected locks are rising as part of home automation trends.
- uPVC doors/windows now account for ~35% of global share, driven by durability and affordability.
Market Analysis: Recent Developments in the Global Doors and Windows Industry
The Doors and Windows Market is experiencing a series of strategic developments, acquisitions, and technology launches in 2025, underscoring the focus on energy efficiency, sustainability, and innovation.
In September 2025, LIXIL Group Corporation introduced a hybrid-frame high-performance window series targeting the Japanese residential market, a direct response to the country’s energy-efficiency goals. In August 2025, a market report revealed that uPVC has reached 35% global share in the doors segment, reflecting its rising dominance due to affordability and low maintenance. That same month, Andersen Global expanded its consulting unit with Endeavor Management, broadening its strategy expertise for housing solutions.
In July 2025, JELD-WEN published its 2024 Sustainability Report, highlighting ESG advancements and expanded Cradle to Cradle® certification for its products. Also in July, the LIXIL–GROHE all-stock merger was finalized, creating a new global leader with a diverse housing and water solutions portfolio.
Strategic M&A continues to reshape the market. In May 2025, Owens Corning acquired Masonite International in a USD 3.9 billion deal, strengthening its building materials leadership. Earlier in April 2025, Pella Corporation received industry recognition for its Easy-Slide Operator hardware, an ergonomic innovation that enhances accessibility. Masonite, in February 2025, also introduced its Performance Door System with M-Protect Multipoint Security Lock, emphasizing security-focused innovation.
Additionally, market demand is shifting toward specialized solutions. A June 2025 report on the UK housing sector revealed that 30% of institutional projects now require certified fire doors, reflecting the growing focus on safety compliance.
Emerging Trends and Opportunities in the Doors and Windows Market
Strategic Integration of Energy Performance as a Core Product Feature
Energy efficiency has shifted from being a secondary consideration to becoming the primary differentiator in the doors and windows market. With building codes tightening globally and governments offering generous incentive programs, energy performance is now a mandatory design criterion. In Canada, the Greener Homes Initiative provides grants of up to $5,000 for homeowners upgrading to ENERGY STAR-certified windows and sliding glass doors. In the U.S., the Inflation Reduction Act provides tax credits of up to $1,200 annually for energy-efficient improvements, with windows and exterior doors included as key categories.
Technology is enabling this transformation. Triple-pane glazing systems, combined with low-emissivity (low-E) coatings and thermally broken frames, dramatically reduce U-factors and solar heat gain coefficients (SHGCs). These products are increasingly being mandated under building codes such as California’s Energy Code and India’s Energy Conservation Building Code (ECBC). For manufacturers, the integration of such high-performance solutions creates a strong growth pathway: consumers are willing to pay a premium for products that deliver lifetime energy savings while qualifying for rebates and certifications like ENERGY STAR.
Adoption of Factory-Integrated Smart Glass and Dynamic Glazing
The second major trend is the shift toward smart, factory-integrated glass systems that provide active control of light, heat, and privacy. Electrochromic and thermochromic glazing technologies allow glass to tint automatically in response to light or user input, reducing the need for external shading devices and lowering HVAC loads. This creates a dual benefit: lower energy consumption and enhanced occupant comfort.
Global leaders such as Saint-Gobain and AGC Inc. are pioneering these systems in both residential and commercial segments, while Gentex Corporation is leveraging its automotive smart glass expertise to enter the building sector. Smart glass windows are no longer add-ons but central components of integrated building management systems (BMS). The rise of on-demand tinting and solar energy-harvesting glazing is also opening new revenue streams, making smart glass a core driver of differentiation for architects and builders. The result is a more interconnected value chain where material science, electronics, and IoT converge within fenestration systems.
Development of High-Performance, Low-Carbon Material Alternatives
With embodied carbon reduction emerging as a top priority in green building certifications such as LEED and BREEAM, manufacturers are focusing on bio-based composites and recycled-content framing materials. Traditional aluminum and PVC frames are energy-intensive to produce, creating demand for alternatives that maintain durability and thermal performance while lowering carbon footprints.
Research highlights bio-composites—made from agricultural fibers bonded with polymer matrices—as promising candidates for window and door frames. Simultaneously, manufacturers of uPVC and aluminum are marketing the recyclability of their products, with some plants already reusing 100% of their in-house scrap. By offering low-carbon fenestration systems, suppliers can directly appeal to environmentally conscious builders and help developers secure credits in sustainable construction projects. This creates a premium growth avenue for manufacturers who can balance performance with sustainability.
Expansion of Integrated Passive House (Passivhaus) Certified Systems
The rapid adoption of Passive House standards represents one of the most lucrative opportunities in the global doors and windows market. Passive House-certified products must achieve U-values below 0.8 W/(m²K) while delivering exceptional airtightness and installation integrity. This requires the integration of triple-pane glazing, multi-layer low-E coatings, and precision-engineered seals.
Companies specializing in Passive House systems are now expanding into full certified product lines, including doors, windows, and installation kits. R&D efforts are focusing on system-level solutions, ensuring that the frame, glazing, and installation materials perform in harmony to achieve airtightness and superior thermal insulation. For manufacturers, the Passive House niche commands premium pricing and appeals to a growing market of eco-conscious consumers and developers seeking ultra-low energy buildings. With adoption accelerating across Europe, North America, and parts of Asia, the expansion into Passive House-certified fenestration represents a high-growth pathway for innovative suppliers.
Competitive Landscape: Leading Companies in the Doors and Windows Market
The Global Doors and Windows Industry is led by multinational corporations leveraging acquisitions, product innovation, and sustainability strategies to strengthen their market dominance.
Masonite International enhances innovation under Owens Corning
Following its USD 3.9B acquisition by Owens Corning (May 2025), Masonite International has expanded its global leadership in door manufacturing. Its Performance Door System with M-Protect Multipoint Security Lock highlights a shift toward durable and secure products. With a broad portfolio spanning fiberglass, wood, and architectural doors, Masonite is strategically positioned to deliver design-rich and high-performance solutions for both residential and commercial segments.
Pella Corporation focuses on premium window and door innovations
Pella Corporation remains a top innovator, known for its Easy-Slide Operator hardware (April 2025) and Hidden Screen technology, which enhances functionality and aesthetics. With a portfolio that includes wood, fiberglass, and vinyl windows and doors, Pella continues to prioritize energy efficiency and user experience. Its focus on modern architectural trends ensures strong adoption in residential new construction and replacement projects.
Andersen Corporation strengthens sustainability and community-driven expansion
Andersen Corporation, with brands like Renewal by Andersen, emphasizes sustainability and inclusivity in its operations. In 2024, it invested USD 786M with U.S. small businesses, strengthening its supplier network. The new Renewal by Andersen site in Georgia expands its U.S. footprint. Known for high-performance windows and doors, Andersen is strategically advancing smart home compatibility and renewable material integration.
JELD-WEN Holding optimizes operations and sustainability goals
JELD-WEN continues its global presence with a focus on cost optimization and ESG performance. Its 2024 Sustainability Report (July 2025) reaffirmed its commitment to circular design, while product certifications under Cradle to Cradle® are expanding. Offering vinyl, wood, and aluminum doors and windows, JELD-WEN is advancing its “People, Performance, Strategy” initiative with investments in automation and streamlined manufacturing.
LIXIL Group Corporation drives hybrid and energy-efficient window systems
LIXIL is a global leader in housing products, with brands such as TOSTEM. Its hybrid-frame high-performance windows (September 2025) reflect a commitment to energy efficiency in Japan and beyond. With the LIXIL–GROHE merger (July 2025), the company expanded its product reach across water and housing solutions. By prioritizing decarbonization, insulation performance, and sustainable living, LIXIL remains at the forefront of innovation in Asia and global markets.
Doors and windows Market Share Insights
Windows Command Market Share Leadership by Product Type in Doors and Windows
Windows hold 60% of the doors and windows industry, a share supported by both higher unit counts per building and greater average value compared to doors. Modern architectural trends emphasize larger glass façades, natural lighting, and energy efficiency, driving demand for double and triple glazing, low-E coatings, and advanced insulating systems. Windows also carry a higher technological premium, with innovations such as smart glass, gas-filled cavities, and laminated glazing for safety and acoustic performance contributing significantly to market value. Their market leadership reflects not only functional necessity but also their role as performance-critical components in energy codes, green building certifications, and consumer-driven renovation cycles.
Residential Sector Dominates Market Share by Application in Doors and Windows
The residential sector accounts for 75% of global demand, making it the overwhelming driver of the doors and windows market. Its dominance is underpinned by the sheer volume of single-family and multi-family housing units worldwide and the constant cycle of renovations and replacements. Homeowners are increasingly investing in energy-efficient window upgrades to lower heating and cooling costs, supported by regulatory incentives and green building standards. Additionally, rising urbanization in Asia-Pacific and home renovation trends in North America and Europe are fueling continued replacement cycles. While commercial and industrial applications are significant, residential demand defines the scale, innovation trajectory, and regional growth outlook of the industry, making it the cornerstone of global market share.
United States Doors and Windows Market Fueled by Energy Efficiency and Smart Home Integration
The United States doors and windows market is strongly influenced by federal and state-level building codes, with the Department of Energy's updated energy efficiency standards driving demand for high-performance solutions. There is a growing emphasis on insulated glass units (IGUs) with low-emissivity (Low-E) coatings and smart windows that integrate with home automation systems, catering to both energy-conscious and tech-savvy consumers.
Corporate investments are accelerating product innovation and manufacturing capabilities. In February 2024, Pella Corporation launched the “Steady Set Interior Installation System” at the International Builders Show, recognized for its efficiency and ease of installation. Key applications include residential renovations, new housing projects, and commercial construction, where high-performance windows and doors are critical for fire safety, security, and sustainability. The industry is also prioritizing green building solutions, using recycled aluminum and vinyl materials, and developing products that contribute to LEED certification. Trade tariffs on imported aluminum and steel have further encouraged the adoption of alternative materials and domestic production.
Germany Doors and Windows Market Leading Through Energy Efficiency and Circular Economy Practices
Germany’s doors and windows market operates under the EU Energy Performance of Buildings Directive (EPBD), which mandates enhanced energy efficiency in buildings. This regulatory push drives demand for high-quality, insulated systems and encourages the use of recycled and sustainable materials, with uPVC profiles gaining prominence. Companies like Profine Group are investing in advanced production to meet consumer expectations for durable and energy-efficient products.
Technological advancements are reshaping production processes, with digital product passports and watermarks improving material transparency and recycling. Residential and commercial construction sectors are key applications, with premium consumers seeking aesthetics and advanced features. Germany’s “Plattform Industrie 4.0” initiative supports digitalization and automation, integrating IoT and cyber-physical systems to improve productivity and efficiency. The market is also pioneering circular economy practices, with strong adoption of recycled materials and sustainable design across doors and window systems.
China Doors and Windows Market Expands Through Green Policies and Modernized Manufacturing
China’s doors and windows market is driven by governmental initiatives aligned with the “dual carbon” goal, promoting energy-efficient building materials and sustainable manufacturing. The 2024 Action Plan for Promoting Large-Scale Equipment Updates encourages recycling and the adoption of eco-friendly technologies, creating a robust domestic market for high-quality windows and doors.
Technological advancements, including automation, AI integration, and “5G plus industrial internet,” are enhancing production efficiency and flexibility. Companies such as Mannlee are investing in modern production facilities to meet growing global and domestic demand. Urbanization and rising disposable incomes are accelerating residential and commercial construction, increasing the need for energy-saving and high-performance doors and windows. Domestic manufacturing is also expanding as local companies focus on replacing imported technologies with high-quality, circular products.
India Doors and Windows Market Strengthened by Smart City Initiatives and Local Manufacturing
India’s doors and windows industry benefits from government programs such as “Housing for All” and the development of smart cities, which drive demand for modern, high-performance fenestration solutions. The “Make in India” initiative supports local manufacturing and technological development, boosting domestic capacity and creating employment opportunities.
Corporate investments are increasing, with companies like Shakti Hörmann launching full-scale production in Jaipur in April 2024 for engineered wooden doors. Technological advancements include the adoption of automated systems for UPVC and wooden doors that withstand India’s diverse climate. Residential and commercial construction growth, especially multi-story and mixed-use buildings, fuels demand for soundproof, heat-resistant, and aesthetically appealing doors and windows. Regulatory encouragement toward circular economy practices is creating opportunities for sustainable and innovative building solutions.
Brazil Doors and Windows Market Driven by Regulatory Standards and Sustainable Construction
Brazil’s doors and windows market is strongly influenced by ABNT and INMETRO certifications, which ensure fire safety and quality standards are met. These regulations have encouraged manufacturers to develop compliant, high-performance products that meet local and international standards.
Technological advancements, including robotics and AI, are transforming the manufacturing process, allowing for smarter, automated production of doors and windows. Corporate investments, such as Wheaton’s interactive design facility in São Paulo, are being leveraged to develop innovative solutions that align with sustainability goals. Key applications include residential and commercial new construction and renovation, with a rising focus on energy-efficient and fire-resistant doors. The market is experiencing growth due to a broader adoption of green construction practices and sustainable materials, aligning with global trends in eco-friendly building solutions.
Doors and windows Market Report Scope
Doors and windows Market
|
Parameter
|
Details
|
|
Market Size (2025)
|
$223.9 Billion
|
|
Market Size (2034)
|
$353.3 Billion
|
|
Market Growth Rate
|
5.2%
|
|
Segments
|
By Material Type (Wood, Metal, uPVC, Fiberglass), By Product Type (Doors, Windows), By Application (Residential, Commercial, Industrial), By End-User (New Construction, Replacement/Renovation)
|
|
Study Period
|
2019- 2024 and 2025-2034
|
|
Units
|
Revenue (USD)
|
|
Qualitative Analysis
|
Porter’s Five Forces, SWOT Profile, Market Share, Scenario Forecasts, Market Ecosystem, Company Ranking, Market Dynamics, Industry Benchmarking
|
|
Companies
|
ASSA ABLOY AB, LIXIL Group Corporation, JELD-WEN, Inc., Pella Corporation, Andersen Corporation, Masonite International Corporation, YKK AP Inc., Milgard Manufacturing LLC, VELUX A/S, Reynaers Aluminium, Schüco International KG, Dormakaba Holding AG, Allegion plc, Atrium Windows & Doors, Cornerstone Building Brands, Inc.
|
|
Countries
|
US, Canada, Mexico, Germany, France, Spain, Italy, UK, Russia, China, India, Japan, South Korea, Australia, South East Asia, Brazil, Argentina, Middle East, Africa
|
Doors and windows Market Segmentation
By Material Type
- Wood
- Metal
- uPVC
- Fiberglass
By Product Type
By Application
- Residential
- Commercial
- Industrial
By End-User
- New Construction
- Replacement/Renovation
Countries Analyzed
- North America (US, Canada, Mexico)
- Europe (Germany, UK, France, Spain, Italy, Russia, Rest of Europe)
- Asia Pacific (China, India, Japan, South Korea, Australia, South East Asia, Rest of Asia)
- South America (Brazil, Argentina, Rest of South America)
- Middle East and Africa (Saudi Arabia, UAE, Rest of Middle East, South Africa, Egypt, Rest of Africa)
Top Companies in Doors and windows Market
- ASSA ABLOY AB
- LIXIL Group Corporation
- JELD-WEN, Inc.
- Pella Corporation
- Andersen Corporation
- Masonite International Corporation
- YKK AP Inc.
- Milgard Manufacturing LLC
- VELUX A/S
- Reynaers Aluminium
- Schüco International KG
- Dormakaba Holding AG
- Allegion plc
- Atrium Windows & Doors
- Cornerstone Building Brands, Inc.
* List Not Exhaustive
Methodology
USDAnalytics applied a comprehensive research methodology to develop an in-depth outlook on the Global Doors and Windows Market, combining both primary and secondary sources to deliver actionable insights for industry professionals. Primary research involved structured interviews with manufacturers, smart home technology integrators, construction developers, and sustainability consultants to understand demand drivers, product adoption trends, and regulatory impacts. Secondary research included analysis of company reports, press releases, government regulations, industry journals, patents, and trade publications to validate market size, growth rates, and competitive dynamics. Quantitative projections were developed for market value, CAGR, and segmentation by material type, product type, application, and end-user, while qualitative insights focused on energy-efficient solutions, smart glass integration, low-carbon materials, and Passive House-certified systems. USDAnalytics also examined regional trends across the U.S., Germany, China, India, and Brazil, incorporating policy frameworks, incentive programs, and technological advancements in manufacturing automation and digital building solutions. This holistic methodology ensures an accurate, data-driven perspective to guide strategic, operational, and investment decisions in the doors and windows sector.
Deliverables:
- Comprehensive Market Research Report (PDF and Excel) with detailed tables, charts, and interactive visualizations.
- Country-Specific Forecasts & Analysis.
- Segment-Wise Revenue Forecasts (2025–2034).
- Competitive Analysis, Benchmarking, and SWOT Profiles.
- Recent Developments & Innovation Tracker.
- Executive Summary & Analyst Commentary.
- Post-Purchase Analyst Support for Client-Specific Questions and Custom Data Requirements.
