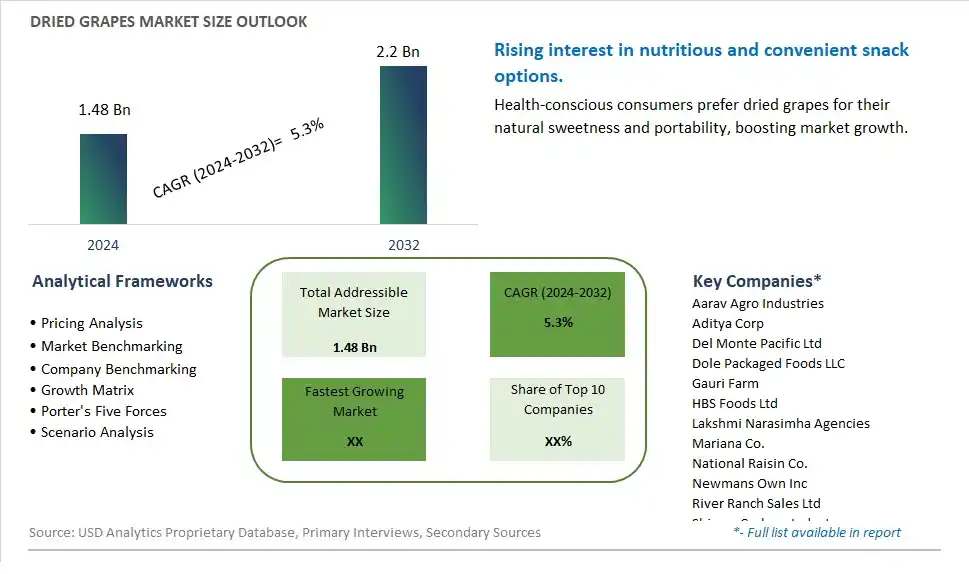
Global Dried Grapes Market Size is valued at $1.48 Billion in 2024 and is forecast to register a growth rate (CAGR) of 5.3% to reach $2.2 Billion by 2032.
The global Dried Grapes Market Comprehensive Study analyzes and forecasts the market size across 6 regions and 24 countries for diverse segments -By Packaging (Bagged, Canned), By Type (Raisins, Sultanas, Currants)
An Introduction to Dried Grapes Market
The dried grapes market is experiencing steady growth in 2024, driven by the increasing demand for convenient and nutritious snacking options, the rising popularity of plant-based diets, and the expanding applications across various industries. Dried grapes, also known as raisins, sultanas, or currants, are prized for their natural sweetness, long shelf life, and rich nutritional profile, containing essential vitamins, minerals, and antioxidants. With consumers prioritizing health and wellness, dried grapes are gaining traction as a wholesome and portable snack, suitable for all age groups. Moreover, the food and beverage industry is incorporating dried grapes into a wide array of products, including breakfast cereals, trail mixes, baked goods, and confectionery items, enhancing flavor, texture, and nutritional value. Additionally, the cosmetic and pharmaceutical sectors are harnessing the antioxidant properties of dried grapes for skincare formulations and dietary supplements, further driving market growth.
Dried Grapes Competitive Landscape
The market report analyses the leading companies in the industry including Aarav Agro Industries, Aditya Corp, Del Monte Pacific Ltd, Dole Packaged Foods LLC, Gauri Farm, HBS Foods Ltd, Lakshmi Narasimha Agencies, Mariana Co., National Raisin Co., Newmans Own Inc, River Ranch Sales Ltd, Shivam Cashew Industry, Sun Maid Growers of California, SUN VALLEY RAISINS, Sunbeam Foods, Tabletop Grapes, Traina Dried Fruit Inc, TRV Cashews, UAB Arimex, Vishaka Raisins VeravalOnline Pvt. Ltd, and Others.
Dried Grapes Market Dynamics
Dried Grapes Market Trend: Rising Demand for Healthy and Convenient Snacking Options
One prominent trend in the dried grapes market is the rising demand for healthy and convenient snacking options. As consumers prioritize health and wellness in their dietary choices, there's a growing interest in nutritious snacks that offer both taste and convenience. Dried grapes, also known as raisins, are a popular choice among consumers seeking natural sweetness and a satisfying snack option. With their portability, long shelf life, and nutritional benefits such as fiber, vitamins, and antioxidants, dried grapes are positioned as a convenient and guilt-free snack for on-the-go consumption, driving their popularity in the snacking market.
Market Driver: Increased Adoption in Food Processing and Culinary Applications
A key driver in the dried grapes market is the increased adoption of dried grapes in food processing and culinary applications. Beyond snacking, dried grapes are widely used as versatile ingredients in various food and beverage products, including baked goods, breakfast cereals, trail mixes, salads, and desserts. The natural sweetness and chewy texture of dried grapes make them a desirable addition to a wide range of recipes, enhancing flavor profiles and adding nutritional value. This driver fuels market growth as food manufacturers and chefs incorporate dried grapes into innovative formulations to create flavorful and appealing dishes, catering to consumer demand for natural and wholesome ingredients in packaged foods and culinary creations.
Market Opportunity: Expansion into Health and Wellness Products and Functional Foods
An emerging opportunity in the dried grapes market is the expansion into health and wellness products and functional foods. Beyond their use as snacks and ingredients in traditional food products, dried grapes offer potential opportunities in the health and wellness segment, where there's a growing demand for functional ingredients that offer nutritional benefits and support overall well-being. Dried grapes are naturally rich in fiber, antioxidants, and phytonutrients, making them suitable for incorporation into a wide range of functional foods such as granola bars, yogurt toppings, energy bites, and smoothie mixes. Additionally, dried grapes can be used in dietary supplements, wellness shots, and meal replacements, offering potential benefits for digestive health, immune support, and antioxidant protection. By exploring new product categories and targeting health-conscious consumers, dried grapes manufacturers can diversify their product portfolios and tap into the expanding market for functional and health-enhancing foods.
Dried Grapes Market Share Analysis: Bagged held the dominant market share in 2024
In the Dried Grapes Market segmented by packaging, bagged dried grapes emerge as the largest segment, commanding a significant share of the market. This dominance can be attributed to several key factors. Firstly, bagged packaging offers convenience and versatility, allowing consumers to easily portion and store dried grapes for snacking or cooking purposes. Additionally, the resealable nature of bagged packaging helps maintain the freshness and quality of the dried grapes over time, appealing to consumers seeking longer shelf life. Further, the availability of a diverse range of bagged dried grape varieties, including seedless, organic, and flavored options, caters to diverse consumer preferences and dietary needs. Furthermore, the widespread availability of bagged dried grapes in retail outlets, supermarkets, and specialty stores ensures easy accessibility and consumer trust. As a result, the bagged segment maintains its position as the largest in the dried grapes market, poised for continued growth driven by its convenience and widespread consumer appeal.
Dried Grapes Market Share Analysis: Sultanas market is poised to register the fastest growth rae over the forecast period to 2032
Among the segments in the Dried Grapes Market categorized by type, sultanas emerge as the fastest-growing segment, propelled by several compelling factors. Firstly, sultanas are prized for their distinct flavor profile, which is sweeter and lighter than traditional raisins, appealing to consumers seeking a unique taste experience. Additionally, sultanas are versatile ingredients used in various culinary applications, including baking, cooking, and snacking, contributing to their growing popularity among home cooks and professional chefs alike. Further, the rising consumer interest in healthier snack options and natural sweeteners has increased demand for sultanas as nutritious alternatives to processed snacks and sugary treats. Furthermore, the growing trend of incorporating sultanas into ethnic cuisines and fusion dishes has expanded their culinary versatility and market reach. As a result, the sultanas segment stands out as the fastest-growing in the dried grapes market, poised for continued expansion driven by its distinctive flavor, versatility, and increasing consumer demand for wholesome and flavorful ingredients.
Dried Grapes Market Segmentation
By Packaging
Bagged
Canned
By Type
Raisins
Sultanas
Currants
Countries Analyzed
North America (US, Canada, Mexico)
Europe (Germany, UK, France, Spain, Italy, Russia, Rest of Europe)
Asia Pacific (China, India, Japan, South Korea, Australia, South East Asia, Rest of Asia)
South America (Brazil, Argentina, Rest of South America)
Middle East and Africa (Saudi Arabia, UAE, Rest of Middle East, South Africa, Egypt, Rest of Africa)
Dried Grapes Companies Profiled in the Study
Aarav Agro Industries
Aditya Corp
Del Monte Pacific Ltd
Dole Packaged Foods LLC
Gauri Farm
HBS Foods Ltd
Lakshmi Narasimha Agencies
Mariana Co.
National Raisin Co.
Newmans Own Inc
River Ranch Sales Ltd
Shivam Cashew Industry
Sun Maid Growers of California
SUN VALLEY RAISINS
Sunbeam Foods
Tabletop Grapes
Traina Dried Fruit Inc
TRV Cashews
UAB Arimex
Vishaka Raisins VeravalOnline Pvt. Ltd
*- List Not Exhaustive
Chapter 1. TABLE OF CONTENTS
Chapter 2. Introduction to Dried Grapes Market
2.1. Market Overview
2.2. Key Statistics and Report Highlights
2.3. Scope of the Comprehensive Study
2.3.1. Market Definition
2.3.2 Countries and Regions Covered
2.3.3 Research Objective
2.3.4 Units, Currency, and Conversions
2.3.5 Industry Value Chain
2.4. Key Market Segments
2.5. Key Companies
2.6. Study Period
Chapter 3. Strategic Analysis Review
3.1. Dried Grapes Pricing Analysis and Forecast
3.2. Porter’s Five Forces
3.3. Market Ecosystem
3.4. SWOT Analysis
3.5. Regulatory Scenario
3.3. Effects of Inflation, Russia-Ukraine War, moderating economic growth, and other macroeconomic factors
Chapter 4. Competitive Landscape
4.1. Market Share Analysis
4.1.1. Global Dried Grapes Market Share by Company, 2023
4.1.2. Product Offerings of Leading Dried Grapes Companies
4.2. Market Entropy
4.2.1. New Product Launches in the Industry
4.2.2. Mergers, Acquisitions, Joint ventures, and Partnerships
4.3. Key Strategies and Best Practices
Chapter 5. Global Market Projections: Best, Reference, and Low Case Scenarios
5.1. Growth Analysis- Case Scenario Definitions
5.2. Low Growth Case Scenario Forecasts
5.3. Reference Growth Case Scenario Forecasts
5.4. High Growth Case Scenario Forecasts
Chapter 6. Market Dynamics
6.1. Dried Grapes Market Drivers
6.2. Dried Grapes Market Challenges
6.6. Dried Grapes Market Opportunities
6.4. Dried Grapes Market Trends
Chapter 7. Global Dried Grapes Market Outlook Trends
7.1. Global Dried Grapes Revenue (USD Million) and CAGR (%) by Type (2021-2032)
7.2. Global Dried Grapes Revenue (USD Million) and CAGR (%) by Application (2021-2032)
7.3. Global Dried Grapes Revenue (USD Million) and CAGR (%) by Product (2021-2032)
By Packaging
Bagged
Canned
By Type
Raisins
Sultanas
Currants
Chapter 8. Global Dried Grapes Regional Analysis and Outlook
8.1. Global Dried Grapes Revenue (USD Million) By Regions (2021- 2032)
8.2. North America Dried Grapes Revenue (USD Million) by Country (2021-2032)
8.2.1. United States Dried Grapes Regional Analysis and Outlook
8.2.2. Canada Dried Grapes Regional Analysis and Outlook
8.2.3. Mexico Dried Grapes Regional Analysis and Outlook
8.3. Europe Dried Grapes Revenue (USD Million), by Country (2021-2032)
8.3.1. Germany Dried Grapes Regional Analysis and Outlook
8.3.2. France Dried Grapes Regional Analysis and Outlook
8.3.3. United Kingdom Dried Grapes Regional Analysis and Outlook
8.3.4. Spain Dried Grapes Regional Analysis and Outlook
8.3.5. Italy Dried Grapes Regional Analysis and Outlook
8.3.6. Russia Dried Grapes Regional Analysis and Outlook
8.3.7. Rest of Europe Dried Grapes Regional Analysis and Outlook
8.4. Asia Pacific Dried Grapes Revenue (USD Million) by Country (2021-2032)
8.4.1. China Dried Grapes Regional Analysis and Outlook
8.4.2. Japan Dried Grapes Regional Analysis and Outlook
8.4.3. India Dried Grapes Regional Analysis and Outlook
8.4.4. South Korea Dried Grapes Regional Analysis and Outlook
8.4.5. Australia Dried Grapes Regional Analysis and Outlook
8.4.6. South East Asia Dried Grapes Regional Analysis and Outlook
8.4.7. Rest of Asia Pacific Dried Grapes Regional Analysis and Outlook
8.5. South America Dried Grapes Revenue (USD Million), by Country (2021-2032)
8.5.1. Brazil Dried Grapes Regional Analysis and Outlook
8.5.2. Argentina Dried Grapes Regional Analysis and Outlook
8.5.3. Rest of South America Dried Grapes Regional Analysis and Outlook
8.6. Middle East and Africa Dried Grapes Revenue (USD Million) by Country (2021-2032)
8.6.1. Middle East Dried Grapes Regional Analysis and Outlook
8.6.2. Africa Dried Grapes Regional Analysis and Outlook
Chapter 9. North America Dried Grapes Analysis and Outlook
9.1. North America Dried Grapes Revenue (USD Million) by Segments (2021-2032)
9.1.1. North America Dried Grapes Revenue (USD Million) by Type (2021-2032)
9.1.2. North America Dried Grapes Revenue (USD Million) by Application (2021-2032)
9.1.3. North America Dried Grapes Revenue (USD Million) by Product (2021-2032)
By Packaging
Bagged
Canned
By Type
Raisins
Sultanas
Currants
Chapter 10. Europe Dried Grapes Analysis and Outlook
10.1. Europe Dried Grapes Revenue (USD Million), by Segments (USD Million) (2021-2032)
10.1.1. Europe Dried Grapes Revenue (USD Million) by Type (2021-2032)
10.1.2. Europe Dried Grapes Revenue (USD Million) by Application (2021-2032)
10.1.3. Europe Dried Grapes Revenue (USD Million) by Product (2021-2032)
By Packaging
Bagged
Canned
By Type
Raisins
Sultanas
Currants
Chapter 11. Asia Pacific Dried Grapes Analysis and Outlook
11.1. Asia Pacific Dried Grapes Revenue (USD Million), and Revenue (USD Million) by Segments (2021-2032)
11.1.1. Asia Pacific Dried Grapes Revenue (USD Million) by Type (2021-2032)
11.1.2. Asia Pacific Dried Grapes Revenue (USD Million) by Application (2021-2032)
11.1.3. Asia Pacific Dried Grapes Revenue (USD Million) by Product (2021-2032)
By Packaging
Bagged
Canned
By Type
Raisins
Sultanas
Currants
Chapter 12. South America Dried Grapes Analysis and Outlook
12.1. South America Dried Grapes Revenue (USD Million), by Segments (2021-2032)
12.1.1. South America Dried Grapes Revenue (USD Million) by Type (2021-2032)
12.1.2. South America Dried Grapes Revenue (USD Million) by Application (2021-2032)
12.1.3. South America Dried Grapes Revenue (USD Million) by Product (2021-2032)
By Packaging
Bagged
Canned
By Type
Raisins
Sultanas
Currants
Chapter 13. Middle East and Africa Dried Grapes Analysis and Outlook
13.1. Middle East and Africa Dried Grapes Revenue (USD Million), by Segments (2021-2032)
13.1.1. Middle East and Africa Dried Grapes Revenue (USD Million) by Type (2021-2032)
13.1.2. Middle East and Africa Dried Grapes Revenue (USD Million) by Application (2021-2032)
13.1.3. Middle East and Africa Dried Grapes Revenue (USD Million) by Product (2021-2032)
By Packaging
Bagged
Canned
By Type
Raisins
Sultanas
Currants
Chapter 14. Dried Grapes Company Profiles
14.1 Business Overview
14.2 Product Profiles
14.3 SWOT Profiles
14.5 Recent Developments
14.6 Financial Profile
List of Companies
Aarav Agro Industries
Aditya Corp
Del Monte Pacific Ltd
Dole Packaged Foods LLC
Gauri Farm
HBS Foods Ltd
Lakshmi Narasimha Agencies
Mariana Co.
National Raisin Co.
Newmans Own Inc
River Ranch Sales Ltd
Shivam Cashew Industry
Sun Maid Growers of California
SUN VALLEY RAISINS
Sunbeam Foods
Tabletop Grapes
Traina Dried Fruit Inc
TRV Cashews
UAB Arimex
Vishaka Raisins VeravalOnline Pvt. Ltd
15. Methodology and Data Sources
15.1 Customization Offerings
15.2 Subscription Services
15.3 Related Reports
15.4 Publisher Expertise
LIST OF TABLES
Table 1 Market Segmentation Analysis
Table 2 Global Dried Grapes Market Share of Leading Companies, 2023
Table 3 Product Offerings of Leading Companies
Table 4 Low Growth Scenario Forecasts
Table 5 Reference Case Growth Scenario
Table 6 High Growth Case Scenario
Table 7 Global Dried Grapes Revenue (USD Million) And CAGR (%) By Type (2021-2032)
Table 8 Global Dried Grapes Revenue (USD Million) And CAGR (%) By Application (2021-2032)
Table 9 Global Dried Grapes Revenue (USD Million) And CAGR (%) By Product (2021-2032)
Table 10 Global Dried Grapes Market Revenue (USD Million) By Regions (2021-2032)
Table 11 Global Dried Grapes Market Share (%) By Regions (2021-2032)
Table 12 North America Dried Grapes Revenue (USD Million) By Country (2021-2032)
Table 13 Europe Dried Grapes Revenue (USD Million) By Country (2021-2032)
Table 14 Asia Pacific Dried Grapes Revenue (USD Million) By Country (2021-2032)
Table 15 South America Dried Grapes Revenue (USD Million) By Country (2021-2032)
Table 16 Middle East and Africa Dried Grapes Revenue (USD Million) By Region (2021-2032)
Table 17 North America Dried Grapes Revenue (USD Million) By Type (2021-2032)
Table 18 North America Dried Grapes Revenue (USD Million) By Application (2021-2032)
Table 19 North America Dried Grapes Revenue (USD Million) By Product (2021-2032)
Table 20 Europe Dried Grapes Revenue (USD Million) By Type (2021-2032)
Table 21 Europe Dried Grapes Revenue (USD Million) By Application (2021-2032)
Table 22 Europe Dried Grapes Revenue (USD Million) By Product (2021-2032)
Table 23 Asia Pacific Dried Grapes Revenue (USD Million) By Type (2021-2032)
Table 24 Asia Pacific Dried Grapes Revenue (USD Million) By Application (2021-2032)
Table 25 Asia Pacific Dried Grapes Revenue (USD Million) By Product (2021-2032)
Table 26 South America Dried Grapes Revenue (USD Million) By Type (2021-2032)
Table 27 South America Dried Grapes Revenue (USD Million) By Application (2021-2032)
Table 28 South America Dried Grapes Revenue (USD Million) By Product (2021-2032)
Table 29 Middle East and Africa Dried Grapes Revenue (USD Million) By Type (2021-2032)
Table 30 Middle East and Africa Dried Grapes Revenue (USD Million) By Application (2021-2032)
Table 31 Middle East and Africa Dried Grapes Revenue (USD Million) By Product (2021-2032)
LIST OF FIGURES
Figure 1. Market Scope
Figure 2. Pricing Forecasts Per Unit, 2023- 2032
Figure 3. Porter’s Five Forces
Figure 4. Global Dried Grapes Market Revenue (USD Million) By Regions (2021-2032)
Figure 5. Global Dried Grapes Market Share (%) By Regions (2023)
Figure 6. North America Dried Grapes Revenue (USD Million) By Country (2021-2032)
Figure 7. United States Dried Grapes Revenue (USD Million) By Country (2021-2032)
Figure 8. Canada Dried Grapes Revenue (USD Million) By Country (2021-2032)
Figure 9. Mexico Dried Grapes Revenue (USD Million) By Country (2021-2032)
Figure 10. Europe Dried Grapes Revenue (USD Million) By Country (2021-2032)
Figure 11. Germany Dried Grapes Revenue (USD Million) By Country (2021-2032)
Figure 12. France Dried Grapes Revenue (USD Million) By Country (2021-2032)
Figure 13. United Kingdom Dried Grapes Revenue (USD Million) By Country (2021-2032)
Figure 14. Spain Dried Grapes Revenue (USD Million) By Country (2021-2032)
Figure 15. Italy Dried Grapes Revenue (USD Million) By Country (2021-2032)
Figure 16. Russia Dried Grapes Revenue (USD Million) By Country (2021-2032)
Figure 17. Rest of Europe Dried Grapes Revenue (USD Million) By Country (2021-2032)
Figure 11. Asia Pacific Dried Grapes Revenue (USD Million) By Country (2021-2032)
Figure 12. China Dried Grapes Revenue (USD Million) By Country (2021-2032)
Figure 13. Japan Dried Grapes Revenue (USD Million) By Country (2021-2032)
Figure 14. India Dried Grapes Revenue (USD Million) By Country (2021-2032)
Figure 15. South Korea Dried Grapes Revenue (USD Million) By Country (2021-2032)
Figure 16. Australia Dried Grapes Revenue (USD Million) By Country (2021-2032)
Figure 17. South East Asia Dried Grapes Revenue (USD Million) By Country (2021-2032)
Figure 18. South America Dried Grapes Revenue (USD Million) By Country (2021-2032)
Figure 19. Brazil Dried Grapes Revenue (USD Million) By Country (2021-2032)
Figure 20. Argentina Dried Grapes Revenue (USD Million) By Country (2021-2032)
Figure 21. Rest of Asia Pacific Dried Grapes Revenue (USD Million) By Country (2021-2032)
Figure 22. Middle East and Africa Dried Grapes Revenue (USD Million) By Region (2021-2032)
Figure 23. Saudi Arabia Dried Grapes Revenue (USD Million) By Region (2021-2032)
Figure 24. The UAE Dried Grapes Revenue (USD Million) By Region (2021-2032)
Figure 25. Rest of Middle East Dried Grapes Revenue (USD Million) By Region (2021-2032)
Figure 26. South Africa Dried Grapes Revenue (USD Million) By Region (2021-2032)
Figure 27. Africa Dried Grapes Revenue (USD Million) By Region (2021-2032)
Figure 28. North America Dried Grapes Revenue (USD Million) By Type (2021-2032)
Figure 29. North America Dried Grapes Revenue (USD Million) By Application (2021-2032)
Figure 30. North America Dried Grapes Revenue (USD Million) By Product (2021-2032)
Figure 31. Europe Dried Grapes Revenue (USD Million) By Type (2021-2032)
Figure 32. Europe Dried Grapes Revenue (USD Million) By Application (2021-2032)
Figure 33. Europe Dried Grapes Revenue (USD Million) By Product (2021-2032)
Figure 34. Asia Pacific Dried Grapes Revenue (USD Million) By Type (2021-2032)
Figure 35. Asia Pacific Dried Grapes Revenue (USD Million) By Application (2021-2032)
Figure 36. Asia Pacific Dried Grapes Revenue (USD Million) By Product (2021-2032)
Figure 37. South America Dried Grapes Revenue (USD Million) By Type (2021-2032)
Figure 38. South America Dried Grapes Revenue (USD Million) By Application (2021-2032)
Figure 39. South America Dried Grapes Revenue (USD Million) By Product (2021-2032)
Figure 40. Middle East and Africa Dried Grapes Revenue (USD Million) By Type (2021-2032)
Figure 41. Middle East and Africa Dried Grapes Revenue (USD Million) By Application (2021-2032)
Figure 42. Middle East and Africa Dried Grapes Revenue (USD Million) By Product (2021-2032)
By Packaging
Bagged
Canned
By Type
Raisins
Sultanas
Currants
Countries Analyzed
North America (US, Canada, Mexico)
Europe (Germany, UK, France, Spain, Italy, Russia, Rest of Europe)
Asia Pacific (China, India, Japan, South Korea, Australia, South East Asia, Rest of Asia)
South America (Brazil, Argentina, Rest of South America)
Middle East and Africa (Saudi Arabia, UAE, Rest of Middle East, South Africa, Egypt, Rest of Africa)
