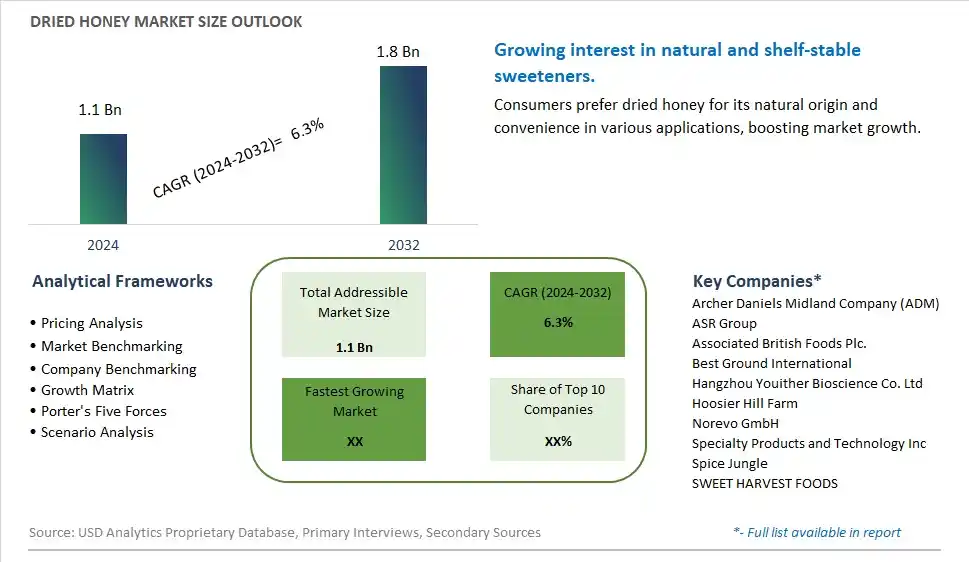
Global Dried Honey Market Size is valued at $1.1 Billion in 2024 and is forecast to register a growth rate (CAGR) of 6.3% to reach $1.8 Billion by 2032.
The global Dried Honey Market Comprehensive Study analyzes and forecasts the market size across 6 regions and 24 countries for diverse segments -By Form (Powder, Granules), By Type (Organic, Conventional), By Application (Food & Beverages, Personal Care, Pharmaceuticals, Nutraceuticals, Others)
An Introduction to Dried Honey Market
In 2024, the dried honey market is thriving, fueled by the demand for natural sweeteners that offer the flavor and benefits of honey in a convenient, non-sticky form. Dried honey, made from dehydrated liquid honey, is used in baking, beverages, and nutritional products. The market benefits from advancements in drying and encapsulation technologies that preserve the taste, aroma, and nutritional properties of honey. The trend towards clean label and natural ingredients is influencing product development. Increasing consumer interest in natural and functional sweeteners, supported by the popularity of honey-based products, is further supporting market growth.
Dried Honey Competitive Landscape
The market report analyses the leading companies in the industry including Archer Daniels Midland Company (ADM), ASR Group , Associated British Foods Plc. , Best Ground International , Hangzhou Youither Bioscience Co. Ltd , Hoosier Hill Farm , Norevo GmbH, Specialty Products and Technology Inc , Spice Jungle , SWEET HARVEST FOODS , and Others.
Dried Honey Market Dynamics
Dried Honey Market Trend: Increasing Use in Health and Wellness Products
The most prominent trend in the Dried Honey Market is the increasing use in health and wellness products. Dried honey, known for its natural sweetness and health benefits, is being incorporated into a variety of health foods, dietary supplements, and functional beverages. This trend is driven by the demand for natural and nutrient-rich ingredients that offer multiple health benefits.
Dried Honey Market Driver: Health Consciousness and Nutritional Benefits
A key driver in the Dried Honey Market is health consciousness and the recognized nutritional benefits of honey. As more individuals focus on improving their diet and avoiding synthetic additives, there is a rising demand for dried honey that provides natural sweetness and essential nutrients. This demand supports market growth as consumers seek health-enhancing food ingredients.
Dried Honey Market Opportunity: Innovation in Food and Beverage Applications
One significant opportunity in the Dried Honey Market lies in innovation in food and beverage applications. Companies can develop new products that utilize dried honey in various formulations, such as health bars, protein shakes, and gourmet snacks, offering consumers convenient and health-focused options. By highlighting the benefits and versatility of dried honey, manufacturers can attract a broader consumer base and drive market growth.
Dried Honey Market Share Analysis- Largest Segment by Form
In the Dried Honey Market, the Powder form is the largest segment. Dried honey powder is preferred for its convenience, long shelf life, and ease of use in various applications. Its fine texture allows for easy blending and incorporation into a wide range of products, including baked goods, beverages, and dietary supplements. The powder form is also favored in the food industry for its ability to provide consistent sweetness and flavor without the need for additional liquid. The versatility and practical advantages of honey powder, such as its stable storage and transport characteristics, make it the most significant form in the dried honey market.
Dried Honey Market Share Analysis- Poised to Grow Fastest Over the Next Five Years by Type
The Organic segment of the Dried Honey Market is poised to grow the fastest over the next five years. This anticipated growth is driven by the increasing consumer demand for organic and natural products. Organic dried honey, produced without synthetic pesticides or additives, aligns with the growing trend towards health-conscious and environmentally friendly choices. Consumers are increasingly seeking out organic options for their perceived health benefits and environmental sustainability. Additionally, organic dried honey is gaining traction in premium food segments and specialty products, further accelerating its growth. As awareness of organic products continues to rise, this segment is expected to expand rapidly.
Dried Honey Market Share Analysis- Largest Segment by Application
The Food & Beverages segment is the largest application area for dried honey. This prominence is due to the widespread use of dried honey as a natural sweetener and flavor enhancer in a variety of food and beverage products. Dried honey is used in baked goods, confectionery, sauces, and beverages to provide a distinct, natural sweetness and rich flavor profile. Its long shelf life and ease of handling make it a preferred ingredient in food manufacturing and processing. The versatility of dried honey in different culinary applications and its role in enhancing taste and texture contribute to its position as the largest segment in the market.
Dried Honey Market Segmentation
By Form
Powder
Granules
By Type
Organic
Conventional
By Application
Food & Beverages
Personal Care
Pharmaceuticals
Nutraceuticals
Others
Countries Analyzed
North America (US, Canada, Mexico)
Europe (Germany, UK, France, Spain, Italy, Russia, Rest of Europe)
Asia Pacific (China, India, Japan, South Korea, Australia, South East Asia, Rest of Asia)
South America (Brazil, Argentina, Rest of South America)
Middle East and Africa (Saudi Arabia, UAE, Rest of Middle East, South Africa, Egypt, Rest of Africa)
Dried Honey Companies Profiled in the Study
Archer Daniels Midland Company (ADM)
ASR Group
Associated British Foods Plc.
Best Ground International
Hangzhou Youither Bioscience Co. Ltd
Hoosier Hill Farm
Norevo GmbH
Specialty Products and Technology Inc
Spice Jungle
SWEET HARVEST FOODS
*- List Not Exhaustive
Chapter 1. TABLE OF CONTENTS
Chapter 2. Introduction to Dried Honey Market
2.1. Market Overview
2.2. Key Statistics and Report Highlights
2.3. Scope of the Comprehensive Study
2.3.1. Market Definition
2.3.2 Countries and Regions Covered
2.3.3 Research Objective
2.3.4 Units, Currency, and Conversions
2.3.5 Industry Value Chain
2.4. Key Market Segments
2.5. Key Companies
2.6. Study Period
Chapter 3. Strategic Analysis Review
3.1. Dried Honey Pricing Analysis and Forecast
3.2. Porter’s Five Forces
3.3. Market Ecosystem
3.4. SWOT Analysis
3.5. Regulatory Scenario
3.3. Effects of Inflation, Russia-Ukraine War, moderating economic growth, and other macroeconomic factors
Chapter 4. Competitive Landscape
4.1. Market Share Analysis
4.1.1. Global Dried Honey Market Share by Company, 2023
4.1.2. Product Offerings of Leading Dried Honey Companies
4.2. Market Entropy
4.2.1. New Product Launches in the Industry
4.2.2. Mergers, Acquisitions, Joint ventures, and Partnerships
4.3. Key Strategies and Best Practices
Chapter 5. Global Market Projections: Best, Reference, and Low Case Scenarios
5.1. Growth Analysis- Case Scenario Definitions
5.2. Low Growth Case Scenario Forecasts
5.3. Reference Growth Case Scenario Forecasts
5.4. High Growth Case Scenario Forecasts
Chapter 6. Market Dynamics
6.1. Dried Honey Market Drivers
6.2. Dried Honey Market Challenges
6.6. Dried Honey Market Opportunities
6.4. Dried Honey Market Trends
Chapter 7. Global Dried Honey Market Outlook Trends
7.1. Global Dried Honey Revenue (USD Million) and CAGR (%) by Type (2021-2032)
7.2. Global Dried Honey Revenue (USD Million) and CAGR (%) by Application (2021-2032)
7.3. Global Dried Honey Revenue (USD Million) and CAGR (%) by Product (2021-2032)
By Form
Powder
Granules
By Type
Organic
Conventional
By Application
Food & Beverages
Personal Care
Pharmaceuticals
Nutraceuticals
Others
Chapter 8. Global Dried Honey Regional Analysis and Outlook
8.1. Global Dried Honey Revenue (USD Million) By Regions (2021- 2032)
8.2. North America Dried Honey Revenue (USD Million) by Country (2021-2032)
8.2.1. United States Dried Honey Regional Analysis and Outlook
8.2.2. Canada Dried Honey Regional Analysis and Outlook
8.2.3. Mexico Dried Honey Regional Analysis and Outlook
8.3. Europe Dried Honey Revenue (USD Million), by Country (2021-2032)
8.3.1. Germany Dried Honey Regional Analysis and Outlook
8.3.2. France Dried Honey Regional Analysis and Outlook
8.3.3. United Kingdom Dried Honey Regional Analysis and Outlook
8.3.4. Spain Dried Honey Regional Analysis and Outlook
8.3.5. Italy Dried Honey Regional Analysis and Outlook
8.3.6. Russia Dried Honey Regional Analysis and Outlook
8.3.7. Rest of Europe Dried Honey Regional Analysis and Outlook
8.4. Asia Pacific Dried Honey Revenue (USD Million) by Country (2021-2032)
8.4.1. China Dried Honey Regional Analysis and Outlook
8.4.2. Japan Dried Honey Regional Analysis and Outlook
8.4.3. India Dried Honey Regional Analysis and Outlook
8.4.4. South Korea Dried Honey Regional Analysis and Outlook
8.4.5. Australia Dried Honey Regional Analysis and Outlook
8.4.6. South East Asia Dried Honey Regional Analysis and Outlook
8.4.7. Rest of Asia Pacific Dried Honey Regional Analysis and Outlook
8.5. South America Dried Honey Revenue (USD Million), by Country (2021-2032)
8.5.1. Brazil Dried Honey Regional Analysis and Outlook
8.5.2. Argentina Dried Honey Regional Analysis and Outlook
8.5.3. Rest of South America Dried Honey Regional Analysis and Outlook
8.6. Middle East and Africa Dried Honey Revenue (USD Million) by Country (2021-2032)
8.6.1. Middle East Dried Honey Regional Analysis and Outlook
8.6.2. Africa Dried Honey Regional Analysis and Outlook
Chapter 9. North America Dried Honey Analysis and Outlook
9.1. North America Dried Honey Revenue (USD Million) by Segments (2021-2032)
9.1.1. North America Dried Honey Revenue (USD Million) by Type (2021-2032)
9.1.2. North America Dried Honey Revenue (USD Million) by Application (2021-2032)
9.1.3. North America Dried Honey Revenue (USD Million) by Product (2021-2032)
By Form
Powder
Granules
By Type
Organic
Conventional
By Application
Food & Beverages
Personal Care
Pharmaceuticals
Nutraceuticals
Others
Chapter 10. Europe Dried Honey Analysis and Outlook
10.1. Europe Dried Honey Revenue (USD Million), by Segments (USD Million) (2021-2032)
10.1.1. Europe Dried Honey Revenue (USD Million) by Type (2021-2032)
10.1.2. Europe Dried Honey Revenue (USD Million) by Application (2021-2032)
10.1.3. Europe Dried Honey Revenue (USD Million) by Product (2021-2032)
By Form
Powder
Granules
By Type
Organic
Conventional
By Application
Food & Beverages
Personal Care
Pharmaceuticals
Nutraceuticals
Others
Chapter 11. Asia Pacific Dried Honey Analysis and Outlook
11.1. Asia Pacific Dried Honey Revenue (USD Million), and Revenue (USD Million) by Segments (2021-2032)
11.1.1. Asia Pacific Dried Honey Revenue (USD Million) by Type (2021-2032)
11.1.2. Asia Pacific Dried Honey Revenue (USD Million) by Application (2021-2032)
11.1.3. Asia Pacific Dried Honey Revenue (USD Million) by Product (2021-2032)
By Form
Powder
Granules
By Type
Organic
Conventional
By Application
Food & Beverages
Personal Care
Pharmaceuticals
Nutraceuticals
Others
Chapter 12. South America Dried Honey Analysis and Outlook
12.1. South America Dried Honey Revenue (USD Million), by Segments (2021-2032)
12.1.1. South America Dried Honey Revenue (USD Million) by Type (2021-2032)
12.1.2. South America Dried Honey Revenue (USD Million) by Application (2021-2032)
12.1.3. South America Dried Honey Revenue (USD Million) by Product (2021-2032)
By Form
Powder
Granules
By Type
Organic
Conventional
By Application
Food & Beverages
Personal Care
Pharmaceuticals
Nutraceuticals
Others
Chapter 13. Middle East and Africa Dried Honey Analysis and Outlook
13.1. Middle East and Africa Dried Honey Revenue (USD Million), by Segments (2021-2032)
13.1.1. Middle East and Africa Dried Honey Revenue (USD Million) by Type (2021-2032)
13.1.2. Middle East and Africa Dried Honey Revenue (USD Million) by Application (2021-2032)
13.1.3. Middle East and Africa Dried Honey Revenue (USD Million) by Product (2021-2032)
By Form
Powder
Granules
By Type
Organic
Conventional
By Application
Food & Beverages
Personal Care
Pharmaceuticals
Nutraceuticals
Others
Chapter 14. Dried Honey Company Profiles
14.1 Business Overview
14.2 Product Profiles
14.3 SWOT Profiles
14.5 Recent Developments
14.6 Financial Profile
List of Companies
Archer Daniels Midland Company (ADM)
ASR Group
Associated British Foods Plc.
Best Ground International
Hangzhou Youither Bioscience Co. Ltd
Hoosier Hill Farm
Norevo GmbH
Specialty Products and Technology Inc
Spice Jungle
SWEET HARVEST FOODS
15. Methodology and Data Sources
15.1 Customization Offerings
15.2 Subscription Services
15.3 Related Reports
15.4 Publisher Expertise
LIST OF TABLES
Table 1 Market Segmentation Analysis
Table 2 Global Dried Honey Market Share of Leading Companies, 2023
Table 3 Product Offerings of Leading Companies
Table 4 Low Growth Scenario Forecasts
Table 5 Reference Case Growth Scenario
Table 6 High Growth Case Scenario
Table 7 Global Dried Honey Revenue (USD Million) And CAGR (%) By Type (2021-2032)
Table 8 Global Dried Honey Revenue (USD Million) And CAGR (%) By Application (2021-2032)
Table 9 Global Dried Honey Revenue (USD Million) And CAGR (%) By Product (2021-2032)
Table 10 Global Dried Honey Market Revenue (USD Million) By Regions (2021-2032)
Table 11 Global Dried Honey Market Share (%) By Regions (2021-2032)
Table 12 North America Dried Honey Revenue (USD Million) By Country (2021-2032)
Table 13 Europe Dried Honey Revenue (USD Million) By Country (2021-2032)
Table 14 Asia Pacific Dried Honey Revenue (USD Million) By Country (2021-2032)
Table 15 South America Dried Honey Revenue (USD Million) By Country (2021-2032)
Table 16 Middle East and Africa Dried Honey Revenue (USD Million) By Region (2021-2032)
Table 17 North America Dried Honey Revenue (USD Million) By Type (2021-2032)
Table 18 North America Dried Honey Revenue (USD Million) By Application (2021-2032)
Table 19 North America Dried Honey Revenue (USD Million) By Product (2021-2032)
Table 20 Europe Dried Honey Revenue (USD Million) By Type (2021-2032)
Table 21 Europe Dried Honey Revenue (USD Million) By Application (2021-2032)
Table 22 Europe Dried Honey Revenue (USD Million) By Product (2021-2032)
Table 23 Asia Pacific Dried Honey Revenue (USD Million) By Type (2021-2032)
Table 24 Asia Pacific Dried Honey Revenue (USD Million) By Application (2021-2032)
Table 25 Asia Pacific Dried Honey Revenue (USD Million) By Product (2021-2032)
Table 26 South America Dried Honey Revenue (USD Million) By Type (2021-2032)
Table 27 South America Dried Honey Revenue (USD Million) By Application (2021-2032)
Table 28 South America Dried Honey Revenue (USD Million) By Product (2021-2032)
Table 29 Middle East and Africa Dried Honey Revenue (USD Million) By Type (2021-2032)
Table 30 Middle East and Africa Dried Honey Revenue (USD Million) By Application (2021-2032)
Table 31 Middle East and Africa Dried Honey Revenue (USD Million) By Product (2021-2032)
LIST OF FIGURES
Figure 1. Market Scope
Figure 2. Pricing Forecasts Per Unit, 2023- 2032
Figure 3. Porter’s Five Forces
Figure 4. Global Dried Honey Market Revenue (USD Million) By Regions (2021-2032)
Figure 5. Global Dried Honey Market Share (%) By Regions (2023)
Figure 6. North America Dried Honey Revenue (USD Million) By Country (2021-2032)
Figure 7. United States Dried Honey Revenue (USD Million) By Country (2021-2032)
Figure 8. Canada Dried Honey Revenue (USD Million) By Country (2021-2032)
Figure 9. Mexico Dried Honey Revenue (USD Million) By Country (2021-2032)
Figure 10. Europe Dried Honey Revenue (USD Million) By Country (2021-2032)
Figure 11. Germany Dried Honey Revenue (USD Million) By Country (2021-2032)
Figure 12. France Dried Honey Revenue (USD Million) By Country (2021-2032)
Figure 13. United Kingdom Dried Honey Revenue (USD Million) By Country (2021-2032)
Figure 14. Spain Dried Honey Revenue (USD Million) By Country (2021-2032)
Figure 15. Italy Dried Honey Revenue (USD Million) By Country (2021-2032)
Figure 16. Russia Dried Honey Revenue (USD Million) By Country (2021-2032)
Figure 17. Rest of Europe Dried Honey Revenue (USD Million) By Country (2021-2032)
Figure 11. Asia Pacific Dried Honey Revenue (USD Million) By Country (2021-2032)
Figure 12. China Dried Honey Revenue (USD Million) By Country (2021-2032)
Figure 13. Japan Dried Honey Revenue (USD Million) By Country (2021-2032)
Figure 14. India Dried Honey Revenue (USD Million) By Country (2021-2032)
Figure 15. South Korea Dried Honey Revenue (USD Million) By Country (2021-2032)
Figure 16. Australia Dried Honey Revenue (USD Million) By Country (2021-2032)
Figure 17. South East Asia Dried Honey Revenue (USD Million) By Country (2021-2032)
Figure 18. South America Dried Honey Revenue (USD Million) By Country (2021-2032)
Figure 19. Brazil Dried Honey Revenue (USD Million) By Country (2021-2032)
Figure 20. Argentina Dried Honey Revenue (USD Million) By Country (2021-2032)
Figure 21. Rest of Asia Pacific Dried Honey Revenue (USD Million) By Country (2021-2032)
Figure 22. Middle East and Africa Dried Honey Revenue (USD Million) By Region (2021-2032)
Figure 23. Saudi Arabia Dried Honey Revenue (USD Million) By Region (2021-2032)
Figure 24. The UAE Dried Honey Revenue (USD Million) By Region (2021-2032)
Figure 25. Rest of Middle East Dried Honey Revenue (USD Million) By Region (2021-2032)
Figure 26. South Africa Dried Honey Revenue (USD Million) By Region (2021-2032)
Figure 27. Africa Dried Honey Revenue (USD Million) By Region (2021-2032)
Figure 28. North America Dried Honey Revenue (USD Million) By Type (2021-2032)
Figure 29. North America Dried Honey Revenue (USD Million) By Application (2021-2032)
Figure 30. North America Dried Honey Revenue (USD Million) By Product (2021-2032)
Figure 31. Europe Dried Honey Revenue (USD Million) By Type (2021-2032)
Figure 32. Europe Dried Honey Revenue (USD Million) By Application (2021-2032)
Figure 33. Europe Dried Honey Revenue (USD Million) By Product (2021-2032)
Figure 34. Asia Pacific Dried Honey Revenue (USD Million) By Type (2021-2032)
Figure 35. Asia Pacific Dried Honey Revenue (USD Million) By Application (2021-2032)
Figure 36. Asia Pacific Dried Honey Revenue (USD Million) By Product (2021-2032)
Figure 37. South America Dried Honey Revenue (USD Million) By Type (2021-2032)
Figure 38. South America Dried Honey Revenue (USD Million) By Application (2021-2032)
Figure 39. South America Dried Honey Revenue (USD Million) By Product (2021-2032)
Figure 40. Middle East and Africa Dried Honey Revenue (USD Million) By Type (2021-2032)
Figure 41. Middle East and Africa Dried Honey Revenue (USD Million) By Application (2021-2032)
Figure 42. Middle East and Africa Dried Honey Revenue (USD Million) By Product (2021-2032)
By Form
Powder
Granules
By Type
Organic
Conventional
By Application
Food & Beverages
Personal Care
Pharmaceuticals
Nutraceuticals
Others
Countries Analyzed
North America (US, Canada, Mexico)
Europe (Germany, UK, France, Spain, Italy, Russia, Rest of Europe)
Asia Pacific (China, India, Japan, South Korea, Australia, South East Asia, Rest of Asia)
South America (Brazil, Argentina, Rest of South America)
Middle East and Africa (Saudi Arabia, UAE, Rest of Middle East, South Africa, Egypt, Rest of Africa)
