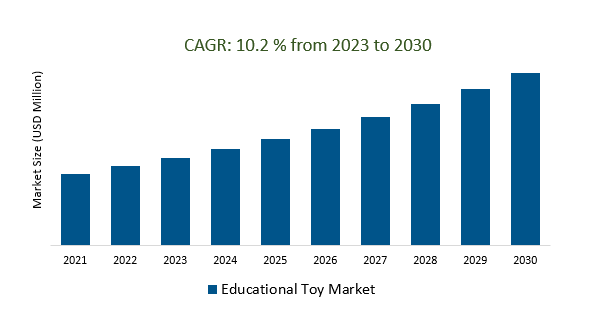
The Global Educational Toy Market Size is estimated to register XX% growth over the forecast period from 2023 to 2030.
The market growth is driven by an increasing number of educational toys with augmented reality (AR) and virtual reality (VR) capabilities, as well as those that can be connected to smartphones or tablets, which are becoming increasingly popular. Leading Companies focusing on Continued Technological Integration, Online and Digital Learning Aids, Sustainability and Eco-Friendly Toys, Active Learning, Edutainment, and others to boost market shares in the industry.
Market Overview
The educational toy market was thriving, characterized by robust growth, a strong focus on STEM and digital toys, increasing demand for eco-friendly options, collaborations with popular brands, global reach, parental awareness of early childhood education, online sales dominance, intense competition, and stringent safety regulations. Please note that this information may have evolved, and the market's current status could differ.
Market Dynamics
Market Trends- The educational toy market is increasingly focused on STEAM learning, which is an integrated approach to teaching science, technology, engineering, arts, and mathematics.
The educational toy market has undergone a significant shift in recent years, with a growing emphasis on STEAM learning. This approach integrates science, technology, engineering, arts, and mathematics to provide children with a holistic educational experience through play. STEAM-focused educational toys not only foster a deeper understanding of these subjects but also encourage creativity, critical thinking, and problem-solving skills. By blending fun and learning, these toys are helping children develop a well-rounded skill set, preparing them for the challenges of the modern world and future careers in innovation and technology.
Market Driver- Parents are increasingly demanding eco-friendly and sustainable toys for their children's educational needs.
parents are increasingly seeking eco-friendly and sustainable options in the educational toy market for their children. These conscientious consumers prioritize toys made from recycled or natural materials, aiming to reduce their ecological footprint while providing their children with engaging and enriching play experiences. This shift underscores a broader societal commitment to sustainability and eco-conscious parenting, reflecting a desire to instill environmentally responsible values in the next generation, even through their choice of toys.
Market Opportunity- Educational toy companies are increasingly offering multicultural and inclusive toys to teach children about diversity and promote social-emotional learning.
Educational toy companies are responding to the need for greater inclusivity and cultural diversity in their products, with a growing emphasis on toys that teach children about different cultures and promote social-emotional learning. These toys aim to foster empathy, understanding, and open-mindedness in young minds by celebrating various backgrounds and experiences, ultimately contributing to a more inclusive and globally aware generation.
Market Share Analysis- Cognitive toys Educational Toy Market will register the fastest growth
The Global Educational Toy Market is analyzed across Academic toys, Cognitive toys, Motor skill toys, and others. Cognitive toys are poised to register the fastest growth. Cognitive toys play a significant role in the educational toy market by targeting cognitive development in children. These toys are designed to enhance various cognitive skills, including problem-solving, critical thinking, memory, and logic, while making learning enjoyable and engaging. Examples of cognitive toys include puzzles, memory games, building blocks, and interactive educational apps.
Market Share Analysis- 0 to 4 years held a significant market share in 2023
The Global Educational Toy Market is analyzed across various Organizations including 0 to 4 years, 4 to 8 years, above 8 years, and others. Of these, 0 to 4 years held a significant market share in 2023. The educational toy market for children aged 0 to 4 years focuses on early childhood development, offering toys that promote sensory exploration, motor skills, language acquisition, and cognitive abilities. Examples include sensory mats, stacking toys, and interactive learning games, emphasizing play-based learning to build a strong educational foundation during these crucial formative years.
Educational Toy Market Segmentation
By Type
- Academic toys
- Cognitive toys
- Motor skill toys
- Others
By Age Group
- 0 to 4 years
- 4 to 8 years
- Above 8 years
By Distribution Channel
By Region
- North America (United States, Canada, Mexico)
- Europe (Germany, France, United Kingdom, Spain, Italy, Others)
- Asia Pacific (China, India, Japan, South Korea, Australia, Others)
- Latin America (Brazil, Argentina, Others)
- Middle East and Africa (Saudi Arabia, UAE, Kuwait, Other Middle East, South Africa, Nigeria, Other Africa)
Educational Toy Market Companies
- LEGO System AS
- Mattel Inc
- All Star Learning Inc
- Engino.net Ltd
- Melissa and Doug
- Fat Brain Toys LLC
- HABA USA
- CocoMoco Kids
- Little Genius Toys Pvt Ltd
- Evollve Inc
- My Luxeve Pty Ltd
- Oriental Trading Co
- Pegasus for kids
- WowWee Group Ltd
- Mishka AI
- Learning Resources Ltd
*List not exhaustive
Educational Toy Market Outlook 2023
1 Market Overview
1.1 Introduction to the Educational Toy Market
1.2 Scope of the Study
1.3 Research Objective
1.3.1 Key Market Scope and Segments
1.3.2 Players Covered
1.3.3 Years Considered
2 Executive Summary
2.1 2023 Educational Toy Industry- Market Statistics
3 Market Dynamics
3.1 Market Drivers
3.2 Market Challenges
3.3 Market Opportunities
3.4 Market Trends
4 Market Factor Analysis
4.1 Porter’s Five Forces
4.2 Market Entropy
4.2.1 Global Educational Toy Market Companies with Area Served
4.2.2 Products Offerings Global Educational Toy Market
5 COVID-19 Impact Analysis and Outlook Scenarios
5.1.1 Covid-19 Impact Analysis
5.1.2 post-COVID-19 Scenario- Low Growth Case
5.1.3 post-COVID-19 Scenario- Reference Growth Case
5.1.4 post-COVID-19 Scenario- Low Growth Case
6 Global Educational Toy Market Trends
6.1 Global Educational Toy Revenue (USD Million) and CAGR (%) by Type (2018-2030)
6.2 Global Educational Toy Revenue (USD Million) and CAGR (%) by Applications (2018-2030)
6.3 Global Educational Toy Revenue (USD Million) and CAGR (%) by regions (2018-2030)
7 Global Educational Toy Market Revenue (USD Million) by Type, and Applications (2018-2022)
7.1 Global Educational Toy Revenue (USD Million) by Type (2018-2022)
7.1.1 Global Educational Toy Revenue (USD Million), Market Share (%) by Type (2018-2022)
7.2 Global Educational Toy Revenue (USD Million) by Applications (2018-2022)
7.2.1 Global Educational Toy Revenue (USD Million), Market Share (%) by Applications (2018-2022)
8 Global Educational Toy Development Regional Status and Outlook
8.1 Global Educational Toy Revenue (USD Million) By Regions (2018-2022)
8.2 North America Educational Toy Revenue (USD Million) by Type, and Application (2018-2022)
8.2.1 North America Educational Toy Revenue (USD Million) by Country (2018-2022)
8.2.2 North America Educational Toy Revenue (USD Million) by Type (2018-2022)
8.2.3 North America Educational Toy Revenue (USD Million) by Applications (2018-2022)
8.3 Europe Educational Toy Revenue (USD Million), by Type, and Applications (USD Million) (2018-2022)
8.3.1 Europe Educational Toy Revenue (USD Million), by Country (2018-2022)
8.3.2 Europe Educational Toy Revenue (USD Million) by Type (2018-2022)
8.3.3 Europe Educational Toy Revenue (USD Million) by Applications (2018-2022)
8.4 Asia Pacific Educational Toy Revenue (USD Million), and Revenue (USD Million) by Type, and Applications (2018-2022)
8.4.1 Asia Pacific Educational Toy Revenue (USD Million) by Country (2018-2022)
8.4.2 Asia Pacific Educational Toy Revenue (USD Million) by Type (2018-2022)
8.4.3 Asia Pacific Educational Toy Revenue (USD Million) by Applications (2018-2022)
8.5 South America Educational Toy Revenue (USD Million), by Type, and Applications (2018-2022)
8.5.1 South America Educational Toy Revenue (USD Million), by Country (2018-2022)
8.5.2 South America Educational Toy Revenue (USD Million) by Type (2018-2022)
8.5.3 South America Educational Toy Revenue (USD Million) by Applications (2018-2022)
8.6 Middle East and Africa Educational Toy Revenue (USD Million), by Type, Technology, Application, Thickness (2018-2022)
8.6.1 Middle East and Africa Educational Toy Revenue (USD Million) by Country (2018-2022)
8.6.2 Middle East and Africa Educational Toy Revenue (USD Million) by Type (2018-2022)
8.6.3 Middle East and Africa Educational Toy Revenue (USD Million) by Applications (2018-2022)
9 Company Profiles
10 Global Educational Toy Market Revenue (USD Million), by Type, and Applications (2023-2030)
10.1 Global Educational Toy Revenue (USD Million) and Market Share (%) by Type (2023-2030)
10.1.1 Global Educational Toy Revenue (USD Million), and Market Share (%) by Type (2023-2030)
10.2 Global Educational Toy Revenue (USD Million) and Market Share (%) by Applications (2023-2030)
10.2.1 Global Educational Toy Revenue (USD Million), and Market Share (%) by Applications (2023-2030)
11 Global Educational Toy Development Regional Status and Outlook Forecast
11.1 Global Educational Toy Revenue (USD Million) By Regions (2023-2030)
11.2 North America Educational Toy Revenue (USD Million) by Type, and Applications (2023-2030)
11.2.1 North America Educational Toy Revenue (USD) Million by Country (2023-2030)
11.2.2 North America Educational Toy Revenue (USD Million), by Type (2023-2030)
11.2.3 North America Educational Toy Revenue (USD Million), Market Share (%) by Applications (2023-2030)
11.3 Europe Educational Toy Revenue (USD Million), by Type, and Applications (2023-2030)
11.3.1 Europe Educational Toy Revenue (USD Million), by Country (2023-2030)
11.3.2 Europe Educational Toy Revenue (USD Million), by Type (2023-2030)
11.3.3 Europe Educational Toy Revenue (USD Million), by Applications (2023-2030)
11.4 Asia Pacific Educational Toy Revenue (USD Million) by Type, and Applications (2023-2030)
11.4.1 Asia Pacific Educational Toy Revenue (USD Million), by Country (2023-2030)
11.4.2 Asia Pacific Educational Toy Revenue (USD Million), by Type (2023-2030)
11.4.3 Asia Pacific Educational Toy Revenue (USD Million), by Applications (2023-2030)
11.5 South America Educational Toy Revenue (USD Million), by Type, and Applications (2023-2030)
11.5.1 South America Educational Toy Revenue (USD Million), by Country (2023-2030)
11.5.2 South America Educational Toy Revenue (USD Million), by Type (2023-2030)
11.5.3 South America Educational Toy Revenue (USD Million), by Applications (2023-2030)
11.6 Middle East and Africa Educational Toy Revenue (USD Million), by Type, and Applications (2023-2030)
11.6.1 Middle East and Africa Educational Toy Revenue (USD Million), by region (2023-2030)
11.6.2 Middle East and Africa Educational Toy Revenue (USD Million), by Type (2023-2030)
11.6.3 Middle East and Africa Educational Toy Revenue (USD Million), by Applications (2023-2030)
12 Methodology and Data Sources
12.1 Methodology/Research Approach
12.1.1 Research Programs/Design
12.1.2 Market Size Estimation
12.1.3 Market Breakdown and Data Triangulation
12.2 Data Sources
12.2.1 Secondary Sources
12.2.2 Primary Sources
12.3 Disclaimer
List of Tables
Table 1 Market Segmentation Analysis
Table 2 Global Educational Toy Market Companies with Areas Served
Table 3 Products Offerings Global Educational Toy Market
Table 4 Low Growth Scenario Forecasts
Table 5 Reference Case Growth Scenario
Table 6 High Growth Case Scenario
Table 7 Global Educational Toy Revenue (USD Million) And CAGR (%) By Type (2018-2030)
Table 8 Global Educational Toy Revenue (USD Million) And CAGR (%) By Applications (2018-2030)
Table 9 Global Educational Toy Revenue (USD Million) And CAGR (%) By Regions (2018-2030)
Table 10 Global Educational Toy Revenue (USD Million) By Type (2018-2022)
Table 11 Global Educational Toy Revenue Market Share (%) By Type (2018-2022)
Table 12 Global Educational Toy Revenue (USD Million) By Applications (2018-2022)
Table 13 Global Educational Toy Revenue Market Share (%) By Applications (2018-2022)
Table 14 Global Educational Toy Market Revenue (USD Million) By Regions (2018-2022)
Table 15 Global Educational Toy Market Share (%) By Regions (2018-2022)
Table 16 North America Educational Toy Revenue (USD Million) By Country (2018-2022)
Table 17 North America Educational Toy Revenue (USD Million) By Type (2018-2022)
Table 18 North America Educational Toy Revenue (USD Million) By Applications (2018-2022)
Table 19 Europe Educational Toy Revenue (USD Million) By Country (2018-2022)
Table 20 Europe Educational Toy Revenue (USD Million) By Type (2018-2022)
Table 21 Europe Educational Toy Revenue (USD Million) By Applications (2018-2022)
Table 22 Asia Pacific Educational Toy Revenue (USD Million) By Country (2018-2022)
Table 23 Asia Pacific Educational Toy Revenue (USD Million) By Type (2018-2022)
Table 24 Asia Pacific Educational Toy Revenue (USD Million) By Applications (2018-2022)
Table 25 South America Educational Toy Revenue (USD Million) By Country (2018-2022)
Table 26 South America Educational Toy Revenue (USD Million) By Type (2018-2022)
Table 27 South America Educational Toy Revenue (USD Million) By Applications (2018-2022)
Table 28 Middle East and Africa Educational Toy Revenue (USD Million) By Region (2018-2022)
Table 29 Middle East and Africa Educational Toy Revenue (USD Million) By Type (2018-2022)
Table 30 Middle East and Africa Educational Toy Revenue (USD Million) By Applications (2018-2022)
Table 31 Financial Analysis
Table 32 Global Educational Toy Revenue (USD Million) By Type (2023-2030)
Table 33 Global Educational Toy Revenue Market Share (%) By Type (2023-2030)
Table 34 Global Educational Toy Revenue (USD Million) By Applications (2023-2030)
Table 35 Global Educational Toy Revenue Market Share (%) By Applications (2023-2030)
Table 36 Global Educational Toy Market Revenue (USD Million), And Revenue (USD Million) By Regions (2023-2030)
Table 37 North America Educational Toy Revenue (USD)By Country (2023-2030)
Table 38 North America Educational Toy Revenue (USD Million) By Type (2023-2030)
Table 39 North America Educational Toy Revenue (USD Million) By Applications (2023-2030)
Table 40 Europe Educational Toy Revenue (USD Million) By Country (2023-2030)
Table 41 Europe Educational Toy Revenue (USD Million) By Type (2023-2030)
Table 42 Europe Educational Toy Revenue (USD Million) By Applications (2023-2030)
Table 43 Asia Pacific Educational Toy Revenue (USD Million) By Country (2023-2030)
Table 44 Asia Pacific Educational Toy Revenue (USD Million) By Type (2023-2030)
Table 45 Asia Pacific Educational Toy Revenue (USD Million) By Applications (2023-2030)
Table 46 South America Educational Toy Revenue (USD Million) By Country (2023-2030)
Table 47 South America Educational Toy Revenue (USD Million) By Type (2023-2030)
Table 48 South America Educational Toy Revenue (USD Million) By Applications (2023-2030)
Table 49 Middle East and Africa Educational Toy Revenue (USD Million) By Region (2023-2030)
Table 50 Middle East and Africa Educational Toy Revenue (USD Million) By Region (2023-2030)
Table 51 Middle East and Africa Educational Toy Revenue (USD Million) By Type (2023-2030)
Table 52 Middle East and Africa Educational Toy Revenue (USD Million) By Applications (2023-2030)
Table 53 Research Programs/Design for This Report
Table 54 Key Data Information from Secondary Sources
Table 55 Key Data Information from Primary Sources
List of Figures
Figure 1 Market Scope
Figure 2 Porter’s Five Forces
Figure 3 Global Educational Toy Revenue (USD Million) By Type (2018-2022)
Figure 4 Global Educational Toy Revenue Market Share (%) By Type (2022)
Figure 5 Global Educational Toy Revenue (USD Million) By Applications (2018-2022)
Figure 6 Global Educational Toy Revenue Market Share (%) By Applications (2022)
Figure 7 Global Educational Toy Market Revenue (USD Million) By Regions (2018-2022)
Figure 8 Global Educational Toy Market Share (%) By Regions (2022)
Figure 9 North America Educational Toy Revenue (USD Million) By Country (2018-2022)
Figure 10 North America Educational Toy Revenue (USD Million) By Type (2018-2022)
Figure 11 North America Educational Toy Revenue (USD Million) By Applications (2018-2022)
Figure 12 Europe Educational Toy Revenue (USD Million) By Country (2018-2022)
Figure 13 Europe Educational Toy Revenue (USD Million) By Type (2018-2022)
Figure 14 Europe Educational Toy Revenue (USD Million) By Applications (2018-2022)
Figure 15 Asia Pacific Educational Toy Revenue (USD Million) By Country (2018-2022)
Figure 16 Asia Pacific Educational Toy Revenue (USD Million) By Type (2018-2022)
Figure 17 Asia Pacific Educational Toy Revenue (USD Million) By Applications (2018-2022)
Figure 18 South America Educational Toy Revenue (USD Million) By Country (2018-2022)
Figure 19 South America Educational Toy Revenue (USD Million) By Type (2018-2022)
Figure 20 South America Educational Toy Revenue (USD Million) By Applications (2018-2022)
Figure 21 Middle East and Africa Educational Toy Revenue (USD Million) By Region (2018-2022)
Figure 22 Middle East and Africa Educational Toy Revenue (USD Million) By Type (2018-2022)
Figure 23 Middle East and Africa Educational Toy Revenue (USD Million) By Applications (2018-2022)
Figure 24 Global Educational Toy Revenue (USD Million) By Type (2023-2030)
Figure 25 Global Educational Toy Revenue Market Share (%) By Type (2030)
Figure 26 Global Educational Toy Revenue (USD Million) By Applications (2023-2030)
Figure 27 Global Educational Toy Revenue Market Share (%) By Applications (2030)
Figure 28 Global Educational Toy Market Revenue (USD Million) By Regions (2023-2030)
Figure 29 North America Educational Toy Revenue (USD Million) By Country (2023-2030)
Figure 30 North America Educational Toy Revenue (USD Million) By Type (2023-2030)
Figure 31 North America Educational Toy Revenue (USD Million) By Applications (2023-2030)
Figure 32 Europe Educational Toy Revenue (USD Million) By Country (2023-2030)
Figure 33 Europe Educational Toy Revenue (USD Million) By Type (2023-2030)
Figure 34 Europe Educational Toy Revenue (USD Million) By Applications (2023-2030)
Figure 35 Asia Pacific Educational Toy Revenue (USD Million) By Country (2023-2030)
Figure 36 Asia Pacific Educational Toy Revenue (USD Million) By Type (2023-2030)
Figure 37 Asia Pacific Educational Toy Revenue (USD Million) By Applications (2023-2030)
Figure 38 South America Educational Toy Revenue (USD Million) By Country (2023-2030)
Figure 39 South America Educational Toy Revenue (USD Million) By Type (2023-2030)
Figure 40 South America Educational Toy Revenue (USD Million) By Applications (2023-2030)
Figure 41 Middle East and Africa Educational Toy Revenue (USD Million) By Region (2023-2030)
Figure 42 Middle East and Africa Educational Toy Revenue (USD Million) By Region (2023-2030)
Figure 43 Middle East and Africa Educational Toy Revenue (USD Million) By Type (2023-2030)
Figure 44 Middle East and Africa Educational Toy Revenue (USD Million) By Applications (2023-2030)
Figure 45 Bottom-Up and Top-Down Approaches for This Report
Figure 46 Data Triangulation
