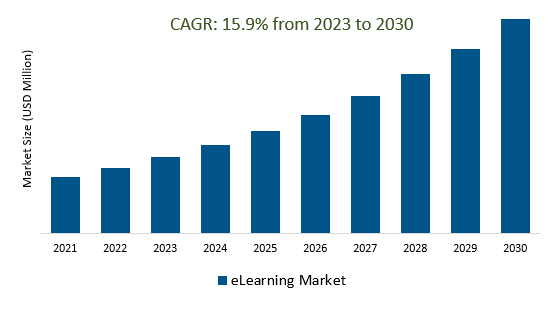
The Global eLearning Market Size is estimated to register 15.9% growth over the forecast period from 2023 to 2030.
An increase drives the market growth Adaptive learning platforms that customize content and pace to individual learners' needs are increasingly in demand. This tailors the learning experience for better outcomes. Leading Companies focusing on Continuous Technological Advancements, Globalization and Accessibility, Corporate and Professional Training, Personalization and Adaptive Learning, K-12 and Higher Education, Emerging Markets, and others to boost market shares in the industry.
Market Overview
The eLearning market was a rapidly growing sector encompassing various segments, including K-12 and higher education, corporate training, and skill development. It was characterized by technological advancements such as AI, VR, and mobile learning, offering a wide variety of content types and personalized learning experiences. Key players included Coursera, edX, Udemy, and LinkedIn Learning, among others. The pandemic significantly accelerated its growth, leading to a surge in demand for online education and training. Despite its rapid expansion, challenges remained, including addressing the digital divide and ensuring the quality of online courses while complying with relevant regulations.
Market Dynamics
Market Trends- Gamification and serious games are a powerful combination that can be used to create more engaging and effective eLearning experiences.
Gamification and serious games are compelling strategies that enhance eLearning experiences by incorporating gaming elements to motivate learners and by offering immersive, hands-on simulations that bridge the gap between theory and practice. This approach is particularly valuable in fields like healthcare and corporate training, making education more engaging and effective, with growing recognition within the eLearning market.
Market Driver- The growing demand for corporate training and upskilling is fueling the eLearning market.
The eLearning market is thriving as the demand for corporate training and upskilling surges. Businesses are increasingly turning to eLearning solutions to provide flexible and effective training programs for employees in response to technological advancements and changing market dynamics, especially in remote and hybrid work environments. This trend is driving the growth of customized, corporate-focused content and platforms, making eLearning an essential tool for companies to maintain competitiveness and adaptability in the modern business landscape.
Market Opportunity- Government initiatives and regulations are shaping the eLearning market.
Government initiatives and regulations exert a significant influence on the eLearning market, impacting its adoption, quality, and accessibility. Policies introduced during the COVID-19 pandemic have encouraged eLearning adoption, while content standards, data privacy laws, and accreditation requirements shape the industry. As a result, eLearning providers must adapt to comply with these regulations, making government involvement a crucial factor in defining market trends and practices.
Market Share Analysis- Mobile e-learning the eLearning Market will register the fastest growth
The Global eLearning Market is analyzed across Online e-learning, Learning Management System (LMS), Mobile e-learning, Rapid e-learning, Virtual classroom, and others. Mobile e-learning is poised to register the fastest growth. Mobile e-learning, known as mLearning, is a significant and expanding part of the eLearning market, delivering educational content through mobile devices like smartphones and tablets. Its growth is fueled by device accessibility, improved connectivity, and the need for flexible, on-the-go learning. With responsive design and mobile apps, mobile e-learning is expected to remain a vital component of the eLearning market, catering to both formal education and professional development.
Market Share Analysis- Content held a significant market share in 2023
The Global eLearning Market is analyzed across various Organizations including Services, Content, and others. Of these, Content held a significant market share in 2023. Mobile e-learning, known as mLearning, is a significant and expanding part of the eLearning market, delivering educational content through mobile devices like smartphones and tablets. Its growth is fueled by device accessibility, improved connectivity, and the need for flexible, on-the-go learning. With responsive design and mobile apps, mobile e-learning is expected to remain a vital component of the eLearning market, catering to both formal education and professional development.
eLearning Market News-
Learnlight, a renowned global provider of language training, intercultural skills, and soft skills education, has completed the acquisition of IBE, a prominent Italian language training firm.
The World Trade Organization (WTO) introduces a fresh e-Learning platform On December 12th, the WTO unveiled an enhanced e-Learning platform designed to improve the learning experience for both beneficiaries of WTO technical assistance and the general public.
eLearning Market Segmentation
By Technology
- Online e-learning
- Learning Management System (LMS)
- Mobile e-learning
- Rapid e-learning
- Virtual classroom
- Others
By Provider
By Application
- Academic
- Corporate
- Government
By Region
- North America (United States, Canada, Mexico)
- Europe (Germany, France, United Kingdom, Spain, Italy, Others)
- Asia Pacific (China, India, Japan, South Korea, Australia, Others)
- Latin America (Brazil, Argentina, Others)
- Middle East and Africa (Saudi Arabia, UAE, Kuwait, Other Middle East, South Africa, Nigeria, Other Africa)
eLearning Market Companies
- Cisco Systems
- Oracle Corp
- Aptara Inc
- Instructure Inc
- Adobe Inc
- Blackboard Inc
- GP Strategies Corp
- Thomson Reuters Corp
- NIIT Ltd
- Skillsoft Corp
- Pearson Plc
*List not exhaustive
ELearning Market Outlook 2023
1 Market Overview
1.1 Introduction to the ELearning Market
1.2 Scope of the Study
1.3 Research Objective
1.3.1 Key Market Scope and Segments
1.3.2 Players Covered
1.3.3 Years Considered
2 Executive Summary
2.1 2023 ELearning Industry- Market Statistics
3 Market Dynamics
3.1 Market Drivers
3.2 Market Challenges
3.3 Market Opportunities
3.4 Market Trends
4 Market Factor Analysis
4.1 Porter’s Five Forces
4.2 Market Entropy
4.2.1 Global ELearning Market Companies with Area Served
4.2.2 Products Offerings Global ELearning Market
5 COVID-19 Impact Analysis and Outlook Scenarios
5.1.1 Covid-19 Impact Analysis
5.1.2 post-COVID-19 Scenario- Low Growth Case
5.1.3 post-COVID-19 Scenario- Reference Growth Case
5.1.4 post-COVID-19 Scenario- Low Growth Case
6 Global ELearning Market Trends
6.1 Global ELearning Revenue (USD Million) and CAGR (%) by Type (2018-2030)
6.2 Global ELearning Revenue (USD Million) and CAGR (%) by Applications (2018-2030)
6.3 Global ELearning Revenue (USD Million) and CAGR (%) by regions (2018-2030)
7 Global ELearning Market Revenue (USD Million) by Type, and Applications (2018-2022)
7.1 Global ELearning Revenue (USD Million) by Type (2018-2022)
7.1.1 Global ELearning Revenue (USD Million), Market Share (%) by Type (2018-2022)
7.2 Global ELearning Revenue (USD Million) by Applications (2018-2022)
7.2.1 Global ELearning Revenue (USD Million), Market Share (%) by Applications (2018-2022)
8 Global ELearning Development Regional Status and Outlook
8.1 Global ELearning Revenue (USD Million) By Regions (2018-2022)
8.2 North America ELearning Revenue (USD Million) by Type, and Application (2018-2022)
8.2.1 North America ELearning Revenue (USD Million) by Country (2018-2022)
8.2.2 North America ELearning Revenue (USD Million) by Type (2018-2022)
8.2.3 North America ELearning Revenue (USD Million) by Applications (2018-2022)
8.3 Europe ELearning Revenue (USD Million), by Type, and Applications (USD Million) (2018-2022)
8.3.1 Europe ELearning Revenue (USD Million), by Country (2018-2022)
8.3.2 Europe ELearning Revenue (USD Million) by Type (2018-2022)
8.3.3 Europe ELearning Revenue (USD Million) by Applications (2018-2022)
8.4 Asia Pacific ELearning Revenue (USD Million), and Revenue (USD Million) by Type, and Applications (2018-2022)
8.4.1 Asia Pacific ELearning Revenue (USD Million) by Country (2018-2022)
8.4.2 Asia Pacific ELearning Revenue (USD Million) by Type (2018-2022)
8.4.3 Asia Pacific ELearning Revenue (USD Million) by Applications (2018-2022)
8.5 South America ELearning Revenue (USD Million), by Type, and Applications (2018-2022)
8.5.1 South America ELearning Revenue (USD Million), by Country (2018-2022)
8.5.2 South America ELearning Revenue (USD Million) by Type (2018-2022)
8.5.3 South America ELearning Revenue (USD Million) by Applications (2018-2022)
8.6 Middle East and Africa ELearning Revenue (USD Million), by Type, Technology, Application, Thickness (2018-2022)
8.6.1 Middle East and Africa ELearning Revenue (USD Million) by Country (2018-2022)
8.6.2 Middle East and Africa ELearning Revenue (USD Million) by Type (2018-2022)
8.6.3 Middle East and Africa ELearning Revenue (USD Million) by Applications (2018-2022)
9 Company Profiles
10 Global ELearning Market Revenue (USD Million), by Type, and Applications (2023-2030)
10.1 Global ELearning Revenue (USD Million) and Market Share (%) by Type (2023-2030)
10.1.1 Global ELearning Revenue (USD Million), and Market Share (%) by Type (2023-2030)
10.2 Global ELearning Revenue (USD Million) and Market Share (%) by Applications (2023-2030)
10.2.1 Global ELearning Revenue (USD Million), and Market Share (%) by Applications (2023-2030)
11 Global ELearning Development Regional Status and Outlook Forecast
11.1 Global ELearning Revenue (USD Million) By Regions (2023-2030)
11.2 North America ELearning Revenue (USD Million) by Type, and Applications (2023-2030)
11.2.1 North America ELearning Revenue (USD) Million by Country (2023-2030)
11.2.2 North America ELearning Revenue (USD Million), by Type (2023-2030)
11.2.3 North America ELearning Revenue (USD Million), Market Share (%) by Applications (2023-2030)
11.3 Europe ELearning Revenue (USD Million), by Type, and Applications (2023-2030)
11.3.1 Europe ELearning Revenue (USD Million), by Country (2023-2030)
11.3.2 Europe ELearning Revenue (USD Million), by Type (2023-2030)
11.3.3 Europe ELearning Revenue (USD Million), by Applications (2023-2030)
11.4 Asia Pacific ELearning Revenue (USD Million) by Type, and Applications (2023-2030)
11.4.1 Asia Pacific ELearning Revenue (USD Million), by Country (2023-2030)
11.4.2 Asia Pacific ELearning Revenue (USD Million), by Type (2023-2030)
11.4.3 Asia Pacific ELearning Revenue (USD Million), by Applications (2023-2030)
11.5 South America ELearning Revenue (USD Million), by Type, and Applications (2023-2030)
11.5.1 South America ELearning Revenue (USD Million), by Country (2023-2030)
11.5.2 South America ELearning Revenue (USD Million), by Type (2023-2030)
11.5.3 South America ELearning Revenue (USD Million), by Applications (2023-2030)
11.6 Middle East and Africa ELearning Revenue (USD Million), by Type, and Applications (2023-2030)
11.6.1 Middle East and Africa ELearning Revenue (USD Million), by region (2023-2030)
11.6.2 Middle East and Africa ELearning Revenue (USD Million), by Type (2023-2030)
11.6.3 Middle East and Africa ELearning Revenue (USD Million), by Applications (2023-2030)
12 Methodology and Data Sources
12.1 Methodology/Research Approach
12.1.1 Research Programs/Design
12.1.2 Market Size Estimation
12.1.3 Market Breakdown and Data Triangulation
12.2 Data Sources
12.2.1 Secondary Sources
12.2.2 Primary Sources
12.3 Disclaimer
List of Tables
Table 1 Market Segmentation Analysis
Table 2 Global ELearning Market Companies with Areas Served
Table 3 Products Offerings Global ELearning Market
Table 4 Low Growth Scenario Forecasts
Table 5 Reference Case Growth Scenario
Table 6 High Growth Case Scenario
Table 7 Global ELearning Revenue (USD Million) And CAGR (%) By Type (2018-2030)
Table 8 Global ELearning Revenue (USD Million) And CAGR (%) By Applications (2018-2030)
Table 9 Global ELearning Revenue (USD Million) And CAGR (%) By Regions (2018-2030)
Table 10 Global ELearning Revenue (USD Million) By Type (2018-2022)
Table 11 Global ELearning Revenue Market Share (%) By Type (2018-2022)
Table 12 Global ELearning Revenue (USD Million) By Applications (2018-2022)
Table 13 Global ELearning Revenue Market Share (%) By Applications (2018-2022)
Table 14 Global ELearning Market Revenue (USD Million) By Regions (2018-2022)
Table 15 Global ELearning Market Share (%) By Regions (2018-2022)
Table 16 North America ELearning Revenue (USD Million) By Country (2018-2022)
Table 17 North America ELearning Revenue (USD Million) By Type (2018-2022)
Table 18 North America ELearning Revenue (USD Million) By Applications (2018-2022)
Table 19 Europe ELearning Revenue (USD Million) By Country (2018-2022)
Table 20 Europe ELearning Revenue (USD Million) By Type (2018-2022)
Table 21 Europe ELearning Revenue (USD Million) By Applications (2018-2022)
Table 22 Asia Pacific ELearning Revenue (USD Million) By Country (2018-2022)
Table 23 Asia Pacific ELearning Revenue (USD Million) By Type (2018-2022)
Table 24 Asia Pacific ELearning Revenue (USD Million) By Applications (2018-2022)
Table 25 South America ELearning Revenue (USD Million) By Country (2018-2022)
Table 26 South America ELearning Revenue (USD Million) By Type (2018-2022)
Table 27 South America ELearning Revenue (USD Million) By Applications (2018-2022)
Table 28 Middle East and Africa ELearning Revenue (USD Million) By Region (2018-2022)
Table 29 Middle East and Africa ELearning Revenue (USD Million) By Type (2018-2022)
Table 30 Middle East and Africa ELearning Revenue (USD Million) By Applications (2018-2022)
Table 31 Financial Analysis
Table 32 Global ELearning Revenue (USD Million) By Type (2023-2030)
Table 33 Global ELearning Revenue Market Share (%) By Type (2023-2030)
Table 34 Global ELearning Revenue (USD Million) By Applications (2023-2030)
Table 35 Global ELearning Revenue Market Share (%) By Applications (2023-2030)
Table 36 Global ELearning Market Revenue (USD Million), And Revenue (USD Million) By Regions (2023-2030)
Table 37 North America ELearning Revenue (USD)By Country (2023-2030)
Table 38 North America ELearning Revenue (USD Million) By Type (2023-2030)
Table 39 North America ELearning Revenue (USD Million) By Applications (2023-2030)
Table 40 Europe ELearning Revenue (USD Million) By Country (2023-2030)
Table 41 Europe ELearning Revenue (USD Million) By Type (2023-2030)
Table 42 Europe ELearning Revenue (USD Million) By Applications (2023-2030)
Table 43 Asia Pacific ELearning Revenue (USD Million) By Country (2023-2030)
Table 44 Asia Pacific ELearning Revenue (USD Million) By Type (2023-2030)
Table 45 Asia Pacific ELearning Revenue (USD Million) By Applications (2023-2030)
Table 46 South America ELearning Revenue (USD Million) By Country (2023-2030)
Table 47 South America ELearning Revenue (USD Million) By Type (2023-2030)
Table 48 South America ELearning Revenue (USD Million) By Applications (2023-2030)
Table 49 Middle East and Africa ELearning Revenue (USD Million) By Region (2023-2030)
Table 50 Middle East and Africa ELearning Revenue (USD Million) By Region (2023-2030)
Table 51 Middle East and Africa ELearning Revenue (USD Million) By Type (2023-2030)
Table 52 Middle East and Africa ELearning Revenue (USD Million) By Applications (2023-2030)
Table 53 Research Programs/Design for This Report
Table 54 Key Data Information from Secondary Sources
Table 55 Key Data Information from Primary Sources
List of Figures
Figure 1 Market Scope
Figure 2 Porter’s Five Forces
Figure 3 Global ELearning Revenue (USD Million) By Type (2018-2022)
Figure 4 Global ELearning Revenue Market Share (%) By Type (2022)
Figure 5 Global ELearning Revenue (USD Million) By Applications (2018-2022)
Figure 6 Global ELearning Revenue Market Share (%) By Applications (2022)
Figure 7 Global ELearning Market Revenue (USD Million) By Regions (2018-2022)
Figure 8 Global ELearning Market Share (%) By Regions (2022)
Figure 9 North America ELearning Revenue (USD Million) By Country (2018-2022)
Figure 10 North America ELearning Revenue (USD Million) By Type (2018-2022)
Figure 11 North America ELearning Revenue (USD Million) By Applications (2018-2022)
Figure 12 Europe ELearning Revenue (USD Million) By Country (2018-2022)
Figure 13 Europe ELearning Revenue (USD Million) By Type (2018-2022)
Figure 14 Europe ELearning Revenue (USD Million) By Applications (2018-2022)
Figure 15 Asia Pacific ELearning Revenue (USD Million) By Country (2018-2022)
Figure 16 Asia Pacific ELearning Revenue (USD Million) By Type (2018-2022)
Figure 17 Asia Pacific ELearning Revenue (USD Million) By Applications (2018-2022)
Figure 18 South America ELearning Revenue (USD Million) By Country (2018-2022)
Figure 19 South America ELearning Revenue (USD Million) By Type (2018-2022)
Figure 20 South America ELearning Revenue (USD Million) By Applications (2018-2022)
Figure 21 Middle East and Africa ELearning Revenue (USD Million) By Region (2018-2022)
Figure 22 Middle East and Africa ELearning Revenue (USD Million) By Type (2018-2022)
Figure 23 Middle East and Africa ELearning Revenue (USD Million) By Applications (2018-2022)
Figure 24 Global ELearning Revenue (USD Million) By Type (2023-2030)
Figure 25 Global ELearning Revenue Market Share (%) By Type (2030)
Figure 26 Global ELearning Revenue (USD Million) By Applications (2023-2030)
Figure 27 Global ELearning Revenue Market Share (%) By Applications (2030)
Figure 28 Global ELearning Market Revenue (USD Million) By Regions (2023-2030)
Figure 29 North America ELearning Revenue (USD Million) By Country (2023-2030)
Figure 30 North America ELearning Revenue (USD Million) By Type (2023-2030)
Figure 31 North America ELearning Revenue (USD Million) By Applications (2023-2030)
Figure 32 Europe ELearning Revenue (USD Million) By Country (2023-2030)
Figure 33 Europe ELearning Revenue (USD Million) By Type (2023-2030)
Figure 34 Europe ELearning Revenue (USD Million) By Applications (2023-2030)
Figure 35 Asia Pacific ELearning Revenue (USD Million) By Country (2023-2030)
Figure 36 Asia Pacific ELearning Revenue (USD Million) By Type (2023-2030)
Figure 37 Asia Pacific ELearning Revenue (USD Million) By Applications (2023-2030)
Figure 38 South America ELearning Revenue (USD Million) By Country (2023-2030)
Figure 39 South America ELearning Revenue (USD Million) By Type (2023-2030)
Figure 40 South America ELearning Revenue (USD Million) By Applications (2023-2030)
Figure 41 Middle East and Africa ELearning Revenue (USD Million) By Region (2023-2030)
Figure 42 Middle East and Africa ELearning Revenue (USD Million) By Region (2023-2030)
Figure 43 Middle East and Africa ELearning Revenue (USD Million) By Type (2023-2030)
Figure 44 Middle East and Africa ELearning Revenue (USD Million) By Applications (2023-2030)
Figure 45 Bottom-Up and Top-Down Approaches for This Report
Figure 46 Data Triangulation
