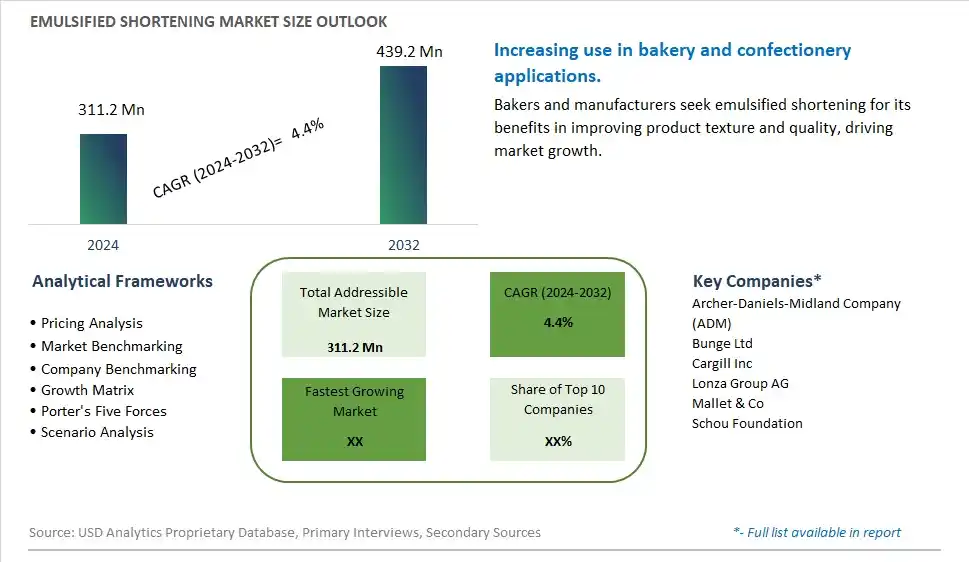
Global Emulsified Shortening Market Size is valued at $311.2 Million in 2024 and is forecast to register a growth rate (CAGR) of 4.4% to reach $439.2 Million by 2032.
The global Emulsified Shortening Market Comprehensive Study analyzes and forecasts the market size across 6 regions and 24 countries for diverse segments -By Form (Dry, Powder, Pellets, Liquid), By Source (Plant-based, Animal-based), By End-User (Food Processing, Bakery, Confectionery, Dairy, Desserts, Foodservice, Household), By Sales Channel (B2B, B2C, -Hypermarkets/ Supermarkets, -Convenience Stores, -Specialty Stores, -Online Retailers)
An Introduction to Emulsified Shortening Market
The emulsified shortening market in 2024 is expanding rapidly, driven by the demand for versatile and functional fats used in baking and food manufacturing. Emulsified shortening, which blends fat with emulsifiers, improves texture, volume, and shelf life in baked goods and frostings. The market benefits from innovations in fat processing and emulsification technologies that enhance product performance and stability. The trend towards clean label and natural ingredients is influencing product development. Increasing consumer interest in high-quality baked goods and the popularity of artisanal and specialty baking ingredients are further propelling market growth.
Emulsified Shortening Competitive Landscape
The market report analyses the leading companies in the industry including Archer-Daniels-Midland Company (ADM), Bunge Ltd, Cargill Inc, Lonza Group AG, Mallet & Co, Schou Foundation, and Others.
Emulsified Shortening Market Dynamics
Emulsified Shortening Market Trend: Growing Use in Bakery and Confectionery Products
The most prominent trend in the Emulsified Shortening Market is the growing use in bakery and confectionery products. Emulsified shortening, known for improving texture and shelf life, is being increasingly incorporated into baked goods and sweets. This trend is driven by the demand for high-quality and consistent bakery products.
Emulsified Shortening Market Driver: Convenience and Quality Enhancement
A key driver in the Emulsified Shortening Market is convenience and the enhancement of product quality. As more bakery manufacturers seek to improve the texture and longevity of their products, there is a rising demand for emulsified shortening that provides stability and consistency. This demand supports market growth as producers aim to meet consumer expectations for high-quality baked goods.
Emulsified Shortening Market Opportunity: Innovation in Healthier Formulations
One significant opportunity in the Emulsified Shortening Market lies in innovation in healthier formulations. Companies can develop new emulsified shortening products that reduce trans fats and include healthier oils, catering to health-conscious consumers. By offering diverse and health-focused shortening options, manufacturers can attract a broader consumer base and drive market growth.
Emulsified Shortening Market Share Analysis- Largest Segment by Form
In the Emulsified Shortening Market, the Liquid form is the largest segment. Liquid emulsified shortening is widely used in food processing and baking due to its easy incorporation into various recipes and its ability to enhance the texture and shelf life of baked goods. Its liquid state allows for seamless blending with other ingredients, making it ideal for large-scale food production and industrial applications. The preference for liquid forms in both commercial and industrial settings, coupled with its functionality in improving product consistency and quality, establishes it as the dominant form in the emulsified shortening market.
Emulsified Shortening Market Share Analysis- Poised to Grow Fastest Over the Next Five Years by Source
The Plant-Based source segment in the Emulsified Shortening Market is poised to grow the fastest over the next five years. The shift towards plant-based ingredients is driven by increasing consumer demand for healthier and more sustainable food options. Plant-based emulsified shortenings are perceived as healthier alternatives to animal-based products, aligning with the growing trend towards vegetarianism and veganism. Additionally, plant-based shortenings offer benefits such as reduced cholesterol levels and a lower environmental impact, which are appealing to both consumers and manufacturers. This trend supports the rapid growth of the plant-based segment in the emulsified shortening market.
Emulsified Shortening Market Share Analysis- Largest Segment by End-User
In the Emulsified Shortening Market, the Food Processing end-user segment is the largest. This segment encompasses a broad range of applications, including bakery products, confectionery, and snack foods, where emulsified shortening is used to enhance texture, flavor, and shelf life. The food processing industry relies heavily on emulsified shortening for its functional properties, which are essential for maintaining product quality and consistency. The extensive use of emulsified shortening across various food categories and the continuous innovation in product formulations contribute to its dominance as the largest end-user segment in the market.
Emulsified Shortening Market Share Analysis- Poised to Grow Fastest Over the Next Five Years by Sales Channel
The Online Retailers sales channel in the Emulsified Shortening Market is poised to grow the fastest over the next five years. This growth is driven by the increasing consumer preference for online shopping due to its convenience and accessibility. The rise of e-commerce platforms has made it easier for both businesses and consumers to access a wide range of products, including specialized ingredients like emulsified shortening. Online retailers offer competitive pricing, a broad selection, and flexible delivery options, which attract both small and large-scale buyers. Additionally, the growth of digital marketing and online promotions enhances the visibility of emulsified shortening products, contributing to their increased adoption through online channels.
Emulsified Shortening Market Segmentation
By Form
Dry
Powder
Pellets
Liquid
By Source
Plant-based
Animal-based
By End-User
Food Processing
Bakery
Confectionery
Dairy
Desserts
Foodservice
Household
By Sales Channel
B2B
B2C
-Hypermarkets/ Supermarkets
-Convenience Stores
-Specialty Stores
-Online Retailers
Countries Analyzed
North America (US, Canada, Mexico)
Europe (Germany, UK, France, Spain, Italy, Russia, Rest of Europe)
Asia Pacific (China, India, Japan, South Korea, Australia, South East Asia, Rest of Asia)
South America (Brazil, Argentina, Rest of South America)
Middle East and Africa (Saudi Arabia, UAE, Rest of Middle East, South Africa, Egypt, Rest of Africa)
Emulsified Shortening Companies Profiled in the Study
Archer-Daniels-Midland Company (ADM)
Bunge Ltd
Cargill Inc
Lonza Group AG
Mallet & Co
Schou Foundation
*- List Not Exhaustive
Chapter 1. TABLE OF CONTENTS
Chapter 2. Introduction to Emulsified Shortening Market
2.1. Market Overview
2.2. Key Statistics and Report Highlights
2.3. Scope of the Comprehensive Study
2.3.1. Market Definition
2.3.2 Countries and Regions Covered
2.3.3 Research Objective
2.3.4 Units, Currency, and Conversions
2.3.5 Industry Value Chain
2.4. Key Market Segments
2.5. Key Companies
2.6. Study Period
Chapter 3. Strategic Analysis Review
3.1. Emulsified Shortening Pricing Analysis and Forecast
3.2. Porter’s Five Forces
3.3. Market Ecosystem
3.4. SWOT Analysis
3.5. Regulatory Scenario
3.3. Effects of Inflation, Russia-Ukraine War, moderating economic growth, and other macroeconomic factors
Chapter 4. Competitive Landscape
4.1. Market Share Analysis
4.1.1. Global Emulsified Shortening Market Share by Company, 2023
4.1.2. Product Offerings of Leading Emulsified Shortening Companies
4.2. Market Entropy
4.2.1. New Product Launches in the Industry
4.2.2. Mergers, Acquisitions, Joint ventures, and Partnerships
4.3. Key Strategies and Best Practices
Chapter 5. Global Market Projections: Best, Reference, and Low Case Scenarios
5.1. Growth Analysis- Case Scenario Definitions
5.2. Low Growth Case Scenario Forecasts
5.3. Reference Growth Case Scenario Forecasts
5.4. High Growth Case Scenario Forecasts
Chapter 6. Market Dynamics
6.1. Emulsified Shortening Market Drivers
6.2. Emulsified Shortening Market Challenges
6.6. Emulsified Shortening Market Opportunities
6.4. Emulsified Shortening Market Trends
Chapter 7. Global Emulsified Shortening Market Outlook Trends
7.1. Global Emulsified Shortening Revenue (USD Million) and CAGR (%) by Type (2021-2032)
7.2. Global Emulsified Shortening Revenue (USD Million) and CAGR (%) by Application (2021-2032)
7.3. Global Emulsified Shortening Revenue (USD Million) and CAGR (%) by Product (2021-2032)
By Form
Dry
Powder
Pellets
Liquid
By Source
Plant-based
Animal-based
By End-User
Food Processing
Bakery
Confectionery
Dairy
Desserts
Foodservice
Household
By Sales Channel
B2B
B2C
-Hypermarkets/ Supermarkets
-Convenience Stores
-Specialty Stores
-Online Retailers
Chapter 8. Global Emulsified Shortening Regional Analysis and Outlook
8.1. Global Emulsified Shortening Revenue (USD Million) By Regions (2021- 2032)
8.2. North America Emulsified Shortening Revenue (USD Million) by Country (2021-2032)
8.2.1. United States Emulsified Shortening Regional Analysis and Outlook
8.2.2. Canada Emulsified Shortening Regional Analysis and Outlook
8.2.3. Mexico Emulsified Shortening Regional Analysis and Outlook
8.3. Europe Emulsified Shortening Revenue (USD Million), by Country (2021-2032)
8.3.1. Germany Emulsified Shortening Regional Analysis and Outlook
8.3.2. France Emulsified Shortening Regional Analysis and Outlook
8.3.3. United Kingdom Emulsified Shortening Regional Analysis and Outlook
8.3.4. Spain Emulsified Shortening Regional Analysis and Outlook
8.3.5. Italy Emulsified Shortening Regional Analysis and Outlook
8.3.6. Russia Emulsified Shortening Regional Analysis and Outlook
8.3.7. Rest of Europe Emulsified Shortening Regional Analysis and Outlook
8.4. Asia Pacific Emulsified Shortening Revenue (USD Million) by Country (2021-2032)
8.4.1. China Emulsified Shortening Regional Analysis and Outlook
8.4.2. Japan Emulsified Shortening Regional Analysis and Outlook
8.4.3. India Emulsified Shortening Regional Analysis and Outlook
8.4.4. South Korea Emulsified Shortening Regional Analysis and Outlook
8.4.5. Australia Emulsified Shortening Regional Analysis and Outlook
8.4.6. South East Asia Emulsified Shortening Regional Analysis and Outlook
8.4.7. Rest of Asia Pacific Emulsified Shortening Regional Analysis and Outlook
8.5. South America Emulsified Shortening Revenue (USD Million), by Country (2021-2032)
8.5.1. Brazil Emulsified Shortening Regional Analysis and Outlook
8.5.2. Argentina Emulsified Shortening Regional Analysis and Outlook
8.5.3. Rest of South America Emulsified Shortening Regional Analysis and Outlook
8.6. Middle East and Africa Emulsified Shortening Revenue (USD Million) by Country (2021-2032)
8.6.1. Middle East Emulsified Shortening Regional Analysis and Outlook
8.6.2. Africa Emulsified Shortening Regional Analysis and Outlook
Chapter 9. North America Emulsified Shortening Analysis and Outlook
9.1. North America Emulsified Shortening Revenue (USD Million) by Segments (2021-2032)
9.1.1. North America Emulsified Shortening Revenue (USD Million) by Type (2021-2032)
9.1.2. North America Emulsified Shortening Revenue (USD Million) by Application (2021-2032)
9.1.3. North America Emulsified Shortening Revenue (USD Million) by Product (2021-2032)
By Form
Dry
Powder
Pellets
Liquid
By Source
Plant-based
Animal-based
By End-User
Food Processing
Bakery
Confectionery
Dairy
Desserts
Foodservice
Household
By Sales Channel
B2B
B2C
-Hypermarkets/ Supermarkets
-Convenience Stores
-Specialty Stores
-Online Retailers
Chapter 10. Europe Emulsified Shortening Analysis and Outlook
10.1. Europe Emulsified Shortening Revenue (USD Million), by Segments (USD Million) (2021-2032)
10.1.1. Europe Emulsified Shortening Revenue (USD Million) by Type (2021-2032)
10.1.2. Europe Emulsified Shortening Revenue (USD Million) by Application (2021-2032)
10.1.3. Europe Emulsified Shortening Revenue (USD Million) by Product (2021-2032)
By Form
Dry
Powder
Pellets
Liquid
By Source
Plant-based
Animal-based
By End-User
Food Processing
Bakery
Confectionery
Dairy
Desserts
Foodservice
Household
By Sales Channel
B2B
B2C
-Hypermarkets/ Supermarkets
-Convenience Stores
-Specialty Stores
-Online Retailers
Chapter 11. Asia Pacific Emulsified Shortening Analysis and Outlook
11.1. Asia Pacific Emulsified Shortening Revenue (USD Million), and Revenue (USD Million) by Segments (2021-2032)
11.1.1. Asia Pacific Emulsified Shortening Revenue (USD Million) by Type (2021-2032)
11.1.2. Asia Pacific Emulsified Shortening Revenue (USD Million) by Application (2021-2032)
11.1.3. Asia Pacific Emulsified Shortening Revenue (USD Million) by Product (2021-2032)
By Form
Dry
Powder
Pellets
Liquid
By Source
Plant-based
Animal-based
By End-User
Food Processing
Bakery
Confectionery
Dairy
Desserts
Foodservice
Household
By Sales Channel
B2B
B2C
-Hypermarkets/ Supermarkets
-Convenience Stores
-Specialty Stores
-Online Retailers
Chapter 12. South America Emulsified Shortening Analysis and Outlook
12.1. South America Emulsified Shortening Revenue (USD Million), by Segments (2021-2032)
12.1.1. South America Emulsified Shortening Revenue (USD Million) by Type (2021-2032)
12.1.2. South America Emulsified Shortening Revenue (USD Million) by Application (2021-2032)
12.1.3. South America Emulsified Shortening Revenue (USD Million) by Product (2021-2032)
By Form
Dry
Powder
Pellets
Liquid
By Source
Plant-based
Animal-based
By End-User
Food Processing
Bakery
Confectionery
Dairy
Desserts
Foodservice
Household
By Sales Channel
B2B
B2C
-Hypermarkets/ Supermarkets
-Convenience Stores
-Specialty Stores
-Online Retailers
Chapter 13. Middle East and Africa Emulsified Shortening Analysis and Outlook
13.1. Middle East and Africa Emulsified Shortening Revenue (USD Million), by Segments (2021-2032)
13.1.1. Middle East and Africa Emulsified Shortening Revenue (USD Million) by Type (2021-2032)
13.1.2. Middle East and Africa Emulsified Shortening Revenue (USD Million) by Application (2021-2032)
13.1.3. Middle East and Africa Emulsified Shortening Revenue (USD Million) by Product (2021-2032)
By Form
Dry
Powder
Pellets
Liquid
By Source
Plant-based
Animal-based
By End-User
Food Processing
Bakery
Confectionery
Dairy
Desserts
Foodservice
Household
By Sales Channel
B2B
B2C
-Hypermarkets/ Supermarkets
-Convenience Stores
-Specialty Stores
-Online Retailers
Chapter 14. Emulsified Shortening Company Profiles
14.1 Business Overview
14.2 Product Profiles
14.3 SWOT Profiles
14.5 Recent Developments
14.6 Financial Profile
List of Companies
Archer-Daniels-Midland Company (ADM)
Bunge Ltd
Cargill Inc
Lonza Group AG
Mallet & Co
Schou Foundation
15. Methodology and Data Sources
15.1 Customization Offerings
15.2 Subscription Services
15.3 Related Reports
15.4 Publisher Expertise
LIST OF TABLES
Table 1 Market Segmentation Analysis
Table 2 Global Emulsified Shortening Market Share of Leading Companies, 2023
Table 3 Product Offerings of Leading Companies
Table 4 Low Growth Scenario Forecasts
Table 5 Reference Case Growth Scenario
Table 6 High Growth Case Scenario
Table 7 Global Emulsified Shortening Revenue (USD Million) And CAGR (%) By Type (2021-2032)
Table 8 Global Emulsified Shortening Revenue (USD Million) And CAGR (%) By Application (2021-2032)
Table 9 Global Emulsified Shortening Revenue (USD Million) And CAGR (%) By Product (2021-2032)
Table 10 Global Emulsified Shortening Market Revenue (USD Million) By Regions (2021-2032)
Table 11 Global Emulsified Shortening Market Share (%) By Regions (2021-2032)
Table 12 North America Emulsified Shortening Revenue (USD Million) By Country (2021-2032)
Table 13 Europe Emulsified Shortening Revenue (USD Million) By Country (2021-2032)
Table 14 Asia Pacific Emulsified Shortening Revenue (USD Million) By Country (2021-2032)
Table 15 South America Emulsified Shortening Revenue (USD Million) By Country (2021-2032)
Table 16 Middle East and Africa Emulsified Shortening Revenue (USD Million) By Region (2021-2032)
Table 17 North America Emulsified Shortening Revenue (USD Million) By Type (2021-2032)
Table 18 North America Emulsified Shortening Revenue (USD Million) By Application (2021-2032)
Table 19 North America Emulsified Shortening Revenue (USD Million) By Product (2021-2032)
Table 20 Europe Emulsified Shortening Revenue (USD Million) By Type (2021-2032)
Table 21 Europe Emulsified Shortening Revenue (USD Million) By Application (2021-2032)
Table 22 Europe Emulsified Shortening Revenue (USD Million) By Product (2021-2032)
Table 23 Asia Pacific Emulsified Shortening Revenue (USD Million) By Type (2021-2032)
Table 24 Asia Pacific Emulsified Shortening Revenue (USD Million) By Application (2021-2032)
Table 25 Asia Pacific Emulsified Shortening Revenue (USD Million) By Product (2021-2032)
Table 26 South America Emulsified Shortening Revenue (USD Million) By Type (2021-2032)
Table 27 South America Emulsified Shortening Revenue (USD Million) By Application (2021-2032)
Table 28 South America Emulsified Shortening Revenue (USD Million) By Product (2021-2032)
Table 29 Middle East and Africa Emulsified Shortening Revenue (USD Million) By Type (2021-2032)
Table 30 Middle East and Africa Emulsified Shortening Revenue (USD Million) By Application (2021-2032)
Table 31 Middle East and Africa Emulsified Shortening Revenue (USD Million) By Product (2021-2032)
LIST OF FIGURES
Figure 1. Market Scope
Figure 2. Pricing Forecasts Per Unit, 2023- 2032
Figure 3. Porter’s Five Forces
Figure 4. Global Emulsified Shortening Market Revenue (USD Million) By Regions (2021-2032)
Figure 5. Global Emulsified Shortening Market Share (%) By Regions (2023)
Figure 6. North America Emulsified Shortening Revenue (USD Million) By Country (2021-2032)
Figure 7. United States Emulsified Shortening Revenue (USD Million) By Country (2021-2032)
Figure 8. Canada Emulsified Shortening Revenue (USD Million) By Country (2021-2032)
Figure 9. Mexico Emulsified Shortening Revenue (USD Million) By Country (2021-2032)
Figure 10. Europe Emulsified Shortening Revenue (USD Million) By Country (2021-2032)
Figure 11. Germany Emulsified Shortening Revenue (USD Million) By Country (2021-2032)
Figure 12. France Emulsified Shortening Revenue (USD Million) By Country (2021-2032)
Figure 13. United Kingdom Emulsified Shortening Revenue (USD Million) By Country (2021-2032)
Figure 14. Spain Emulsified Shortening Revenue (USD Million) By Country (2021-2032)
Figure 15. Italy Emulsified Shortening Revenue (USD Million) By Country (2021-2032)
Figure 16. Russia Emulsified Shortening Revenue (USD Million) By Country (2021-2032)
Figure 17. Rest of Europe Emulsified Shortening Revenue (USD Million) By Country (2021-2032)
Figure 11. Asia Pacific Emulsified Shortening Revenue (USD Million) By Country (2021-2032)
Figure 12. China Emulsified Shortening Revenue (USD Million) By Country (2021-2032)
Figure 13. Japan Emulsified Shortening Revenue (USD Million) By Country (2021-2032)
Figure 14. India Emulsified Shortening Revenue (USD Million) By Country (2021-2032)
Figure 15. South Korea Emulsified Shortening Revenue (USD Million) By Country (2021-2032)
Figure 16. Australia Emulsified Shortening Revenue (USD Million) By Country (2021-2032)
Figure 17. South East Asia Emulsified Shortening Revenue (USD Million) By Country (2021-2032)
Figure 18. South America Emulsified Shortening Revenue (USD Million) By Country (2021-2032)
Figure 19. Brazil Emulsified Shortening Revenue (USD Million) By Country (2021-2032)
Figure 20. Argentina Emulsified Shortening Revenue (USD Million) By Country (2021-2032)
Figure 21. Rest of Asia Pacific Emulsified Shortening Revenue (USD Million) By Country (2021-2032)
Figure 22. Middle East and Africa Emulsified Shortening Revenue (USD Million) By Region (2021-2032)
Figure 23. Saudi Arabia Emulsified Shortening Revenue (USD Million) By Region (2021-2032)
Figure 24. The UAE Emulsified Shortening Revenue (USD Million) By Region (2021-2032)
Figure 25. Rest of Middle East Emulsified Shortening Revenue (USD Million) By Region (2021-2032)
Figure 26. South Africa Emulsified Shortening Revenue (USD Million) By Region (2021-2032)
Figure 27. Africa Emulsified Shortening Revenue (USD Million) By Region (2021-2032)
Figure 28. North America Emulsified Shortening Revenue (USD Million) By Type (2021-2032)
Figure 29. North America Emulsified Shortening Revenue (USD Million) By Application (2021-2032)
Figure 30. North America Emulsified Shortening Revenue (USD Million) By Product (2021-2032)
Figure 31. Europe Emulsified Shortening Revenue (USD Million) By Type (2021-2032)
Figure 32. Europe Emulsified Shortening Revenue (USD Million) By Application (2021-2032)
Figure 33. Europe Emulsified Shortening Revenue (USD Million) By Product (2021-2032)
Figure 34. Asia Pacific Emulsified Shortening Revenue (USD Million) By Type (2021-2032)
Figure 35. Asia Pacific Emulsified Shortening Revenue (USD Million) By Application (2021-2032)
Figure 36. Asia Pacific Emulsified Shortening Revenue (USD Million) By Product (2021-2032)
Figure 37. South America Emulsified Shortening Revenue (USD Million) By Type (2021-2032)
Figure 38. South America Emulsified Shortening Revenue (USD Million) By Application (2021-2032)
Figure 39. South America Emulsified Shortening Revenue (USD Million) By Product (2021-2032)
Figure 40. Middle East and Africa Emulsified Shortening Revenue (USD Million) By Type (2021-2032)
Figure 41. Middle East and Africa Emulsified Shortening Revenue (USD Million) By Application (2021-2032)
Figure 42. Middle East and Africa Emulsified Shortening Revenue (USD Million) By Product (2021-2032)
By Form
Dry
Powder
Pellets
Liquid
By Source
Plant-based
Animal-based
By End-User
Food Processing
Bakery
Confectionery
Dairy
Desserts
Foodservice
Household
By Sales Channel
B2B
B2C
-Hypermarkets/ Supermarkets
-Convenience Stores
-Specialty Stores
-Online Retailers
Countries Analyzed
North America (US, Canada, Mexico)
Europe (Germany, UK, France, Spain, Italy, Russia, Rest of Europe)
Asia Pacific (China, India, Japan, South Korea, Australia, South East Asia, Rest of Asia)
South America (Brazil, Argentina, Rest of South America)
Middle East and Africa (Saudi Arabia, UAE, Rest of Middle East, South Africa, Egypt, Rest of Africa)
