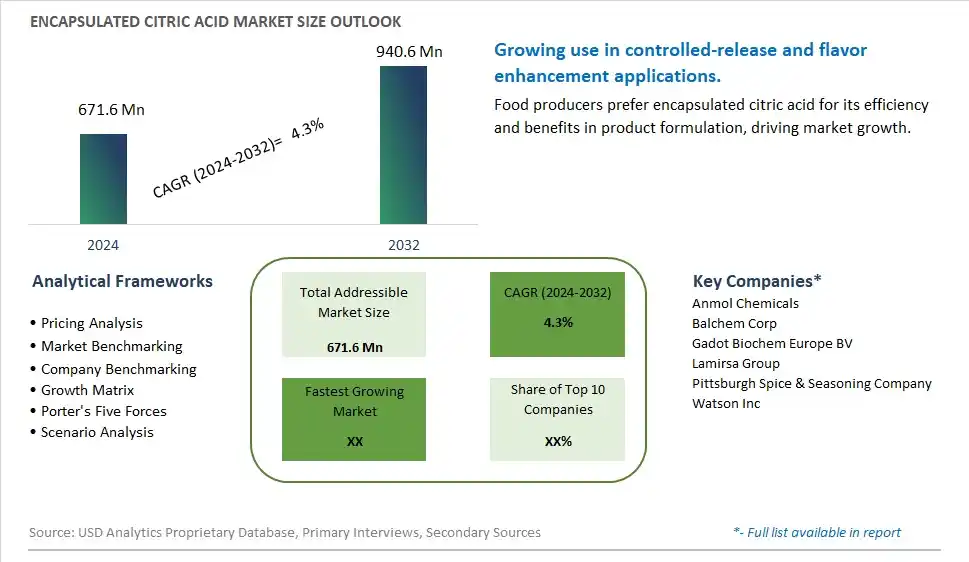
Global Encapsulated Citric Acid Market Size is valued at $671.6 Million in 2024 and is forecast to register a growth rate (CAGR) of 4.3% to reach $940.6 Million by 2032.
The global Encapsulated Citric Acid Market Comprehensive Study analyzes and forecasts the market size across 6 regions and 24 countries for diverse segments -By Type (Polymer Coated, Hydrogenated Vegetable Oil, Palm Oil, Cottonseed Oil, Others), By Application (Food and Beverages, Dietary Supplements, Chemical)
An Introduction to Encapsulated Citric Acid Market
In 2024, the encapsulated citric acid market is thriving, driven by the demand for controlled-release and targeted delivery of citric acid in food and beverage applications. Encapsulated citric acid, which is coated to prevent premature reaction, enhances flavor, preserves freshness, and improves stability in products like candies, beverages, and baked goods. The market benefits from advancements in encapsulation technologies that improve the efficiency and functionality of citric acid. The trend towards clean label and natural ingredients is influencing product development. Increasing consumer interest in shelf-stable and high-quality food products is further propelling market growth.
Encapsulated Citric Acid Competitive Landscape
The market report analyses the leading companies in the industry including Anmol Chemicals, Balchem Corp, Gadot Biochem Europe BV, Lamirsa Group, Pittsburgh Spice & Seasoning Company, Watson Inc, and Others.
Encapsulated Citric Acid Market Dynamics
Encapsulated Citric Acid Market Trend: Increasing Use in Food and Beverage Preservation
The most prominent trend in the Encapsulated Citric Acid Market is the increasing use in food and beverage preservation. Encapsulated citric acid, which provides controlled release of acidity, is gaining popularity as a preservative in various food products. This trend is driven by the demand for longer shelf life and improved product stability.
Encapsulated Citric Acid Market Driver: Health Consciousness and Natural Preservatives
A key driver in the Encapsulated Citric Acid Market is health consciousness and the demand for natural preservatives. As more individuals focus on consuming foods free from synthetic additives, there is a rising demand for encapsulated citric acid that offers a natural solution for food preservation. This demand supports market growth as consumers seek healthier and more natural food options.
Encapsulated Citric Acid Market Opportunity: Expansion into Functional Food Applications
One significant opportunity in the Encapsulated Citric Acid Market lies in expansion into functional food applications. Companies can innovate by developing new products that utilize encapsulated citric acid in various formulations, such as beverages, snacks, and ready-to-eat meals, offering consumers convenient and health-focused options. By highlighting the benefits and versatility of encapsulated citric acid, manufacturers can attract a broader consumer base and drive market growth.
Encapsulated Citric Acid Market Share Analysis- Largest Segment by Type
In the Encapsulated Citric Acid Market, Polymer Coated citric acid is the largest segment. Polymer coating provides enhanced stability and controlled release of citric acid, making it ideal for applications where precise acidification is crucial. This type of encapsulation protects citric acid from environmental factors such as moisture and oxygen, which can degrade its quality. The versatility of polymer-coated citric acid in various applications, including food and beverages, pharmaceuticals, and industrial processes, drives its dominance in the market. The technology's ability to deliver consistent performance and extend shelf life further solidifies its position as the largest segment.
Encapsulated Citric Acid Market Share Analysis- Poised to Grow Fastest Over the Next Five Years by Application
The Food and Beverages application segment in the Encapsulated Citric Acid Market is poised to grow the fastest over the next five years. This growth is attributed to the increasing demand for encapsulated citric acid in food and beverage products to enhance flavor, preserve freshness, and maintain product stability. Encapsulation technology allows for controlled release and targeted delivery of citric acid, which is essential in various food and beverage applications such as confectioneries, dairy products, and beverages. The growing trend of convenience foods and the rising emphasis on product quality and shelf life drive the demand for encapsulated citric acid in this sector, positioning it as the fastest-growing application.
Encapsulated Citric Acid Market Segmentation
By Type
Polymer Coated
Hydrogenated Vegetable Oil
Palm Oil
Cottonseed Oil
Others
By Application
Food and Beverages
Dietary Supplements
Chemical
Countries Analyzed
North America (US, Canada, Mexico)
Europe (Germany, UK, France, Spain, Italy, Russia, Rest of Europe)
Asia Pacific (China, India, Japan, South Korea, Australia, South East Asia, Rest of Asia)
South America (Brazil, Argentina, Rest of South America)
Middle East and Africa (Saudi Arabia, UAE, Rest of Middle East, South Africa, Egypt, Rest of Africa)
Encapsulated Citric Acid Companies Profiled in the Study
Anmol Chemicals
Balchem Corp
Gadot Biochem Europe BV
Lamirsa Group
Pittsburgh Spice & Seasoning Company
Watson Inc
*- List Not Exhaustive
Chapter 1. TABLE OF CONTENTS
Chapter 2. Introduction to Encapsulated Citric Acid Market
2.1. Market Overview
2.2. Key Statistics and Report Highlights
2.3. Scope of the Comprehensive Study
2.3.1. Market Definition
2.3.2 Countries and Regions Covered
2.3.3 Research Objective
2.3.4 Units, Currency, and Conversions
2.3.5 Industry Value Chain
2.4. Key Market Segments
2.5. Key Companies
2.6. Study Period
Chapter 3. Strategic Analysis Review
3.1. Encapsulated Citric Acid Pricing Analysis and Forecast
3.2. Porter’s Five Forces
3.3. Market Ecosystem
3.4. SWOT Analysis
3.5. Regulatory Scenario
3.3. Effects of Inflation, Russia-Ukraine War, moderating economic growth, and other macroeconomic factors
Chapter 4. Competitive Landscape
4.1. Market Share Analysis
4.1.1. Global Encapsulated Citric Acid Market Share by Company, 2023
4.1.2. Product Offerings of Leading Encapsulated Citric Acid Companies
4.2. Market Entropy
4.2.1. New Product Launches in the Industry
4.2.2. Mergers, Acquisitions, Joint ventures, and Partnerships
4.3. Key Strategies and Best Practices
Chapter 5. Global Market Projections: Best, Reference, and Low Case Scenarios
5.1. Growth Analysis- Case Scenario Definitions
5.2. Low Growth Case Scenario Forecasts
5.3. Reference Growth Case Scenario Forecasts
5.4. High Growth Case Scenario Forecasts
Chapter 6. Market Dynamics
6.1. Encapsulated Citric Acid Market Drivers
6.2. Encapsulated Citric Acid Market Challenges
6.6. Encapsulated Citric Acid Market Opportunities
6.4. Encapsulated Citric Acid Market Trends
Chapter 7. Global Encapsulated Citric Acid Market Outlook Trends
7.1. Global Encapsulated Citric Acid Revenue (USD Million) and CAGR (%) by Type (2021-2032)
7.2. Global Encapsulated Citric Acid Revenue (USD Million) and CAGR (%) by Application (2021-2032)
7.3. Global Encapsulated Citric Acid Revenue (USD Million) and CAGR (%) by Product (2021-2032)
By Type
Polymer Coated
Hydrogenated Vegetable Oil
Palm Oil
Cottonseed Oil
Others
By Application
Food and Beverages
Dietary Supplements
Chemical
Chapter 8. Global Encapsulated Citric Acid Regional Analysis and Outlook
8.1. Global Encapsulated Citric Acid Revenue (USD Million) By Regions (2021- 2032)
8.2. North America Encapsulated Citric Acid Revenue (USD Million) by Country (2021-2032)
8.2.1. United States Encapsulated Citric Acid Regional Analysis and Outlook
8.2.2. Canada Encapsulated Citric Acid Regional Analysis and Outlook
8.2.3. Mexico Encapsulated Citric Acid Regional Analysis and Outlook
8.3. Europe Encapsulated Citric Acid Revenue (USD Million), by Country (2021-2032)
8.3.1. Germany Encapsulated Citric Acid Regional Analysis and Outlook
8.3.2. France Encapsulated Citric Acid Regional Analysis and Outlook
8.3.3. United Kingdom Encapsulated Citric Acid Regional Analysis and Outlook
8.3.4. Spain Encapsulated Citric Acid Regional Analysis and Outlook
8.3.5. Italy Encapsulated Citric Acid Regional Analysis and Outlook
8.3.6. Russia Encapsulated Citric Acid Regional Analysis and Outlook
8.3.7. Rest of Europe Encapsulated Citric Acid Regional Analysis and Outlook
8.4. Asia Pacific Encapsulated Citric Acid Revenue (USD Million) by Country (2021-2032)
8.4.1. China Encapsulated Citric Acid Regional Analysis and Outlook
8.4.2. Japan Encapsulated Citric Acid Regional Analysis and Outlook
8.4.3. India Encapsulated Citric Acid Regional Analysis and Outlook
8.4.4. South Korea Encapsulated Citric Acid Regional Analysis and Outlook
8.4.5. Australia Encapsulated Citric Acid Regional Analysis and Outlook
8.4.6. South East Asia Encapsulated Citric Acid Regional Analysis and Outlook
8.4.7. Rest of Asia Pacific Encapsulated Citric Acid Regional Analysis and Outlook
8.5. South America Encapsulated Citric Acid Revenue (USD Million), by Country (2021-2032)
8.5.1. Brazil Encapsulated Citric Acid Regional Analysis and Outlook
8.5.2. Argentina Encapsulated Citric Acid Regional Analysis and Outlook
8.5.3. Rest of South America Encapsulated Citric Acid Regional Analysis and Outlook
8.6. Middle East and Africa Encapsulated Citric Acid Revenue (USD Million) by Country (2021-2032)
8.6.1. Middle East Encapsulated Citric Acid Regional Analysis and Outlook
8.6.2. Africa Encapsulated Citric Acid Regional Analysis and Outlook
Chapter 9. North America Encapsulated Citric Acid Analysis and Outlook
9.1. North America Encapsulated Citric Acid Revenue (USD Million) by Segments (2021-2032)
9.1.1. North America Encapsulated Citric Acid Revenue (USD Million) by Type (2021-2032)
9.1.2. North America Encapsulated Citric Acid Revenue (USD Million) by Application (2021-2032)
9.1.3. North America Encapsulated Citric Acid Revenue (USD Million) by Product (2021-2032)
By Type
Polymer Coated
Hydrogenated Vegetable Oil
Palm Oil
Cottonseed Oil
Others
By Application
Food and Beverages
Dietary Supplements
Chemical
Chapter 10. Europe Encapsulated Citric Acid Analysis and Outlook
10.1. Europe Encapsulated Citric Acid Revenue (USD Million), by Segments (USD Million) (2021-2032)
10.1.1. Europe Encapsulated Citric Acid Revenue (USD Million) by Type (2021-2032)
10.1.2. Europe Encapsulated Citric Acid Revenue (USD Million) by Application (2021-2032)
10.1.3. Europe Encapsulated Citric Acid Revenue (USD Million) by Product (2021-2032)
By Type
Polymer Coated
Hydrogenated Vegetable Oil
Palm Oil
Cottonseed Oil
Others
By Application
Food and Beverages
Dietary Supplements
Chemical
Chapter 11. Asia Pacific Encapsulated Citric Acid Analysis and Outlook
11.1. Asia Pacific Encapsulated Citric Acid Revenue (USD Million), and Revenue (USD Million) by Segments (2021-2032)
11.1.1. Asia Pacific Encapsulated Citric Acid Revenue (USD Million) by Type (2021-2032)
11.1.2. Asia Pacific Encapsulated Citric Acid Revenue (USD Million) by Application (2021-2032)
11.1.3. Asia Pacific Encapsulated Citric Acid Revenue (USD Million) by Product (2021-2032)
By Type
Polymer Coated
Hydrogenated Vegetable Oil
Palm Oil
Cottonseed Oil
Others
By Application
Food and Beverages
Dietary Supplements
Chemical
Chapter 12. South America Encapsulated Citric Acid Analysis and Outlook
12.1. South America Encapsulated Citric Acid Revenue (USD Million), by Segments (2021-2032)
12.1.1. South America Encapsulated Citric Acid Revenue (USD Million) by Type (2021-2032)
12.1.2. South America Encapsulated Citric Acid Revenue (USD Million) by Application (2021-2032)
12.1.3. South America Encapsulated Citric Acid Revenue (USD Million) by Product (2021-2032)
By Type
Polymer Coated
Hydrogenated Vegetable Oil
Palm Oil
Cottonseed Oil
Others
By Application
Food and Beverages
Dietary Supplements
Chemical
Chapter 13. Middle East and Africa Encapsulated Citric Acid Analysis and Outlook
13.1. Middle East and Africa Encapsulated Citric Acid Revenue (USD Million), by Segments (2021-2032)
13.1.1. Middle East and Africa Encapsulated Citric Acid Revenue (USD Million) by Type (2021-2032)
13.1.2. Middle East and Africa Encapsulated Citric Acid Revenue (USD Million) by Application (2021-2032)
13.1.3. Middle East and Africa Encapsulated Citric Acid Revenue (USD Million) by Product (2021-2032)
By Type
Polymer Coated
Hydrogenated Vegetable Oil
Palm Oil
Cottonseed Oil
Others
By Application
Food and Beverages
Dietary Supplements
Chemical
Chapter 14. Encapsulated Citric Acid Company Profiles
14.1 Business Overview
14.2 Product Profiles
14.3 SWOT Profiles
14.5 Recent Developments
14.6 Financial Profile
List of Companies
Anmol Chemicals
Balchem Corp
Gadot Biochem Europe BV
Lamirsa Group
Pittsburgh Spice & Seasoning Company
Watson Inc
15. Methodology and Data Sources
15.1 Customization Offerings
15.2 Subscription Services
15.3 Related Reports
15.4 Publisher Expertise
LIST OF TABLES
Table 1 Market Segmentation Analysis
Table 2 Global Encapsulated Citric Acid Market Share of Leading Companies, 2023
Table 3 Product Offerings of Leading Companies
Table 4 Low Growth Scenario Forecasts
Table 5 Reference Case Growth Scenario
Table 6 High Growth Case Scenario
Table 7 Global Encapsulated Citric Acid Revenue (USD Million) And CAGR (%) By Type (2021-2032)
Table 8 Global Encapsulated Citric Acid Revenue (USD Million) And CAGR (%) By Application (2021-2032)
Table 9 Global Encapsulated Citric Acid Revenue (USD Million) And CAGR (%) By Product (2021-2032)
Table 10 Global Encapsulated Citric Acid Market Revenue (USD Million) By Regions (2021-2032)
Table 11 Global Encapsulated Citric Acid Market Share (%) By Regions (2021-2032)
Table 12 North America Encapsulated Citric Acid Revenue (USD Million) By Country (2021-2032)
Table 13 Europe Encapsulated Citric Acid Revenue (USD Million) By Country (2021-2032)
Table 14 Asia Pacific Encapsulated Citric Acid Revenue (USD Million) By Country (2021-2032)
Table 15 South America Encapsulated Citric Acid Revenue (USD Million) By Country (2021-2032)
Table 16 Middle East and Africa Encapsulated Citric Acid Revenue (USD Million) By Region (2021-2032)
Table 17 North America Encapsulated Citric Acid Revenue (USD Million) By Type (2021-2032)
Table 18 North America Encapsulated Citric Acid Revenue (USD Million) By Application (2021-2032)
Table 19 North America Encapsulated Citric Acid Revenue (USD Million) By Product (2021-2032)
Table 20 Europe Encapsulated Citric Acid Revenue (USD Million) By Type (2021-2032)
Table 21 Europe Encapsulated Citric Acid Revenue (USD Million) By Application (2021-2032)
Table 22 Europe Encapsulated Citric Acid Revenue (USD Million) By Product (2021-2032)
Table 23 Asia Pacific Encapsulated Citric Acid Revenue (USD Million) By Type (2021-2032)
Table 24 Asia Pacific Encapsulated Citric Acid Revenue (USD Million) By Application (2021-2032)
Table 25 Asia Pacific Encapsulated Citric Acid Revenue (USD Million) By Product (2021-2032)
Table 26 South America Encapsulated Citric Acid Revenue (USD Million) By Type (2021-2032)
Table 27 South America Encapsulated Citric Acid Revenue (USD Million) By Application (2021-2032)
Table 28 South America Encapsulated Citric Acid Revenue (USD Million) By Product (2021-2032)
Table 29 Middle East and Africa Encapsulated Citric Acid Revenue (USD Million) By Type (2021-2032)
Table 30 Middle East and Africa Encapsulated Citric Acid Revenue (USD Million) By Application (2021-2032)
Table 31 Middle East and Africa Encapsulated Citric Acid Revenue (USD Million) By Product (2021-2032)
LIST OF FIGURES
Figure 1. Market Scope
Figure 2. Pricing Forecasts Per Unit, 2023- 2032
Figure 3. Porter’s Five Forces
Figure 4. Global Encapsulated Citric Acid Market Revenue (USD Million) By Regions (2021-2032)
Figure 5. Global Encapsulated Citric Acid Market Share (%) By Regions (2023)
Figure 6. North America Encapsulated Citric Acid Revenue (USD Million) By Country (2021-2032)
Figure 7. United States Encapsulated Citric Acid Revenue (USD Million) By Country (2021-2032)
Figure 8. Canada Encapsulated Citric Acid Revenue (USD Million) By Country (2021-2032)
Figure 9. Mexico Encapsulated Citric Acid Revenue (USD Million) By Country (2021-2032)
Figure 10. Europe Encapsulated Citric Acid Revenue (USD Million) By Country (2021-2032)
Figure 11. Germany Encapsulated Citric Acid Revenue (USD Million) By Country (2021-2032)
Figure 12. France Encapsulated Citric Acid Revenue (USD Million) By Country (2021-2032)
Figure 13. United Kingdom Encapsulated Citric Acid Revenue (USD Million) By Country (2021-2032)
Figure 14. Spain Encapsulated Citric Acid Revenue (USD Million) By Country (2021-2032)
Figure 15. Italy Encapsulated Citric Acid Revenue (USD Million) By Country (2021-2032)
Figure 16. Russia Encapsulated Citric Acid Revenue (USD Million) By Country (2021-2032)
Figure 17. Rest of Europe Encapsulated Citric Acid Revenue (USD Million) By Country (2021-2032)
Figure 11. Asia Pacific Encapsulated Citric Acid Revenue (USD Million) By Country (2021-2032)
Figure 12. China Encapsulated Citric Acid Revenue (USD Million) By Country (2021-2032)
Figure 13. Japan Encapsulated Citric Acid Revenue (USD Million) By Country (2021-2032)
Figure 14. India Encapsulated Citric Acid Revenue (USD Million) By Country (2021-2032)
Figure 15. South Korea Encapsulated Citric Acid Revenue (USD Million) By Country (2021-2032)
Figure 16. Australia Encapsulated Citric Acid Revenue (USD Million) By Country (2021-2032)
Figure 17. South East Asia Encapsulated Citric Acid Revenue (USD Million) By Country (2021-2032)
Figure 18. South America Encapsulated Citric Acid Revenue (USD Million) By Country (2021-2032)
Figure 19. Brazil Encapsulated Citric Acid Revenue (USD Million) By Country (2021-2032)
Figure 20. Argentina Encapsulated Citric Acid Revenue (USD Million) By Country (2021-2032)
Figure 21. Rest of Asia Pacific Encapsulated Citric Acid Revenue (USD Million) By Country (2021-2032)
Figure 22. Middle East and Africa Encapsulated Citric Acid Revenue (USD Million) By Region (2021-2032)
Figure 23. Saudi Arabia Encapsulated Citric Acid Revenue (USD Million) By Region (2021-2032)
Figure 24. The UAE Encapsulated Citric Acid Revenue (USD Million) By Region (2021-2032)
Figure 25. Rest of Middle East Encapsulated Citric Acid Revenue (USD Million) By Region (2021-2032)
Figure 26. South Africa Encapsulated Citric Acid Revenue (USD Million) By Region (2021-2032)
Figure 27. Africa Encapsulated Citric Acid Revenue (USD Million) By Region (2021-2032)
Figure 28. North America Encapsulated Citric Acid Revenue (USD Million) By Type (2021-2032)
Figure 29. North America Encapsulated Citric Acid Revenue (USD Million) By Application (2021-2032)
Figure 30. North America Encapsulated Citric Acid Revenue (USD Million) By Product (2021-2032)
Figure 31. Europe Encapsulated Citric Acid Revenue (USD Million) By Type (2021-2032)
Figure 32. Europe Encapsulated Citric Acid Revenue (USD Million) By Application (2021-2032)
Figure 33. Europe Encapsulated Citric Acid Revenue (USD Million) By Product (2021-2032)
Figure 34. Asia Pacific Encapsulated Citric Acid Revenue (USD Million) By Type (2021-2032)
Figure 35. Asia Pacific Encapsulated Citric Acid Revenue (USD Million) By Application (2021-2032)
Figure 36. Asia Pacific Encapsulated Citric Acid Revenue (USD Million) By Product (2021-2032)
Figure 37. South America Encapsulated Citric Acid Revenue (USD Million) By Type (2021-2032)
Figure 38. South America Encapsulated Citric Acid Revenue (USD Million) By Application (2021-2032)
Figure 39. South America Encapsulated Citric Acid Revenue (USD Million) By Product (2021-2032)
Figure 40. Middle East and Africa Encapsulated Citric Acid Revenue (USD Million) By Type (2021-2032)
Figure 41. Middle East and Africa Encapsulated Citric Acid Revenue (USD Million) By Application (2021-2032)
Figure 42. Middle East and Africa Encapsulated Citric Acid Revenue (USD Million) By Product (2021-2032)
By Type
Polymer Coated
Hydrogenated Vegetable Oil
Palm Oil
Cottonseed Oil
Others
By Application
Food and Beverages
Dietary Supplements
Chemical
Countries Analyzed
North America (US, Canada, Mexico)
Europe (Germany, UK, France, Spain, Italy, Russia, Rest of Europe)
Asia Pacific (China, India, Japan, South Korea, Australia, South East Asia, Rest of Asia)
South America (Brazil, Argentina, Rest of South America)
Middle East and Africa (Saudi Arabia, UAE, Rest of Middle East, South Africa, Egypt, Rest of Africa)
