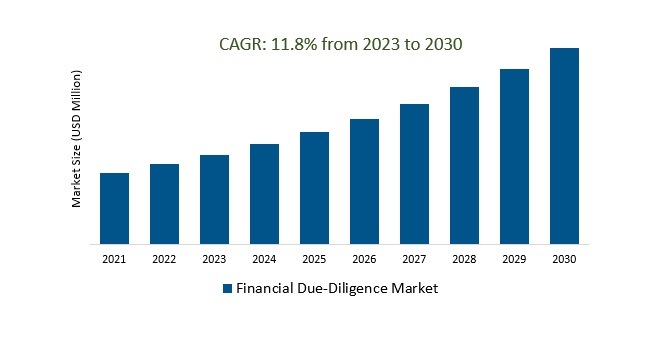
The Global Financial Due-Diligence Market Size is estimated to register 11.8% growth over the forecast period from 2023 to 2030.
The market growth is driven by the increasing awareness of the importance of due diligence among clients, including corporations, financial institutions, and investors, which is a significant driver of market growth. Leading companies that are focused on Increasing M&A Activity, Globalization and Cross-Border Transactions, Regulatory Changes, Environmental, Social, and Governance (ESG) Integration, Sustainability and Green Finance, and others to boost market shares in the industry.
Market Overview
The financial due diligence market involves assessing a company's financial health and risks for purposes such as mergers and acquisitions, investments, and regulatory compliance. Key players include major consulting firms, and services range from financial statement analysis to risk mitigation. Clients are typically corporations, private equity, and investment firms, and due diligence is driven by factors like regulatory compliance, globalization, and technology integration. Trends include ESG integration, expansion into emerging markets, and cybersecurity assessments, with challenges including regulatory changes and increased competition.
Market Dynamics
Market Trends - Financial Due-Diligence Market - Data Analytics and Automation
In the Financial due diligence market, data analytics and automation play a crucial role by streamlining data analysis processes, improving efficiency, and enhancing accuracy. These technologies, including machine learning and advanced algorithms, enable quicker pattern recognition and anomaly detection in financial data, leading to deeper insights. Automation reduces manual tasks, resulting in cost savings and faster project completion. In an evolving business landscape, data analytics and automation are pivotal for meeting the growing demands of speed, accuracy, and comprehensive analysis in financial due diligence.
Market Driver- Cybersecurity Concerns Demand Financial Due-Diligence Market
Cybersecurity concerns are significantly boosting demand in the Financial due diligence market, as organizations prioritize assessing the cybersecurity readiness and vulnerabilities of target companies, particularly in M&A contexts. Evaluating the potential risks and compliance issues related to cyber threats has become a critical aspect of informed decision-making, leading to an adaptation of due diligence practices to incorporate comprehensive cybersecurity assessments.
Market Opportunity-Introduction of Technology Advancements
Technology advancements, including AI, data analytics, automation, and blockchain, are revolutionizing the Financial Due-Diligence market. These technologies streamline processes, automate data analysis, and enhance the accuracy of financial assessments. They offer quicker insights, reduce manual efforts, and lower costs, ultimately improving the efficiency and effectiveness of due diligence activities, which is essential as the market continues to evolve.
Market Share Analysis- The mergers and acquisitions (M&A) The financial Due-Diligence Market will register the fastest growth
The Global Financial Due Diligence Market is analyzed across Mergers and Acquisitions, Investments, and others. Mergers and acquisitions (M&A) are poised to register the fastest growth. The Mergers and Acquisitions (M&A) market is a key driver of the financial diligence market, with due diligence services being vital in assessing a target company's financial health, risks, and compliance to inform M&A decisions. The demand for these services closely mirrors M&A activity, making it a primary growth factor for the financial diligence market. As M&A transactions remain a prominent strategy for business expansion and investment, the demand for due diligence services continues to thrive.
Market Share Analysis- Technology held a significant market share in 2023
The Global Financial Due-Diligence Market is analyzed across various applications including Technology, Healthcare, Manufacturing, and others. Of these, Technology held a significant market share in 2023. Technology, including AI, data analytics, automation, and blockchain, is transforming the Financial due Due-Diligence Market. These innovations streamline processes, automate data analysis, and enhance accuracy, resulting in quicker insights and reduced manual effort and costs. Technology is fundamental in improving the efficiency and effectiveness of due diligence activities as the market evolves.
Financial Due-Diligence Market Segmentation
By Type
- Mergers and Acquisitions
- Investment
- Others
By Application
- Technology
- Healthcare
- Manufacturing
- Others
By Region
- North America (United States, Canada, Mexico)
- Europe (Germany, France, United Kingdom, Spain, Italy, Others)
- Asia Pacific (China, India, Japan, South Korea, Australia, Others)
- Latin America (Brazil, Argentina, Others)
- Middle East and Africa (Saudi Arabia, UAE, Kuwait, Other Middle East, South Africa, Nigeria, Other Africa)
Financial Due-Diligence Market Companies
- Amazon (United States)
- Microsoft Corporation (United States)
- Apple Inc (United States)
- Saudi Aramco (Saudi Arabia)
- Alphabet Inc (United States)
- Alibaba Group Holding Limited (China)
- Tencent Holdings Limited (China)
- JPMorgan Chase & Co (United States)
- Facebook Inc (United States)
- Berkshire Hathaway Inc (United States)
*List not exhaustive
Financial Due-Diligence Market Outlook 2023
1 Market Overview
1.1 Introduction to the Financial Due-Diligence Market
1.2 Scope of the Study
1.3 Research Objective
1.3.1 Key Market Scope and Segments
1.3.2 Players Covered
1.3.3 Years Considered
2 Executive Summary
2.1 2023 Financial Due-Diligence Industry- Market Statistics
3 Market Dynamics
3.1 Market Drivers
3.2 Market Challenges
3.3 Market Opportunities
3.4 Market Trends
4 Market Factor Analysis
4.1 Porter’s Five Forces
4.2 Market Entropy
4.2.1 Global Financial Due-Diligence Market Companies with Area Served
4.2.2 Products Offerings Global Financial Due-Diligence Market
5 COVID-19 Impact Analysis and Outlook Scenarios
5.1.1 Covid-19 Impact Analysis
5.1.2 Post-COVID-19 Scenario- Low Growth Case
5.1.3 Post-COVID-19 Scenario- Reference Growth Case
5.1.4 Post-COVID-19 Scenario- Low Growth Case
6 Global Financial Due-Diligence Market Trends
6.1 Global Financial Due-Diligence Revenue (USD Million) and CAGR (%) by Type (2018-2030)
6.2 Global Financial Due-Diligence Revenue (USD Million) and CAGR (%) by Applications (2018-2030)
6.3 Global Financial Due-Diligence Revenue (USD Million) and CAGR (%) by Regions (2018-2030)
7 Global Financial Due-Diligence Market Revenue (USD Million) by Type, and Applications (2018-2022)
7.1 Global Financial Due-Diligence Revenue (USD Million) by Type (2018-2022)
7.1.1 Global Financial Due-Diligence Revenue (USD Million), Market Share (%) by Type (2018-2022)
7.2 Global Financial Due-Diligence Revenue (USD Million) by Applications (2018-2022)
7.2.1 Global Financial Due-Diligence Revenue (USD Million), Market Share (%) by Applications (2018-2022)
8 Global Financial Due-Diligence Development Regional Status and Outlook
8.1 Global Financial Due-Diligence Revenue (USD Million) By Regions (2018-2022)
8.2 North America Financial Due-Diligence Revenue (USD Million) by Type, and Application (2018-2022)
8.2.1 North America Financial Due-Diligence Revenue (USD Million) by Country (2018-2022)
8.2.2 North America Financial Due-Diligence Revenue (USD Million) by Type (2018-2022)
8.2.3 North America Financial Due-Diligence Revenue (USD Million) by Applications (2018-2022)
8.3 Europe Financial Due-Diligence Revenue (USD Million), by Type, and Applications (USD Million) (2018-2022)
8.3.1 Europe Financial Due-Diligence Revenue (USD Million), by Country (2018-2022)
8.3.2 Europe Financial Due-Diligence Revenue (USD Million) by Type (2018-2022)
8.3.3 Europe Financial Due-Diligence Revenue (USD Million) by Applications (2018-2022)
8.4 Asia Pacific Financial Due-Diligence Revenue (USD Million), and Revenue (USD Million) by Type, and Applications (2018-2022)
8.4.1 Asia Pacific Financial Due-Diligence Revenue (USD Million) by Country (2018-2022)
8.4.2 Asia Pacific Financial Due-Diligence Revenue (USD Million) by Type (2018-2022)
8.4.3 Asia Pacific Financial Due-Diligence Revenue (USD Million) by Applications (2018-2022)
8.5 South America Financial Due-Diligence Revenue (USD Million), by Type, and Applications (2018-2022)
8.5.1 South America Financial Due-Diligence Revenue (USD Million), by Country (2018-2022)
8.5.2 South America Financial Due-Diligence Revenue (USD Million) by Type (2018-2022)
8.5.3 South America Financial Due-Diligence Revenue (USD Million) by Applications (2018-2022)
8.6 Middle East and Africa Financial Due-Diligence Revenue (USD Million), by Type, Technology, Application, Thickness (2018-2022)
8.6.1 Middle East and Africa Financial Due-Diligence Revenue (USD Million) by Country (2018-2022)
8.6.2 Middle East and Africa Financial Due-Diligence Revenue (USD Million) by Type (2018-2022)
8.6.3 Middle East and Africa Financial Due-Diligence Revenue (USD Million) by Applications (2018-2022)
9 Company Profiles
10 Global Financial Due-Diligence Market Revenue (USD Million), by Type, and Applications (2023-2030)
10.1 Global Financial Due-Diligence Revenue (USD Million) and Market Share (%) by Type (2023-2030)
10.1.1 Global Financial Due-Diligence Revenue (USD Million), and Market Share (%) by Type (2023-2030)
10.2 Global Financial Due-Diligence Revenue (USD Million) and Market Share (%) by Applications (2023-2030)
10.2.1 Global Financial Due-Diligence Revenue (USD Million), and Market Share (%) by Applications (2023-2030)
11 Global Financial Due-Diligence Development Regional Status and Outlook Forecast
11.1 Global Financial Due-Diligence Revenue (USD Million) By Regions (2023-2030)
11.2 North America Financial Due-Diligence Revenue (USD Million) by Type, and Applications (2023-2030)
11.2.1 North America Financial Due-Diligence Revenue (USD) Million by Country (2023-2030)
11.2.2 North America Financial Due-Diligence Revenue (USD Million), by Type (2023-2030)
11.2.3 North America Financial Due-Diligence Revenue (USD Million), Market Share (%) by Applications (2023-2030)
11.3 Europe Financial Due-Diligence Revenue (USD Million), by Type, and Applications (2023-2030)
11.3.1 Europe Financial Due-Diligence Revenue (USD Million), by Country (2023-2030)
11.3.2 Europe Financial Due-Diligence Revenue (USD Million), by Type (2023-2030)
11.3.3 Europe Financial Due-Diligence Revenue (USD Million), by Applications (2023-2030)
11.4 Asia Pacific Financial Due-Diligence Revenue (USD Million) by Type, and Applications (2023-2030)
11.4.1 Asia Pacific Financial Due-Diligence Revenue (USD Million), by Country (2023-2030)
11.4.2 Asia Pacific Financial Due-Diligence Revenue (USD Million), by Type (2023-2030)
11.4.3 Asia Pacific Financial Due-Diligence Revenue (USD Million), by Applications (2023-2030)
11.5 South America Financial Due-Diligence Revenue (USD Million), by Type, and Applications (2023-2030)
11.5.1 South America Financial Due-Diligence Revenue (USD Million), by Country (2023-2030)
11.5.2 South America Financial Due-Diligence Revenue (USD Million), by Type (2023-2030)
11.5.3 South America Financial Due-Diligence Revenue (USD Million), by Applications (2023-2030)
11.6 Middle East and Africa Financial Due-Diligence Revenue (USD Million), by Type, and Applications (2023-2030)
11.6.1 Middle East and Africa Financial Due-Diligence Revenue (USD Million), by Region (2023-2030)
11.6.2 Middle East and Africa Financial Due-Diligence Revenue (USD Million), by Type (2023-2030)
11.6.3 Middle East and Africa Financial Due-Diligence Revenue (USD Million), by Applications (2023-2030)
12 Methodology and Data Sources
12.1 Methodology/Research Approach
12.1.1 Research Programs/Design
12.1.2 Market Size Estimation
12.1.3 Market Breakdown and Data Triangulation
12.2 Data Sources
12.2.1 Secondary Sources
12.2.2 Primary Sources
12.3 Disclaimer
List of Tables
Table 1 Market Segmentation Analysis
Table 2 Global Financial Due-Diligence Market Companies with Areas Served
Table 3 Products Offerings Global Financial Due-Diligence Market
Table 4 Low Growth Scenario Forecasts
Table 5 Reference Case Growth Scenario
Table 6 High Growth Case Scenario
Table 7 Global Financial Due-Diligence Revenue (USD Million) And CAGR (%) By Type (2018-2030)
Table 8 Global Financial Due-Diligence Revenue (USD Million) And CAGR (%) By Applications (2018-2030)
Table 9 Global Financial Due-Diligence Revenue (USD Million) And CAGR (%) By Regions (2018-2030)
Table 10 Global Financial Due-Diligence Revenue (USD Million) By Type (2018-2022)
Table 11 Global Financial Due-Diligence Revenue Market Share (%) By Type (2018-2022)
Table 12 Global Financial Due-Diligence Revenue (USD Million) By Applications (2018-2022)
Table 13 Global Financial Due-Diligence Revenue Market Share (%) By Applications (2018-2022)
Table 14 Global Financial Due-Diligence Market Revenue (USD Million) By Regions (2018-2022)
Table 15 Global Financial Due-Diligence Market Share (%) By Regions (2018-2022)
Table 16 North America Financial Due-Diligence Revenue (USD Million) By Country (2018-2022)
Table 17 North America Financial Due-Diligence Revenue (USD Million) By Type (2018-2022)
Table 18 North America Financial Due-Diligence Revenue (USD Million) By Applications (2018-2022)
Table 19 Europe Financial Due-Diligence Revenue (USD Million) By Country (2018-2022)
Table 20 Europe Financial Due-Diligence Revenue (USD Million) By Type (2018-2022)
Table 21 Europe Financial Due-Diligence Revenue (USD Million) By Applications (2018-2022)
Table 22 Asia Pacific Financial Due-Diligence Revenue (USD Million) By Country (2018-2022)
Table 23 Asia Pacific Financial Due-Diligence Revenue (USD Million) By Type (2018-2022)
Table 24 Asia Pacific Financial Due-Diligence Revenue (USD Million) By Applications (2018-2022)
Table 25 South America Financial Due-Diligence Revenue (USD Million) By Country (2018-2022)
Table 26 South America Financial Due-Diligence Revenue (USD Million) By Type (2018-2022)
Table 27 South America Financial Due-Diligence Revenue (USD Million) By Applications (2018-2022)
Table 28 Middle East and Africa Financial Due-Diligence Revenue (USD Million) By Region (2018-2022)
Table 29 Middle East and Africa Financial Due-Diligence Revenue (USD Million) By Type (2018-2022)
Table 30 Middle East and Africa Financial Due-Diligence Revenue (USD Million) By Applications (2018-2022)
Table 31 Financial Analysis
Table 32 Global Financial Due-Diligence Revenue (USD Million) By Type (2023-2030)
Table 33 Global Financial Due-Diligence Revenue Market Share (%) By Type (2023-2030)
Table 34 Global Financial Due-Diligence Revenue (USD Million) By Applications (2023-2030)
Table 35 Global Financial Due-Diligence Revenue Market Share (%) By Applications (2023-2030)
Table 36 Global Financial Due-Diligence Market Revenue (USD Million), And Revenue (USD Million) By Regions (2023-2030)
Table 37 North America Financial Due-Diligence Revenue (USD)By Country (2023-2030)
Table 38 North America Financial Due-Diligence Revenue (USD Million) By Type (2023-2030)
Table 39 North America Financial Due-Diligence Revenue (USD Million) By Applications (2023-2030)
Table 40 Europe Financial Due-Diligence Revenue (USD Million) By Country (2023-2030)
Table 41 Europe Financial Due-Diligence Revenue (USD Million) By Type (2023-2030)
Table 42 Europe Financial Due-Diligence Revenue (USD Million) By Applications (2023-2030)
Table 43 Asia Pacific Financial Due-Diligence Revenue (USD Million) By Country (2023-2030)
Table 44 Asia Pacific Financial Due-Diligence Revenue (USD Million) By Type (2023-2030)
Table 45 Asia Pacific Financial Due-Diligence Revenue (USD Million) By Applications (2023-2030)
Table 46 South America Financial Due-Diligence Revenue (USD Million) By Country (2023-2030)
Table 47 South America Financial Due-Diligence Revenue (USD Million) By Type (2023-2030)
Table 48 South America Financial Due-Diligence Revenue (USD Million) By Applications (2023-2030)
Table 49 Middle East and Africa Financial Due-Diligence Revenue (USD Million) By Region (2023-2030)
Table 50 Middle East and Africa Financial Due-Diligence Revenue (USD Million) By Region (2023-2030)
Table 51 Middle East and Africa Financial Due-Diligence Revenue (USD Million) By Type (2023-2030)
Table 52 Middle East and Africa Financial Due-Diligence Revenue (USD Million) By Applications (2023-2030)
Table 53 Research Programs/Design for This Report
Table 54 Key Data Information from Secondary Sources
Table 55 Key Data Information from Primary Sources
List of Figures
Figure 1 Market Scope
Figure 2 Porter’s Five Forces
Figure 3 Global Financial Due-Diligence Revenue (USD Million) By Type (2018-2022)
Figure 4 Global Financial Due-Diligence Revenue Market Share (%) By Type (2022)
Figure 5 Global Financial Due-Diligence Revenue (USD Million) By Applications (2018-2022)
Figure 6 Global Financial Due-Diligence Revenue Market Share (%) By Applications (2022)
Figure 7 Global Financial Due-Diligence Market Revenue (USD Million) By Regions (2018-2022)
Figure 8 Global Financial Due-Diligence Market Share (%) By Regions (2022)
Figure 9 North America Financial Due-Diligence Revenue (USD Million) By Country (2018-2022)
Figure 10 North America Financial Due-Diligence Revenue (USD Million) By Type (2018-2022)
Figure 11 North America Financial Due-Diligence Revenue (USD Million) By Applications (2018-2022)
Figure 12 Europe Financial Due-Diligence Revenue (USD Million) By Country (2018-2022)
Figure 13 Europe Financial Due-Diligence Revenue (USD Million) By Type (2018-2022)
Figure 14 Europe Financial Due-Diligence Revenue (USD Million) By Applications (2018-2022)
Figure 15 Asia Pacific Financial Due-Diligence Revenue (USD Million) By Country (2018-2022)
Figure 16 Asia Pacific Financial Due-Diligence Revenue (USD Million) By Type (2018-2022)
Figure 17 Asia Pacific Financial Due-Diligence Revenue (USD Million) By Applications (2018-2022)
Figure 18 South America Financial Due-Diligence Revenue (USD Million) By Country (2018-2022)
Figure 19 South America Financial Due-Diligence Revenue (USD Million) By Type (2018-2022)
Figure 20 South America Financial Due-Diligence Revenue (USD Million) By Applications (2018-2022)
Figure 21 Middle East and Africa Financial Due-Diligence Revenue (USD Million) By Region (2018-2022)
Figure 22 Middle East and Africa Financial Due-Diligence Revenue (USD Million) By Type (2018-2022)
Figure 23 Middle East and Africa Financial Due-Diligence Revenue (USD Million) By Applications (2018-2022)
Figure 24 Global Financial Due-Diligence Revenue (USD Million) By Type (2023-2030)
Figure 25 Global Financial Due-Diligence Revenue Market Share (%) By Type (2030)
Figure 26 Global Financial Due-Diligence Revenue (USD Million) By Applications (2023-2030)
Figure 27 Global Financial Due-Diligence Revenue Market Share (%) By Applications (2030)
Figure 28 Global Financial Due-Diligence Market Revenue (USD Million) By Regions (2023-2030)
Figure 29 North America Financial Due-Diligence Revenue (USD Million) By Country (2023-2030)
Figure 30 North America Financial Due-Diligence Revenue (USD Million) By Type (2023-2030)
Figure 31 North America Financial Due-Diligence Revenue (USD Million) By Applications (2023-2030)
Figure 32 Europe Financial Due-Diligence Revenue (USD Million) By Country (2023-2030)
Figure 33 Europe Financial Due-Diligence Revenue (USD Million) By Type (2023-2030)
Figure 34 Europe Financial Due-Diligence Revenue (USD Million) By Applications (2023-2030)
Figure 35 Asia Pacific Financial Due-Diligence Revenue (USD Million) By Country (2023-2030)
Figure 36 Asia Pacific Financial Due-Diligence Revenue (USD Million) By Type (2023-2030)
Figure 37 Asia Pacific Financial Due-Diligence Revenue (USD Million) By Applications (2023-2030)
Figure 38 South America Financial Due-Diligence Revenue (USD Million) By Country (2023-2030)
Figure 39 South America Financial Due-Diligence Revenue (USD Million) By Type (2023-2030)
Figure 40 South America Financial Due-Diligence Revenue (USD Million) By Applications (2023-2030)
Figure 41 Middle East and Africa Financial Due-Diligence Revenue (USD Million) By Region (2023-2030)
Figure 42 Middle East and Africa Financial Due-Diligence Revenue (USD Million) By Region (2023-2030)
Figure 43 Middle East and Africa Financial Due-Diligence Revenue (USD Million) By Type (2023-2030)
Figure 44 Middle East and Africa Financial Due-Diligence Revenue (USD Million) By Applications (2023-2030)
Figure 45 Bottom-Up and Top-Down Approaches For This Report
Figure 46 Data Triangulation
