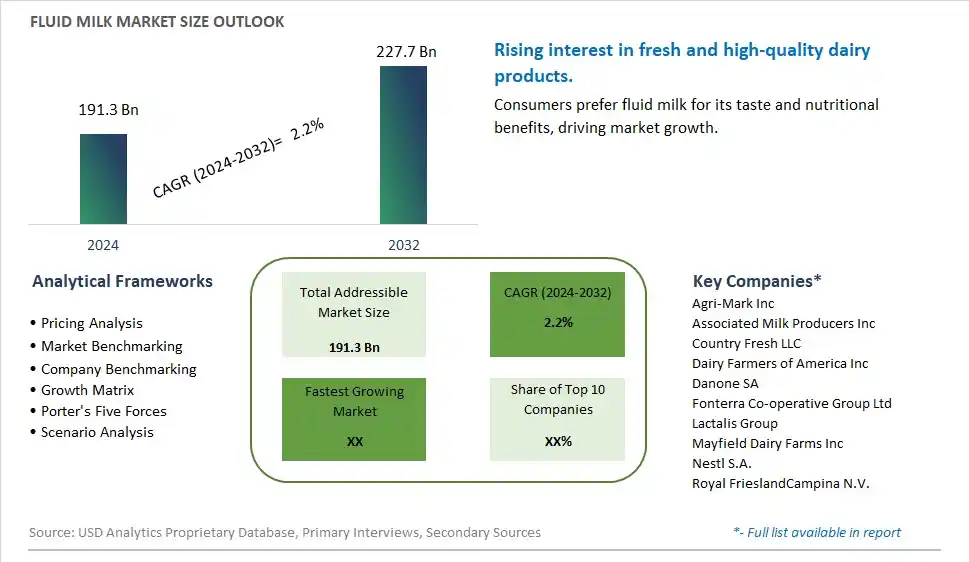
Global Fluid Milk Market Size is valued at $191.3 Billion in 2024 and is forecast to register a growth rate (CAGR) of 2.2% to reach $227.7 Billion by 2032.
The global Fluid Milk Market Comprehensive Study analyzes and forecasts the market size across 6 regions and 24 countries for diverse segments -By Source (Cow Milk, Ship Milk, Goat Milk, Buffalo Milk), By Type (Whole Milk, Low-fat Milk, Reduced-fat Milk, Skim-Milk, Cultured Buttermilk, Lactose-Free Milk, Flavored Milk), By Application (Fortified Milk, Flavored Dairy Drinks, Yoghurts, Cheese, Creams, Frozen Desserts), By Distribution Channel (Hypermarkets/Supermarkets, Food Specialty Stores, Convenience Stores, Others)
An Introduction to Fluid Milk Market
In 2024, the fluid milk market is thriving, fueled by the demand for fresh and nutritious dairy products. Fluid milk, available in various forms such as whole, skim, and flavored, is a staple in many households. The market benefits from advancements in dairy farming, processing, and packaging technologies that enhance product quality, safety, and shelf life. The trend towards clean label and natural ingredients is influencing product development. Increasing consumer interest in high-quality dairy products and the popularity of organic and locally sourced milk are further propelling market growth.
Fluid Milk Competitive Landscape
The market report analyses the leading companies in the industry including Agri-Mark Inc, Associated Milk Producers Inc, Country Fresh LLC, Dairy Farmers of America Inc, Danone SA, Fonterra Co-operative Group Ltd, Lactalis Group, Mayfield Dairy Farms Inc, Nestl S.A., Royal FrieslandCampina N.V., and Others.
Fluid Milk Market Dynamics
Fluid Milk Market Trend: Increasing Demand for Organic and Non-Dairy Alternatives
The most prominent trend in the Fluid Milk Market is the increasing demand for organic and non-dairy alternatives. Consumers are seeking milk products that are free from hormones and antibiotics, and are also exploring plant-based options such as almond, soy, and oat milk. This trend is driven by health concerns and dietary preferences, including lactose intolerance and veganism.
Fluid Milk Market Driver: Health Consciousness and Dietary Preferences
A key driver in the Fluid Milk Market is health consciousness and the shift in dietary preferences. As more individuals focus on consuming natural and minimally processed foods, there is a rising demand for fluid milk that aligns with these values. This demand supports market growth as consumers seek healthier and more ethical milk options.
Fluid Milk Market Opportunity: Innovation in Functional and Fortified Milk Products
One significant opportunity in the Fluid Milk Market lies in innovation in functional and fortified milk products. Companies can develop new products that offer additional health benefits, such as added vitamins, minerals, and probiotics, catering to health-conscious consumers. By offering diverse and health-focused milk options, manufacturers can attract a broader consumer base and drive market growth.
Fluid Milk Market Share Analysis- Largest Segment by Source
In the Fluid Milk Market, Cow Milk is the largest segment. This predominance is due to cow milk's widespread consumption and its availability worldwide. Cow milk is a staple in many diets due to its balanced nutritional profile, including protein, calcium, vitamins, and minerals. It is used in a wide range of dairy products such as cheese, yogurt, and cream, contributing to its dominant position in the market. Additionally, the infrastructure for cow milk production and distribution is well-established globally, making it the most accessible and widely consumed type of milk.
Fluid Milk Market Share Analysis- Poised to Grow Fastest Over the Next Five Years by Type
Lactose-Free Milk is poised to grow the fastest in the Fluid Milk Market over the next five years. This segment's rapid growth can be attributed to the increasing prevalence of lactose intolerance and a growing awareness of dietary restrictions. Lactose-free milk caters to individuals who are unable to digest lactose, a sugar found in regular milk. With the rise in health consciousness and the demand for specialized dietary products, lactose-free milk is gaining popularity among consumers seeking alternatives to traditional dairy products. The continued innovation in lactose-free milk products and improvements in taste and quality are expected to drive this segment's growth.
Fluid Milk Market Share Analysis- Largest Segment by Application
In the Fluid Milk Market, Fortified Milk is the largest segment by application. The high demand for fortified milk is driven by the need to address nutritional deficiencies and improve public health. Fortified milk is enriched with essential vitamins and minerals, such as vitamin D and calcium, which are crucial for bone health and overall well-being. This application is widely adopted in both developed and developing countries to combat issues such as vitamin D deficiency and osteoporosis. The widespread use of fortified milk in schools, institutions, and households contributes to its status as the largest application segment in the fluid milk market.
Fluid Milk Market Share Analysis- Poised to Grow Fastest Over the Next Five Years by Distribution Channel
In the Fluid Milk Market, Online Retailers are poised to grow the fastest over the next five years. The shift towards e-commerce is driven by changing consumer shopping habits, with more people preferring the convenience and safety of online purchases. Online retailers offer a broad range of milk products, including specialty and organic varieties, which may not be available in local stores. The ability to provide doorstep delivery and subscription services for regular milk supply further supports this segment's growth. Additionally, the rise of health-conscious consumers seeking niche milk products online is expected to drive significant growth in the online retail channel.
Fluid Milk Market Segmentation
By Source
Cow Milk
Ship Milk
Goat Milk
Buffalo Milk
By Type
Whole Milk
Low-fat Milk
Reduced-fat Milk
Skim-Milk
Cultured Buttermilk
Lactose-Free Milk
Flavored Milk
By Application
Fortified Milk
Flavored Dairy Drinks
Yoghurts
Cheese
Creams
Frozen Desserts
By Distribution Channel
Hypermarkets/Supermarkets
Food Specialty Stores
Convenience Stores
Others
Countries Analyzed
North America (US, Canada, Mexico)
Europe (Germany, UK, France, Spain, Italy, Russia, Rest of Europe)
Asia Pacific (China, India, Japan, South Korea, Australia, South East Asia, Rest of Asia)
South America (Brazil, Argentina, Rest of South America)
Middle East and Africa (Saudi Arabia, UAE, Rest of Middle East, South Africa, Egypt, Rest of Africa)
Fluid Milk Companies Profiled in the Study
Agri-Mark Inc
Associated Milk Producers Inc
Country Fresh LLC
Dairy Farmers of America Inc
Danone SA
Fonterra Co-operative Group Ltd
Lactalis Group
Mayfield Dairy Farms Inc
Nestl S.A.
Royal FrieslandCampina N.V.
*- List Not Exhaustive
Chapter 1. TABLE OF CONTENTS
Chapter 2. Introduction to Fluid Milk Market
2.1. Market Overview
2.2. Key Statistics and Report Highlights
2.3. Scope of the Comprehensive Study
2.3.1. Market Definition
2.3.2 Countries and Regions Covered
2.3.3 Research Objective
2.3.4 Units, Currency, and Conversions
2.3.5 Industry Value Chain
2.4. Key Market Segments
2.5. Key Companies
2.6. Study Period
Chapter 3. Strategic Analysis Review
3.1. Fluid Milk Pricing Analysis and Forecast
3.2. Porter’s Five Forces
3.3. Market Ecosystem
3.4. SWOT Analysis
3.5. Regulatory Scenario
3.3. Effects of Inflation, Russia-Ukraine War, moderating economic growth, and other macroeconomic factors
Chapter 4. Competitive Landscape
4.1. Market Share Analysis
4.1.1. Global Fluid Milk Market Share by Company, 2023
4.1.2. Product Offerings of Leading Fluid Milk Companies
4.2. Market Entropy
4.2.1. New Product Launches in the Industry
4.2.2. Mergers, Acquisitions, Joint ventures, and Partnerships
4.3. Key Strategies and Best Practices
Chapter 5. Global Market Projections: Best, Reference, and Low Case Scenarios
5.1. Growth Analysis- Case Scenario Definitions
5.2. Low Growth Case Scenario Forecasts
5.3. Reference Growth Case Scenario Forecasts
5.4. High Growth Case Scenario Forecasts
Chapter 6. Market Dynamics
6.1. Fluid Milk Market Drivers
6.2. Fluid Milk Market Challenges
6.6. Fluid Milk Market Opportunities
6.4. Fluid Milk Market Trends
Chapter 7. Global Fluid Milk Market Outlook Trends
7.1. Global Fluid Milk Revenue (USD Million) and CAGR (%) by Type (2021-2032)
7.2. Global Fluid Milk Revenue (USD Million) and CAGR (%) by Application (2021-2032)
7.3. Global Fluid Milk Revenue (USD Million) and CAGR (%) by Product (2021-2032)
By Source
Cow Milk
Ship Milk
Goat Milk
Buffalo Milk
By Type
Whole Milk
Low-fat Milk
Reduced-fat Milk
Skim-Milk
Cultured Buttermilk
Lactose-Free Milk
Flavored Milk
By Application
Fortified Milk
Flavored Dairy Drinks
Yoghurts
Cheese
Creams
Frozen Desserts
By Distribution Channel
Hypermarkets/Supermarkets
Food Specialty Stores
Convenience Stores
Others
Chapter 8. Global Fluid Milk Regional Analysis and Outlook
8.1. Global Fluid Milk Revenue (USD Million) By Regions (2021- 2032)
8.2. North America Fluid Milk Revenue (USD Million) by Country (2021-2032)
8.2.1. United States Fluid Milk Regional Analysis and Outlook
8.2.2. Canada Fluid Milk Regional Analysis and Outlook
8.2.3. Mexico Fluid Milk Regional Analysis and Outlook
8.3. Europe Fluid Milk Revenue (USD Million), by Country (2021-2032)
8.3.1. Germany Fluid Milk Regional Analysis and Outlook
8.3.2. France Fluid Milk Regional Analysis and Outlook
8.3.3. United Kingdom Fluid Milk Regional Analysis and Outlook
8.3.4. Spain Fluid Milk Regional Analysis and Outlook
8.3.5. Italy Fluid Milk Regional Analysis and Outlook
8.3.6. Russia Fluid Milk Regional Analysis and Outlook
8.3.7. Rest of Europe Fluid Milk Regional Analysis and Outlook
8.4. Asia Pacific Fluid Milk Revenue (USD Million) by Country (2021-2032)
8.4.1. China Fluid Milk Regional Analysis and Outlook
8.4.2. Japan Fluid Milk Regional Analysis and Outlook
8.4.3. India Fluid Milk Regional Analysis and Outlook
8.4.4. South Korea Fluid Milk Regional Analysis and Outlook
8.4.5. Australia Fluid Milk Regional Analysis and Outlook
8.4.6. South East Asia Fluid Milk Regional Analysis and Outlook
8.4.7. Rest of Asia Pacific Fluid Milk Regional Analysis and Outlook
8.5. South America Fluid Milk Revenue (USD Million), by Country (2021-2032)
8.5.1. Brazil Fluid Milk Regional Analysis and Outlook
8.5.2. Argentina Fluid Milk Regional Analysis and Outlook
8.5.3. Rest of South America Fluid Milk Regional Analysis and Outlook
8.6. Middle East and Africa Fluid Milk Revenue (USD Million) by Country (2021-2032)
8.6.1. Middle East Fluid Milk Regional Analysis and Outlook
8.6.2. Africa Fluid Milk Regional Analysis and Outlook
Chapter 9. North America Fluid Milk Analysis and Outlook
9.1. North America Fluid Milk Revenue (USD Million) by Segments (2021-2032)
9.1.1. North America Fluid Milk Revenue (USD Million) by Type (2021-2032)
9.1.2. North America Fluid Milk Revenue (USD Million) by Application (2021-2032)
9.1.3. North America Fluid Milk Revenue (USD Million) by Product (2021-2032)
By Source
Cow Milk
Ship Milk
Goat Milk
Buffalo Milk
By Type
Whole Milk
Low-fat Milk
Reduced-fat Milk
Skim-Milk
Cultured Buttermilk
Lactose-Free Milk
Flavored Milk
By Application
Fortified Milk
Flavored Dairy Drinks
Yoghurts
Cheese
Creams
Frozen Desserts
By Distribution Channel
Hypermarkets/Supermarkets
Food Specialty Stores
Convenience Stores
Others
Chapter 10. Europe Fluid Milk Analysis and Outlook
10.1. Europe Fluid Milk Revenue (USD Million), by Segments (USD Million) (2021-2032)
10.1.1. Europe Fluid Milk Revenue (USD Million) by Type (2021-2032)
10.1.2. Europe Fluid Milk Revenue (USD Million) by Application (2021-2032)
10.1.3. Europe Fluid Milk Revenue (USD Million) by Product (2021-2032)
By Source
Cow Milk
Ship Milk
Goat Milk
Buffalo Milk
By Type
Whole Milk
Low-fat Milk
Reduced-fat Milk
Skim-Milk
Cultured Buttermilk
Lactose-Free Milk
Flavored Milk
By Application
Fortified Milk
Flavored Dairy Drinks
Yoghurts
Cheese
Creams
Frozen Desserts
By Distribution Channel
Hypermarkets/Supermarkets
Food Specialty Stores
Convenience Stores
Others
Chapter 11. Asia Pacific Fluid Milk Analysis and Outlook
11.1. Asia Pacific Fluid Milk Revenue (USD Million), and Revenue (USD Million) by Segments (2021-2032)
11.1.1. Asia Pacific Fluid Milk Revenue (USD Million) by Type (2021-2032)
11.1.2. Asia Pacific Fluid Milk Revenue (USD Million) by Application (2021-2032)
11.1.3. Asia Pacific Fluid Milk Revenue (USD Million) by Product (2021-2032)
By Source
Cow Milk
Ship Milk
Goat Milk
Buffalo Milk
By Type
Whole Milk
Low-fat Milk
Reduced-fat Milk
Skim-Milk
Cultured Buttermilk
Lactose-Free Milk
Flavored Milk
By Application
Fortified Milk
Flavored Dairy Drinks
Yoghurts
Cheese
Creams
Frozen Desserts
By Distribution Channel
Hypermarkets/Supermarkets
Food Specialty Stores
Convenience Stores
Others
Chapter 12. South America Fluid Milk Analysis and Outlook
12.1. South America Fluid Milk Revenue (USD Million), by Segments (2021-2032)
12.1.1. South America Fluid Milk Revenue (USD Million) by Type (2021-2032)
12.1.2. South America Fluid Milk Revenue (USD Million) by Application (2021-2032)
12.1.3. South America Fluid Milk Revenue (USD Million) by Product (2021-2032)
By Source
Cow Milk
Ship Milk
Goat Milk
Buffalo Milk
By Type
Whole Milk
Low-fat Milk
Reduced-fat Milk
Skim-Milk
Cultured Buttermilk
Lactose-Free Milk
Flavored Milk
By Application
Fortified Milk
Flavored Dairy Drinks
Yoghurts
Cheese
Creams
Frozen Desserts
By Distribution Channel
Hypermarkets/Supermarkets
Food Specialty Stores
Convenience Stores
Others
Chapter 13. Middle East and Africa Fluid Milk Analysis and Outlook
13.1. Middle East and Africa Fluid Milk Revenue (USD Million), by Segments (2021-2032)
13.1.1. Middle East and Africa Fluid Milk Revenue (USD Million) by Type (2021-2032)
13.1.2. Middle East and Africa Fluid Milk Revenue (USD Million) by Application (2021-2032)
13.1.3. Middle East and Africa Fluid Milk Revenue (USD Million) by Product (2021-2032)
By Source
Cow Milk
Ship Milk
Goat Milk
Buffalo Milk
By Type
Whole Milk
Low-fat Milk
Reduced-fat Milk
Skim-Milk
Cultured Buttermilk
Lactose-Free Milk
Flavored Milk
By Application
Fortified Milk
Flavored Dairy Drinks
Yoghurts
Cheese
Creams
Frozen Desserts
By Distribution Channel
Hypermarkets/Supermarkets
Food Specialty Stores
Convenience Stores
Others
Chapter 14. Fluid Milk Company Profiles
14.1 Business Overview
14.2 Product Profiles
14.3 SWOT Profiles
14.5 Recent Developments
14.6 Financial Profile
List of Companies
Agri-Mark Inc
Associated Milk Producers Inc
Country Fresh LLC
Dairy Farmers of America Inc
Danone SA
Fonterra Co-operative Group Ltd
Lactalis Group
Mayfield Dairy Farms Inc
Nestl S.A.
Royal FrieslandCampina N.V.
15. Methodology and Data Sources
15.1 Customization Offerings
15.2 Subscription Services
15.3 Related Reports
15.4 Publisher Expertise
LIST OF TABLES
Table 1 Market Segmentation Analysis
Table 2 Global Fluid Milk Market Share of Leading Companies, 2023
Table 3 Product Offerings of Leading Companies
Table 4 Low Growth Scenario Forecasts
Table 5 Reference Case Growth Scenario
Table 6 High Growth Case Scenario
Table 7 Global Fluid Milk Revenue (USD Million) And CAGR (%) By Type (2021-2032)
Table 8 Global Fluid Milk Revenue (USD Million) And CAGR (%) By Application (2021-2032)
Table 9 Global Fluid Milk Revenue (USD Million) And CAGR (%) By Product (2021-2032)
Table 10 Global Fluid Milk Market Revenue (USD Million) By Regions (2021-2032)
Table 11 Global Fluid Milk Market Share (%) By Regions (2021-2032)
Table 12 North America Fluid Milk Revenue (USD Million) By Country (2021-2032)
Table 13 Europe Fluid Milk Revenue (USD Million) By Country (2021-2032)
Table 14 Asia Pacific Fluid Milk Revenue (USD Million) By Country (2021-2032)
Table 15 South America Fluid Milk Revenue (USD Million) By Country (2021-2032)
Table 16 Middle East and Africa Fluid Milk Revenue (USD Million) By Region (2021-2032)
Table 17 North America Fluid Milk Revenue (USD Million) By Type (2021-2032)
Table 18 North America Fluid Milk Revenue (USD Million) By Application (2021-2032)
Table 19 North America Fluid Milk Revenue (USD Million) By Product (2021-2032)
Table 20 Europe Fluid Milk Revenue (USD Million) By Type (2021-2032)
Table 21 Europe Fluid Milk Revenue (USD Million) By Application (2021-2032)
Table 22 Europe Fluid Milk Revenue (USD Million) By Product (2021-2032)
Table 23 Asia Pacific Fluid Milk Revenue (USD Million) By Type (2021-2032)
Table 24 Asia Pacific Fluid Milk Revenue (USD Million) By Application (2021-2032)
Table 25 Asia Pacific Fluid Milk Revenue (USD Million) By Product (2021-2032)
Table 26 South America Fluid Milk Revenue (USD Million) By Type (2021-2032)
Table 27 South America Fluid Milk Revenue (USD Million) By Application (2021-2032)
Table 28 South America Fluid Milk Revenue (USD Million) By Product (2021-2032)
Table 29 Middle East and Africa Fluid Milk Revenue (USD Million) By Type (2021-2032)
Table 30 Middle East and Africa Fluid Milk Revenue (USD Million) By Application (2021-2032)
Table 31 Middle East and Africa Fluid Milk Revenue (USD Million) By Product (2021-2032)
LIST OF FIGURES
Figure 1. Market Scope
Figure 2. Pricing Forecasts Per Unit, 2023- 2032
Figure 3. Porter’s Five Forces
Figure 4. Global Fluid Milk Market Revenue (USD Million) By Regions (2021-2032)
Figure 5. Global Fluid Milk Market Share (%) By Regions (2023)
Figure 6. North America Fluid Milk Revenue (USD Million) By Country (2021-2032)
Figure 7. United States Fluid Milk Revenue (USD Million) By Country (2021-2032)
Figure 8. Canada Fluid Milk Revenue (USD Million) By Country (2021-2032)
Figure 9. Mexico Fluid Milk Revenue (USD Million) By Country (2021-2032)
Figure 10. Europe Fluid Milk Revenue (USD Million) By Country (2021-2032)
Figure 11. Germany Fluid Milk Revenue (USD Million) By Country (2021-2032)
Figure 12. France Fluid Milk Revenue (USD Million) By Country (2021-2032)
Figure 13. United Kingdom Fluid Milk Revenue (USD Million) By Country (2021-2032)
Figure 14. Spain Fluid Milk Revenue (USD Million) By Country (2021-2032)
Figure 15. Italy Fluid Milk Revenue (USD Million) By Country (2021-2032)
Figure 16. Russia Fluid Milk Revenue (USD Million) By Country (2021-2032)
Figure 17. Rest of Europe Fluid Milk Revenue (USD Million) By Country (2021-2032)
Figure 11. Asia Pacific Fluid Milk Revenue (USD Million) By Country (2021-2032)
Figure 12. China Fluid Milk Revenue (USD Million) By Country (2021-2032)
Figure 13. Japan Fluid Milk Revenue (USD Million) By Country (2021-2032)
Figure 14. India Fluid Milk Revenue (USD Million) By Country (2021-2032)
Figure 15. South Korea Fluid Milk Revenue (USD Million) By Country (2021-2032)
Figure 16. Australia Fluid Milk Revenue (USD Million) By Country (2021-2032)
Figure 17. South East Asia Fluid Milk Revenue (USD Million) By Country (2021-2032)
Figure 18. South America Fluid Milk Revenue (USD Million) By Country (2021-2032)
Figure 19. Brazil Fluid Milk Revenue (USD Million) By Country (2021-2032)
Figure 20. Argentina Fluid Milk Revenue (USD Million) By Country (2021-2032)
Figure 21. Rest of Asia Pacific Fluid Milk Revenue (USD Million) By Country (2021-2032)
Figure 22. Middle East and Africa Fluid Milk Revenue (USD Million) By Region (2021-2032)
Figure 23. Saudi Arabia Fluid Milk Revenue (USD Million) By Region (2021-2032)
Figure 24. The UAE Fluid Milk Revenue (USD Million) By Region (2021-2032)
Figure 25. Rest of Middle East Fluid Milk Revenue (USD Million) By Region (2021-2032)
Figure 26. South Africa Fluid Milk Revenue (USD Million) By Region (2021-2032)
Figure 27. Africa Fluid Milk Revenue (USD Million) By Region (2021-2032)
Figure 28. North America Fluid Milk Revenue (USD Million) By Type (2021-2032)
Figure 29. North America Fluid Milk Revenue (USD Million) By Application (2021-2032)
Figure 30. North America Fluid Milk Revenue (USD Million) By Product (2021-2032)
Figure 31. Europe Fluid Milk Revenue (USD Million) By Type (2021-2032)
Figure 32. Europe Fluid Milk Revenue (USD Million) By Application (2021-2032)
Figure 33. Europe Fluid Milk Revenue (USD Million) By Product (2021-2032)
Figure 34. Asia Pacific Fluid Milk Revenue (USD Million) By Type (2021-2032)
Figure 35. Asia Pacific Fluid Milk Revenue (USD Million) By Application (2021-2032)
Figure 36. Asia Pacific Fluid Milk Revenue (USD Million) By Product (2021-2032)
Figure 37. South America Fluid Milk Revenue (USD Million) By Type (2021-2032)
Figure 38. South America Fluid Milk Revenue (USD Million) By Application (2021-2032)
Figure 39. South America Fluid Milk Revenue (USD Million) By Product (2021-2032)
Figure 40. Middle East and Africa Fluid Milk Revenue (USD Million) By Type (2021-2032)
Figure 41. Middle East and Africa Fluid Milk Revenue (USD Million) By Application (2021-2032)
Figure 42. Middle East and Africa Fluid Milk Revenue (USD Million) By Product (2021-2032)
By Source
Cow Milk
Ship Milk
Goat Milk
Buffalo Milk
By Type
Whole Milk
Low-fat Milk
Reduced-fat Milk
Skim-Milk
Cultured Buttermilk
Lactose-Free Milk
Flavored Milk
By Application
Fortified Milk
Flavored Dairy Drinks
Yoghurts
Cheese
Creams
Frozen Desserts
By Distribution Channel
Hypermarkets/Supermarkets
Food Specialty Stores
Convenience Stores
Others
Countries Analyzed
North America (US, Canada, Mexico)
Europe (Germany, UK, France, Spain, Italy, Russia, Rest of Europe)
Asia Pacific (China, India, Japan, South Korea, Australia, South East Asia, Rest of Asia)
South America (Brazil, Argentina, Rest of South America)
Middle East and Africa (Saudi Arabia, UAE, Rest of Middle East, South Africa, Egypt, Rest of Africa)
