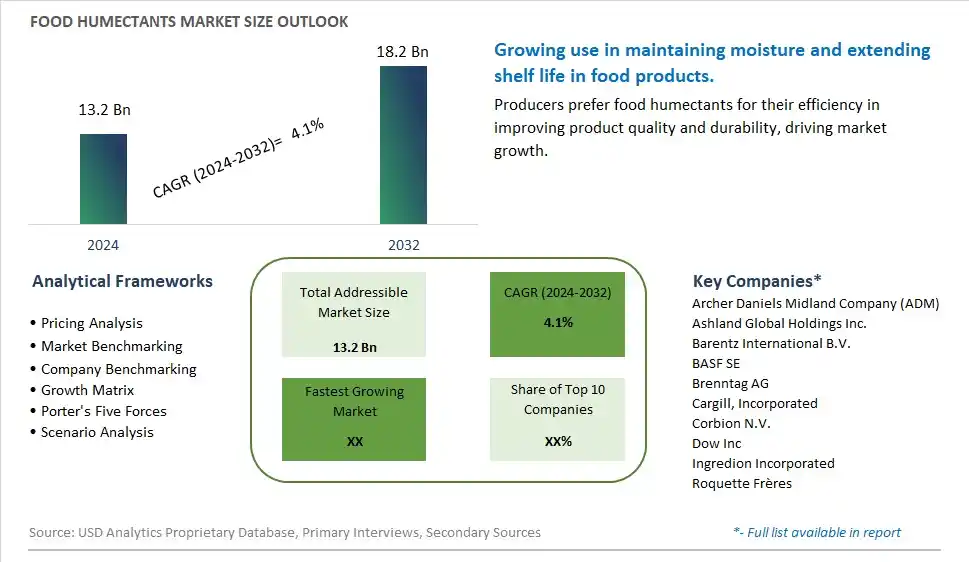
Global Food Humectants Market Size is valued at $13.2 Billion in 2024 and is forecast to register a growth rate (CAGR) of 4.1% to reach $18.2 Billion by 2032.
The global Food Humectants Market Comprehensive Study analyzes and forecasts the market size across 6 regions and 24 countries for diverse segments -By Product (Sugar Alcohol, Phosphate, Glycerol, Glycol, Lactate, Others), By Application (Bakery & confectionery, Functional & Nutritional Foods, Beverages, Dairy Products, Others), By Type (Natural, Synthetic)
An Introduction to Food Humectants Market
In 2024, the food humectants market is thriving, fueled by the demand for ingredients that help retain moisture and extend the shelf life of food products. Food humectants, such as glycerin, sorbitol, and propylene glycol, are used in a variety of applications, including baked goods, confections, and processed foods. The market benefits from advancements in formulation and processing technologies that enhance the functionality and safety of humectants. The trend towards clean label and natural ingredients is influencing product development. Increasing consumer interest in high-quality and long-lasting food products is further supporting market growth.
Food Humectants Competitive Landscape
The market report analyses the leading companies in the industry including Archer Daniels Midland Company (ADM), Ashland Global Holdings Inc., Barentz International B.V., BASF SE, Brenntag AG, Cargill, Incorporated, Corbion N.V., Dow Inc, Ingredion Incorporated, Roquette Frères, and Others.
Food Humectants Market Dynamics
Food Humectants Market Trend: Increasing Use in Moisture-Retaining and Shelf-Life-Extending Products
The most prominent trend in the Food Humectants Market is the increasing use in moisture-retaining and shelf-life-extending products. Food humectants, which help retain moisture and prevent drying, are being incorporated into a variety of processed foods and baked goods. This trend is driven by the demand for products that maintain freshness and texture over extended periods.
Food Humectants Market Driver: Convenience and Demand for Longer Shelf Life
A key driver in the Food Humectants Market is convenience and the demand for longer shelf life. As more consumers seek ready-to-eat and convenient food options, there is a rising demand for humectants that ensure products remain fresh and enjoyable. This demand supports market growth as producers aim to meet consumer expectations for high-quality and long-lasting food products.
Food Humectants Market Opportunity: Innovation in Natural and Clean Label Humectants
One significant opportunity in the Food Humectants Market lies in innovation in natural and clean label humectants. Companies can develop new products that use natural ingredients to achieve moisture retention, catering to the growing demand for clean label and minimally processed foods. By offering diverse and natural humectant options, manufacturers can attract a broader consumer base and drive market growth.
Food Humectants Market Share Analysis- Largest Segment by Product
In the Food Humectants Market, Glycerol is the largest segment. Glycerol, also known as glycerin, is a widely used humectant in the food industry due to its excellent moisture-retaining properties, which help in maintaining the texture and freshness of food products. It is used extensively in bakery products, confectioneries, and beverages to prevent drying and enhance shelf life. Its safety profile, versatility, and ability to blend well with other ingredients contribute to its dominant position in the market. Glycerol's broad application across various food categories and its effectiveness in maintaining product quality make it the largest segment in the Food Humectants Market.
Food Humectants Market Share Analysis- Poised to Grow Fastest Over the Next Five Years by Application
The Functional & Nutritional Foods segment in the Food Humectants Market is poised to grow the fastest over the next five years. This growth is driven by increasing consumer demand for functional foods that offer health benefits beyond basic nutrition, such as improved digestive health and enhanced energy levels. Humectants play a crucial role in preserving the texture and moisture content of these foods, which is vital for maintaining their nutritional value and consumer appeal. As the market for functional and nutritional foods expands, driven by trends in health and wellness, the demand for effective humectants will grow correspondingly, positioning this segment as the fastest-growing in the market.
Food Humectants Market Share Analysis- Largest Segment by Type
In the Food Humectants Market, Synthetic humectants are the largest segment. Synthetic humectants, including substances like glycerol and glycol, are widely utilized due to their consistency, affordability, and effectiveness in retaining moisture in various food products. They offer reliable performance in preventing dehydration and maintaining texture in processed foods, which makes them a preferred choice in industrial food production. The extensive use of synthetic humectants in a wide range of food applications contributes to their status as the largest segment in the Food Humectants Market.
Food Humectants Market Segmentation
By Product
Sugar Alcohol
Phosphate
Glycerol
Glycol
Lactate
Others
By Application
Bakery & confectionery
Functional & Nutritional Foods
Beverages
Dairy Products
Others
By Type
Natural
Synthetic
Countries Analyzed
North America (US, Canada, Mexico)
Europe (Germany, UK, France, Spain, Italy, Russia, Rest of Europe)
Asia Pacific (China, India, Japan, South Korea, Australia, South East Asia, Rest of Asia)
South America (Brazil, Argentina, Rest of South America)
Middle East and Africa (Saudi Arabia, UAE, Rest of Middle East, South Africa, Egypt, Rest of Africa)
Food Humectants Companies Profiled in the Study
Archer Daniels Midland Company (ADM)
Ashland Global Holdings Inc.
Barentz International B.V.
BASF SE
Brenntag AG
Cargill, Incorporated
Corbion N.V.
Dow Inc
Ingredion Incorporated
Roquette Frères
*- List Not Exhaustive
Chapter 1. TABLE OF CONTENTS
Chapter 2. Introduction to Food Humectants Market
2.1. Market Overview
2.2. Key Statistics and Report Highlights
2.3. Scope of the Comprehensive Study
2.3.1. Market Definition
2.3.2 Countries and Regions Covered
2.3.3 Research Objective
2.3.4 Units, Currency, and Conversions
2.3.5 Industry Value Chain
2.4. Key Market Segments
2.5. Key Companies
2.6. Study Period
Chapter 3. Strategic Analysis Review
3.1. Food Humectants Pricing Analysis and Forecast
3.2. Porter’s Five Forces
3.3. Market Ecosystem
3.4. SWOT Analysis
3.5. Regulatory Scenario
3.3. Effects of Inflation, Russia-Ukraine War, moderating economic growth, and other macroeconomic factors
Chapter 4. Competitive Landscape
4.1. Market Share Analysis
4.1.1. Global Food Humectants Market Share by Company, 2023
4.1.2. Product Offerings of Leading Food Humectants Companies
4.2. Market Entropy
4.2.1. New Product Launches in the Industry
4.2.2. Mergers, Acquisitions, Joint ventures, and Partnerships
4.3. Key Strategies and Best Practices
Chapter 5. Global Market Projections: Best, Reference, and Low Case Scenarios
5.1. Growth Analysis- Case Scenario Definitions
5.2. Low Growth Case Scenario Forecasts
5.3. Reference Growth Case Scenario Forecasts
5.4. High Growth Case Scenario Forecasts
Chapter 6. Market Dynamics
6.1. Food Humectants Market Drivers
6.2. Food Humectants Market Challenges
6.6. Food Humectants Market Opportunities
6.4. Food Humectants Market Trends
Chapter 7. Global Food Humectants Market Outlook Trends
7.1. Global Food Humectants Revenue (USD Million) and CAGR (%) by Type (2021-2032)
7.2. Global Food Humectants Revenue (USD Million) and CAGR (%) by Application (2021-2032)
7.3. Global Food Humectants Revenue (USD Million) and CAGR (%) by Product (2021-2032)
By Product
Sugar Alcohol
Phosphate
Glycerol
Glycol
Lactate
Others
By Application
Bakery & confectionery
Functional & Nutritional Foods
Beverages
Dairy Products
Others
By Type
Natural
Synthetic
Chapter 8. Global Food Humectants Regional Analysis and Outlook
8.1. Global Food Humectants Revenue (USD Million) By Regions (2021- 2032)
8.2. North America Food Humectants Revenue (USD Million) by Country (2021-2032)
8.2.1. United States Food Humectants Regional Analysis and Outlook
8.2.2. Canada Food Humectants Regional Analysis and Outlook
8.2.3. Mexico Food Humectants Regional Analysis and Outlook
8.3. Europe Food Humectants Revenue (USD Million), by Country (2021-2032)
8.3.1. Germany Food Humectants Regional Analysis and Outlook
8.3.2. France Food Humectants Regional Analysis and Outlook
8.3.3. United Kingdom Food Humectants Regional Analysis and Outlook
8.3.4. Spain Food Humectants Regional Analysis and Outlook
8.3.5. Italy Food Humectants Regional Analysis and Outlook
8.3.6. Russia Food Humectants Regional Analysis and Outlook
8.3.7. Rest of Europe Food Humectants Regional Analysis and Outlook
8.4. Asia Pacific Food Humectants Revenue (USD Million) by Country (2021-2032)
8.4.1. China Food Humectants Regional Analysis and Outlook
8.4.2. Japan Food Humectants Regional Analysis and Outlook
8.4.3. India Food Humectants Regional Analysis and Outlook
8.4.4. South Korea Food Humectants Regional Analysis and Outlook
8.4.5. Australia Food Humectants Regional Analysis and Outlook
8.4.6. South East Asia Food Humectants Regional Analysis and Outlook
8.4.7. Rest of Asia Pacific Food Humectants Regional Analysis and Outlook
8.5. South America Food Humectants Revenue (USD Million), by Country (2021-2032)
8.5.1. Brazil Food Humectants Regional Analysis and Outlook
8.5.2. Argentina Food Humectants Regional Analysis and Outlook
8.5.3. Rest of South America Food Humectants Regional Analysis and Outlook
8.6. Middle East and Africa Food Humectants Revenue (USD Million) by Country (2021-2032)
8.6.1. Middle East Food Humectants Regional Analysis and Outlook
8.6.2. Africa Food Humectants Regional Analysis and Outlook
Chapter 9. North America Food Humectants Analysis and Outlook
9.1. North America Food Humectants Revenue (USD Million) by Segments (2021-2032)
9.1.1. North America Food Humectants Revenue (USD Million) by Type (2021-2032)
9.1.2. North America Food Humectants Revenue (USD Million) by Application (2021-2032)
9.1.3. North America Food Humectants Revenue (USD Million) by Product (2021-2032)
By Product
Sugar Alcohol
Phosphate
Glycerol
Glycol
Lactate
Others
By Application
Bakery & confectionery
Functional & Nutritional Foods
Beverages
Dairy Products
Others
By Type
Natural
Synthetic
Chapter 10. Europe Food Humectants Analysis and Outlook
10.1. Europe Food Humectants Revenue (USD Million), by Segments (USD Million) (2021-2032)
10.1.1. Europe Food Humectants Revenue (USD Million) by Type (2021-2032)
10.1.2. Europe Food Humectants Revenue (USD Million) by Application (2021-2032)
10.1.3. Europe Food Humectants Revenue (USD Million) by Product (2021-2032)
By Product
Sugar Alcohol
Phosphate
Glycerol
Glycol
Lactate
Others
By Application
Bakery & confectionery
Functional & Nutritional Foods
Beverages
Dairy Products
Others
By Type
Natural
Synthetic
Chapter 11. Asia Pacific Food Humectants Analysis and Outlook
11.1. Asia Pacific Food Humectants Revenue (USD Million), and Revenue (USD Million) by Segments (2021-2032)
11.1.1. Asia Pacific Food Humectants Revenue (USD Million) by Type (2021-2032)
11.1.2. Asia Pacific Food Humectants Revenue (USD Million) by Application (2021-2032)
11.1.3. Asia Pacific Food Humectants Revenue (USD Million) by Product (2021-2032)
By Product
Sugar Alcohol
Phosphate
Glycerol
Glycol
Lactate
Others
By Application
Bakery & confectionery
Functional & Nutritional Foods
Beverages
Dairy Products
Others
By Type
Natural
Synthetic
Chapter 12. South America Food Humectants Analysis and Outlook
12.1. South America Food Humectants Revenue (USD Million), by Segments (2021-2032)
12.1.1. South America Food Humectants Revenue (USD Million) by Type (2021-2032)
12.1.2. South America Food Humectants Revenue (USD Million) by Application (2021-2032)
12.1.3. South America Food Humectants Revenue (USD Million) by Product (2021-2032)
By Product
Sugar Alcohol
Phosphate
Glycerol
Glycol
Lactate
Others
By Application
Bakery & confectionery
Functional & Nutritional Foods
Beverages
Dairy Products
Others
By Type
Natural
Synthetic
Chapter 13. Middle East and Africa Food Humectants Analysis and Outlook
13.1. Middle East and Africa Food Humectants Revenue (USD Million), by Segments (2021-2032)
13.1.1. Middle East and Africa Food Humectants Revenue (USD Million) by Type (2021-2032)
13.1.2. Middle East and Africa Food Humectants Revenue (USD Million) by Application (2021-2032)
13.1.3. Middle East and Africa Food Humectants Revenue (USD Million) by Product (2021-2032)
By Product
Sugar Alcohol
Phosphate
Glycerol
Glycol
Lactate
Others
By Application
Bakery & confectionery
Functional & Nutritional Foods
Beverages
Dairy Products
Others
By Type
Natural
Synthetic
Chapter 14. Food Humectants Company Profiles
14.1 Business Overview
14.2 Product Profiles
14.3 SWOT Profiles
14.5 Recent Developments
14.6 Financial Profile
List of Companies
Archer Daniels Midland Company (ADM)
Ashland Global Holdings Inc.
Barentz International B.V.
BASF SE
Brenntag AG
Cargill, Incorporated
Corbion N.V.
Dow Inc
Ingredion Incorporated
Roquette Frères
15. Methodology and Data Sources
15.1 Customization Offerings
15.2 Subscription Services
15.3 Related Reports
15.4 Publisher Expertise
LIST OF TABLES
Table 1 Market Segmentation Analysis
Table 2 Global Food Humectants Market Share of Leading Companies, 2023
Table 3 Product Offerings of Leading Companies
Table 4 Low Growth Scenario Forecasts
Table 5 Reference Case Growth Scenario
Table 6 High Growth Case Scenario
Table 7 Global Food Humectants Revenue (USD Million) And CAGR (%) By Type (2021-2032)
Table 8 Global Food Humectants Revenue (USD Million) And CAGR (%) By Application (2021-2032)
Table 9 Global Food Humectants Revenue (USD Million) And CAGR (%) By Product (2021-2032)
Table 10 Global Food Humectants Market Revenue (USD Million) By Regions (2021-2032)
Table 11 Global Food Humectants Market Share (%) By Regions (2021-2032)
Table 12 North America Food Humectants Revenue (USD Million) By Country (2021-2032)
Table 13 Europe Food Humectants Revenue (USD Million) By Country (2021-2032)
Table 14 Asia Pacific Food Humectants Revenue (USD Million) By Country (2021-2032)
Table 15 South America Food Humectants Revenue (USD Million) By Country (2021-2032)
Table 16 Middle East and Africa Food Humectants Revenue (USD Million) By Region (2021-2032)
Table 17 North America Food Humectants Revenue (USD Million) By Type (2021-2032)
Table 18 North America Food Humectants Revenue (USD Million) By Application (2021-2032)
Table 19 North America Food Humectants Revenue (USD Million) By Product (2021-2032)
Table 20 Europe Food Humectants Revenue (USD Million) By Type (2021-2032)
Table 21 Europe Food Humectants Revenue (USD Million) By Application (2021-2032)
Table 22 Europe Food Humectants Revenue (USD Million) By Product (2021-2032)
Table 23 Asia Pacific Food Humectants Revenue (USD Million) By Type (2021-2032)
Table 24 Asia Pacific Food Humectants Revenue (USD Million) By Application (2021-2032)
Table 25 Asia Pacific Food Humectants Revenue (USD Million) By Product (2021-2032)
Table 26 South America Food Humectants Revenue (USD Million) By Type (2021-2032)
Table 27 South America Food Humectants Revenue (USD Million) By Application (2021-2032)
Table 28 South America Food Humectants Revenue (USD Million) By Product (2021-2032)
Table 29 Middle East and Africa Food Humectants Revenue (USD Million) By Type (2021-2032)
Table 30 Middle East and Africa Food Humectants Revenue (USD Million) By Application (2021-2032)
Table 31 Middle East and Africa Food Humectants Revenue (USD Million) By Product (2021-2032)
LIST OF FIGURES
Figure 1. Market Scope
Figure 2. Pricing Forecasts Per Unit, 2023- 2032
Figure 3. Porter’s Five Forces
Figure 4. Global Food Humectants Market Revenue (USD Million) By Regions (2021-2032)
Figure 5. Global Food Humectants Market Share (%) By Regions (2023)
Figure 6. North America Food Humectants Revenue (USD Million) By Country (2021-2032)
Figure 7. United States Food Humectants Revenue (USD Million) By Country (2021-2032)
Figure 8. Canada Food Humectants Revenue (USD Million) By Country (2021-2032)
Figure 9. Mexico Food Humectants Revenue (USD Million) By Country (2021-2032)
Figure 10. Europe Food Humectants Revenue (USD Million) By Country (2021-2032)
Figure 11. Germany Food Humectants Revenue (USD Million) By Country (2021-2032)
Figure 12. France Food Humectants Revenue (USD Million) By Country (2021-2032)
Figure 13. United Kingdom Food Humectants Revenue (USD Million) By Country (2021-2032)
Figure 14. Spain Food Humectants Revenue (USD Million) By Country (2021-2032)
Figure 15. Italy Food Humectants Revenue (USD Million) By Country (2021-2032)
Figure 16. Russia Food Humectants Revenue (USD Million) By Country (2021-2032)
Figure 17. Rest of Europe Food Humectants Revenue (USD Million) By Country (2021-2032)
Figure 11. Asia Pacific Food Humectants Revenue (USD Million) By Country (2021-2032)
Figure 12. China Food Humectants Revenue (USD Million) By Country (2021-2032)
Figure 13. Japan Food Humectants Revenue (USD Million) By Country (2021-2032)
Figure 14. India Food Humectants Revenue (USD Million) By Country (2021-2032)
Figure 15. South Korea Food Humectants Revenue (USD Million) By Country (2021-2032)
Figure 16. Australia Food Humectants Revenue (USD Million) By Country (2021-2032)
Figure 17. South East Asia Food Humectants Revenue (USD Million) By Country (2021-2032)
Figure 18. South America Food Humectants Revenue (USD Million) By Country (2021-2032)
Figure 19. Brazil Food Humectants Revenue (USD Million) By Country (2021-2032)
Figure 20. Argentina Food Humectants Revenue (USD Million) By Country (2021-2032)
Figure 21. Rest of Asia Pacific Food Humectants Revenue (USD Million) By Country (2021-2032)
Figure 22. Middle East and Africa Food Humectants Revenue (USD Million) By Region (2021-2032)
Figure 23. Saudi Arabia Food Humectants Revenue (USD Million) By Region (2021-2032)
Figure 24. The UAE Food Humectants Revenue (USD Million) By Region (2021-2032)
Figure 25. Rest of Middle East Food Humectants Revenue (USD Million) By Region (2021-2032)
Figure 26. South Africa Food Humectants Revenue (USD Million) By Region (2021-2032)
Figure 27. Africa Food Humectants Revenue (USD Million) By Region (2021-2032)
Figure 28. North America Food Humectants Revenue (USD Million) By Type (2021-2032)
Figure 29. North America Food Humectants Revenue (USD Million) By Application (2021-2032)
Figure 30. North America Food Humectants Revenue (USD Million) By Product (2021-2032)
Figure 31. Europe Food Humectants Revenue (USD Million) By Type (2021-2032)
Figure 32. Europe Food Humectants Revenue (USD Million) By Application (2021-2032)
Figure 33. Europe Food Humectants Revenue (USD Million) By Product (2021-2032)
Figure 34. Asia Pacific Food Humectants Revenue (USD Million) By Type (2021-2032)
Figure 35. Asia Pacific Food Humectants Revenue (USD Million) By Application (2021-2032)
Figure 36. Asia Pacific Food Humectants Revenue (USD Million) By Product (2021-2032)
Figure 37. South America Food Humectants Revenue (USD Million) By Type (2021-2032)
Figure 38. South America Food Humectants Revenue (USD Million) By Application (2021-2032)
Figure 39. South America Food Humectants Revenue (USD Million) By Product (2021-2032)
Figure 40. Middle East and Africa Food Humectants Revenue (USD Million) By Type (2021-2032)
Figure 41. Middle East and Africa Food Humectants Revenue (USD Million) By Application (2021-2032)
Figure 42. Middle East and Africa Food Humectants Revenue (USD Million) By Product (2021-2032)
By Product
Sugar Alcohol
Phosphate
Glycerol
Glycol
Lactate
Others
By Application
Bakery & confectionery
Functional & Nutritional Foods
Beverages
Dairy Products
Others
By Type
Natural
Synthetic
Countries Analyzed
North America (US, Canada, Mexico)
Europe (Germany, UK, France, Spain, Italy, Russia, Rest of Europe)
Asia Pacific (China, India, Japan, South Korea, Australia, South East Asia, Rest of Asia)
South America (Brazil, Argentina, Rest of South America)
Middle East and Africa (Saudi Arabia, UAE, Rest of Middle East, South Africa, Egypt, Rest of Africa)
