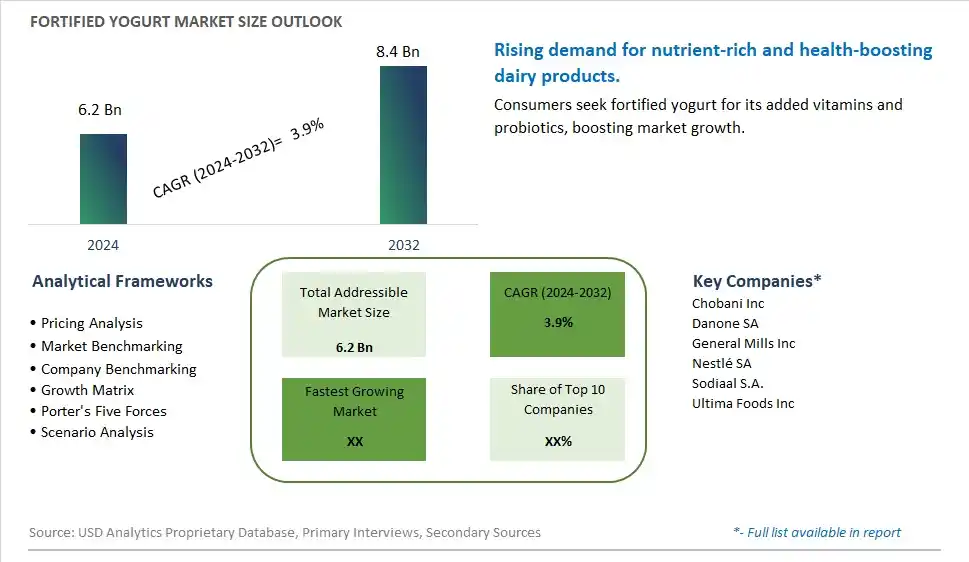
Global Fortified Yogurt Market Size is valued at $6.2 Billion in 2024 and is forecast to register a growth rate (CAGR) of 3.9% to reach $8.4 Billion by 2032.
The global Fortified Yogurt Market Comprehensive Study analyzes and forecasts the market size across 6 regions and 24 countries for diverse segments -By Type (Gluten Free, Lactose Free, Low Calories, Low Fat & Others), By Application (Supermarkets/Hypermarkets, Convenience Stores, Others)
An Introduction to Fortified Yogurt Market
The fortified yogurt market in 2024 is expanding rapidly, driven by the demand for probiotic-rich and nutrient-enhanced dairy products. Fortified yogurt, enriched with vitamins, minerals, and probiotics, supports digestive health and overall wellness. The market benefits from innovations in yogurt formulation and fermentation technologies that enhance nutritional value and taste. The trend towards clean label and natural ingredients is influencing product development. Increasing consumer interest in functional foods and the popularity of gut health products are further propelling market growth.
Fortified Yogurt Competitive Landscape
The market report analyses the leading companies in the industry including Chobani Inc, Danone SA, General Mills Inc, Nestlé SA, Sodiaal S.A., Ultima Foods Inc, and Others.
Fortified Yogurt Market Dynamics
Fortified Yogurt Market Trend: Increasing Demand for Probiotic and Functional Yogurts
The most prominent trend in the Fortified Yogurt Market is the increasing demand for probiotic and functional yogurts. Consumers are seeking yogurt products that offer additional health benefits, such as improved gut health, enhanced immunity, and added nutrients. This trend is driven by the growing awareness of the importance of gut microbiota and overall health.
Fortified Yogurt Market Driver: Health Consciousness and Nutritional Benefits
A key driver in the Fortified Yogurt Market is health consciousness and the recognized nutritional benefits of yogurt. As more individuals focus on consuming foods that support digestive health and provide essential nutrients, there is a rising demand for fortified yogurts that offer probiotics, vitamins, and minerals. This demand supports market growth as consumers seek health-enhancing dairy products.
Fortified Yogurt Market Opportunity: Innovation in Dairy and Plant-Based Yogurts
One significant opportunity in the Fortified Yogurt Market lies in innovation in both dairy and plant-based yogurts. Companies can develop new fortified yogurt products that cater to various dietary preferences, including lactose-free and vegan options, while offering enhanced health benefits. By offering diverse and functional yogurt options, manufacturers can attract a broader consumer base and drive market growth.
Fortified Yogurt Market Share Analysis- Largest Segment by Type
In the Fortified Yogurt Market, the Low Fat type is the largest segment. Low-fat yogurts cater to the growing consumer demand for healthier, lower-calorie dairy options. They offer the benefits of yogurt—such as probiotics and calcium—without the added calories and fat, aligning with health-conscious dietary preferences. The segment's dominance is supported by widespread consumer awareness about the benefits of reducing fat intake and the availability of low-fat options across various brands and flavors. This trend is reinforced by nutritional guidelines promoting lower fat consumption, making low-fat yogurt the largest segment in the market.
Fortified Yogurt Market Share Analysis- Poised to Grow Fastest Over the Next Five Years by Application
The Supermarkets/Hypermarkets application in the Fortified Yogurt Market is poised to grow the fastest over the next five years. These retail channels are significant due to their extensive reach and ability to offer a wide variety of fortified yogurt products. The growth in this segment is driven by increasing consumer preference for shopping at large retail outlets that provide convenience, variety, and competitive pricing. Additionally, supermarkets and hypermarkets are investing in expanding their dairy sections to meet the rising demand for fortified yogurt products, further boosting their growth prospects.
Fortified Yogurt Market Segmentation
By Type
Gluten Free
Lactose Free
Low Calories
Low Fat & Others
By Application
Supermarkets/Hypermarkets
Convenience Stores
Others
Countries Analyzed
North America (US, Canada, Mexico)
Europe (Germany, UK, France, Spain, Italy, Russia, Rest of Europe)
Asia Pacific (China, India, Japan, South Korea, Australia, South East Asia, Rest of Asia)
South America (Brazil, Argentina, Rest of South America)
Middle East and Africa (Saudi Arabia, UAE, Rest of Middle East, South Africa, Egypt, Rest of Africa)
Fortified Yogurt Companies Profiled in the Study
Chobani Inc
Danone SA
General Mills Inc
Nestlé SA
Sodiaal S.A.
Ultima Foods Inc
*- List Not Exhaustive
Chapter 1. TABLE OF CONTENTS
Chapter 2. Introduction to Fortified Yogurt Market
2.1. Market Overview
2.2. Key Statistics and Report Highlights
2.3. Scope of the Comprehensive Study
2.3.1. Market Definition
2.3.2 Countries and Regions Covered
2.3.3 Research Objective
2.3.4 Units, Currency, and Conversions
2.3.5 Industry Value Chain
2.4. Key Market Segments
2.5. Key Companies
2.6. Study Period
Chapter 3. Strategic Analysis Review
3.1. Fortified Yogurt Pricing Analysis and Forecast
3.2. Porter’s Five Forces
3.3. Market Ecosystem
3.4. SWOT Analysis
3.5. Regulatory Scenario
3.3. Effects of Inflation, Russia-Ukraine War, moderating economic growth, and other macroeconomic factors
Chapter 4. Competitive Landscape
4.1. Market Share Analysis
4.1.1. Global Fortified Yogurt Market Share by Company, 2023
4.1.2. Product Offerings of Leading Fortified Yogurt Companies
4.2. Market Entropy
4.2.1. New Product Launches in the Industry
4.2.2. Mergers, Acquisitions, Joint ventures, and Partnerships
4.3. Key Strategies and Best Practices
Chapter 5. Global Market Projections: Best, Reference, and Low Case Scenarios
5.1. Growth Analysis- Case Scenario Definitions
5.2. Low Growth Case Scenario Forecasts
5.3. Reference Growth Case Scenario Forecasts
5.4. High Growth Case Scenario Forecasts
Chapter 6. Market Dynamics
6.1. Fortified Yogurt Market Drivers
6.2. Fortified Yogurt Market Challenges
6.6. Fortified Yogurt Market Opportunities
6.4. Fortified Yogurt Market Trends
Chapter 7. Global Fortified Yogurt Market Outlook Trends
7.1. Global Fortified Yogurt Revenue (USD Million) and CAGR (%) by Type (2021-2032)
7.2. Global Fortified Yogurt Revenue (USD Million) and CAGR (%) by Application (2021-2032)
7.3. Global Fortified Yogurt Revenue (USD Million) and CAGR (%) by Product (2021-2032)
By Type
Gluten Free
Lactose Free
Low Calories
Low Fat & Others
By Application
Supermarkets/Hypermarkets
Convenience Stores
Others
Chapter 8. Global Fortified Yogurt Regional Analysis and Outlook
8.1. Global Fortified Yogurt Revenue (USD Million) By Regions (2021- 2032)
8.2. North America Fortified Yogurt Revenue (USD Million) by Country (2021-2032)
8.2.1. United States Fortified Yogurt Regional Analysis and Outlook
8.2.2. Canada Fortified Yogurt Regional Analysis and Outlook
8.2.3. Mexico Fortified Yogurt Regional Analysis and Outlook
8.3. Europe Fortified Yogurt Revenue (USD Million), by Country (2021-2032)
8.3.1. Germany Fortified Yogurt Regional Analysis and Outlook
8.3.2. France Fortified Yogurt Regional Analysis and Outlook
8.3.3. United Kingdom Fortified Yogurt Regional Analysis and Outlook
8.3.4. Spain Fortified Yogurt Regional Analysis and Outlook
8.3.5. Italy Fortified Yogurt Regional Analysis and Outlook
8.3.6. Russia Fortified Yogurt Regional Analysis and Outlook
8.3.7. Rest of Europe Fortified Yogurt Regional Analysis and Outlook
8.4. Asia Pacific Fortified Yogurt Revenue (USD Million) by Country (2021-2032)
8.4.1. China Fortified Yogurt Regional Analysis and Outlook
8.4.2. Japan Fortified Yogurt Regional Analysis and Outlook
8.4.3. India Fortified Yogurt Regional Analysis and Outlook
8.4.4. South Korea Fortified Yogurt Regional Analysis and Outlook
8.4.5. Australia Fortified Yogurt Regional Analysis and Outlook
8.4.6. South East Asia Fortified Yogurt Regional Analysis and Outlook
8.4.7. Rest of Asia Pacific Fortified Yogurt Regional Analysis and Outlook
8.5. South America Fortified Yogurt Revenue (USD Million), by Country (2021-2032)
8.5.1. Brazil Fortified Yogurt Regional Analysis and Outlook
8.5.2. Argentina Fortified Yogurt Regional Analysis and Outlook
8.5.3. Rest of South America Fortified Yogurt Regional Analysis and Outlook
8.6. Middle East and Africa Fortified Yogurt Revenue (USD Million) by Country (2021-2032)
8.6.1. Middle East Fortified Yogurt Regional Analysis and Outlook
8.6.2. Africa Fortified Yogurt Regional Analysis and Outlook
Chapter 9. North America Fortified Yogurt Analysis and Outlook
9.1. North America Fortified Yogurt Revenue (USD Million) by Segments (2021-2032)
9.1.1. North America Fortified Yogurt Revenue (USD Million) by Type (2021-2032)
9.1.2. North America Fortified Yogurt Revenue (USD Million) by Application (2021-2032)
9.1.3. North America Fortified Yogurt Revenue (USD Million) by Product (2021-2032)
By Type
Gluten Free
Lactose Free
Low Calories
Low Fat & Others
By Application
Supermarkets/Hypermarkets
Convenience Stores
Others
Chapter 10. Europe Fortified Yogurt Analysis and Outlook
10.1. Europe Fortified Yogurt Revenue (USD Million), by Segments (USD Million) (2021-2032)
10.1.1. Europe Fortified Yogurt Revenue (USD Million) by Type (2021-2032)
10.1.2. Europe Fortified Yogurt Revenue (USD Million) by Application (2021-2032)
10.1.3. Europe Fortified Yogurt Revenue (USD Million) by Product (2021-2032)
By Type
Gluten Free
Lactose Free
Low Calories
Low Fat & Others
By Application
Supermarkets/Hypermarkets
Convenience Stores
Others
Chapter 11. Asia Pacific Fortified Yogurt Analysis and Outlook
11.1. Asia Pacific Fortified Yogurt Revenue (USD Million), and Revenue (USD Million) by Segments (2021-2032)
11.1.1. Asia Pacific Fortified Yogurt Revenue (USD Million) by Type (2021-2032)
11.1.2. Asia Pacific Fortified Yogurt Revenue (USD Million) by Application (2021-2032)
11.1.3. Asia Pacific Fortified Yogurt Revenue (USD Million) by Product (2021-2032)
By Type
Gluten Free
Lactose Free
Low Calories
Low Fat & Others
By Application
Supermarkets/Hypermarkets
Convenience Stores
Others
Chapter 12. South America Fortified Yogurt Analysis and Outlook
12.1. South America Fortified Yogurt Revenue (USD Million), by Segments (2021-2032)
12.1.1. South America Fortified Yogurt Revenue (USD Million) by Type (2021-2032)
12.1.2. South America Fortified Yogurt Revenue (USD Million) by Application (2021-2032)
12.1.3. South America Fortified Yogurt Revenue (USD Million) by Product (2021-2032)
By Type
Gluten Free
Lactose Free
Low Calories
Low Fat & Others
By Application
Supermarkets/Hypermarkets
Convenience Stores
Others
Chapter 13. Middle East and Africa Fortified Yogurt Analysis and Outlook
13.1. Middle East and Africa Fortified Yogurt Revenue (USD Million), by Segments (2021-2032)
13.1.1. Middle East and Africa Fortified Yogurt Revenue (USD Million) by Type (2021-2032)
13.1.2. Middle East and Africa Fortified Yogurt Revenue (USD Million) by Application (2021-2032)
13.1.3. Middle East and Africa Fortified Yogurt Revenue (USD Million) by Product (2021-2032)
By Type
Gluten Free
Lactose Free
Low Calories
Low Fat & Others
By Application
Supermarkets/Hypermarkets
Convenience Stores
Others
Chapter 14. Fortified Yogurt Company Profiles
14.1 Business Overview
14.2 Product Profiles
14.3 SWOT Profiles
14.5 Recent Developments
14.6 Financial Profile
List of Companies
Chobani Inc
Danone SA
General Mills Inc
Nestlé SA
Sodiaal S.A.
Ultima Foods Inc
15. Methodology and Data Sources
15.1 Customization Offerings
15.2 Subscription Services
15.3 Related Reports
15.4 Publisher Expertise
LIST OF TABLES
Table 1 Market Segmentation Analysis
Table 2 Global Fortified Yogurt Market Share of Leading Companies, 2023
Table 3 Product Offerings of Leading Companies
Table 4 Low Growth Scenario Forecasts
Table 5 Reference Case Growth Scenario
Table 6 High Growth Case Scenario
Table 7 Global Fortified Yogurt Revenue (USD Million) And CAGR (%) By Type (2021-2032)
Table 8 Global Fortified Yogurt Revenue (USD Million) And CAGR (%) By Application (2021-2032)
Table 9 Global Fortified Yogurt Revenue (USD Million) And CAGR (%) By Product (2021-2032)
Table 10 Global Fortified Yogurt Market Revenue (USD Million) By Regions (2021-2032)
Table 11 Global Fortified Yogurt Market Share (%) By Regions (2021-2032)
Table 12 North America Fortified Yogurt Revenue (USD Million) By Country (2021-2032)
Table 13 Europe Fortified Yogurt Revenue (USD Million) By Country (2021-2032)
Table 14 Asia Pacific Fortified Yogurt Revenue (USD Million) By Country (2021-2032)
Table 15 South America Fortified Yogurt Revenue (USD Million) By Country (2021-2032)
Table 16 Middle East and Africa Fortified Yogurt Revenue (USD Million) By Region (2021-2032)
Table 17 North America Fortified Yogurt Revenue (USD Million) By Type (2021-2032)
Table 18 North America Fortified Yogurt Revenue (USD Million) By Application (2021-2032)
Table 19 North America Fortified Yogurt Revenue (USD Million) By Product (2021-2032)
Table 20 Europe Fortified Yogurt Revenue (USD Million) By Type (2021-2032)
Table 21 Europe Fortified Yogurt Revenue (USD Million) By Application (2021-2032)
Table 22 Europe Fortified Yogurt Revenue (USD Million) By Product (2021-2032)
Table 23 Asia Pacific Fortified Yogurt Revenue (USD Million) By Type (2021-2032)
Table 24 Asia Pacific Fortified Yogurt Revenue (USD Million) By Application (2021-2032)
Table 25 Asia Pacific Fortified Yogurt Revenue (USD Million) By Product (2021-2032)
Table 26 South America Fortified Yogurt Revenue (USD Million) By Type (2021-2032)
Table 27 South America Fortified Yogurt Revenue (USD Million) By Application (2021-2032)
Table 28 South America Fortified Yogurt Revenue (USD Million) By Product (2021-2032)
Table 29 Middle East and Africa Fortified Yogurt Revenue (USD Million) By Type (2021-2032)
Table 30 Middle East and Africa Fortified Yogurt Revenue (USD Million) By Application (2021-2032)
Table 31 Middle East and Africa Fortified Yogurt Revenue (USD Million) By Product (2021-2032)
LIST OF FIGURES
Figure 1. Market Scope
Figure 2. Pricing Forecasts Per Unit, 2023- 2032
Figure 3. Porter’s Five Forces
Figure 4. Global Fortified Yogurt Market Revenue (USD Million) By Regions (2021-2032)
Figure 5. Global Fortified Yogurt Market Share (%) By Regions (2023)
Figure 6. North America Fortified Yogurt Revenue (USD Million) By Country (2021-2032)
Figure 7. United States Fortified Yogurt Revenue (USD Million) By Country (2021-2032)
Figure 8. Canada Fortified Yogurt Revenue (USD Million) By Country (2021-2032)
Figure 9. Mexico Fortified Yogurt Revenue (USD Million) By Country (2021-2032)
Figure 10. Europe Fortified Yogurt Revenue (USD Million) By Country (2021-2032)
Figure 11. Germany Fortified Yogurt Revenue (USD Million) By Country (2021-2032)
Figure 12. France Fortified Yogurt Revenue (USD Million) By Country (2021-2032)
Figure 13. United Kingdom Fortified Yogurt Revenue (USD Million) By Country (2021-2032)
Figure 14. Spain Fortified Yogurt Revenue (USD Million) By Country (2021-2032)
Figure 15. Italy Fortified Yogurt Revenue (USD Million) By Country (2021-2032)
Figure 16. Russia Fortified Yogurt Revenue (USD Million) By Country (2021-2032)
Figure 17. Rest of Europe Fortified Yogurt Revenue (USD Million) By Country (2021-2032)
Figure 11. Asia Pacific Fortified Yogurt Revenue (USD Million) By Country (2021-2032)
Figure 12. China Fortified Yogurt Revenue (USD Million) By Country (2021-2032)
Figure 13. Japan Fortified Yogurt Revenue (USD Million) By Country (2021-2032)
Figure 14. India Fortified Yogurt Revenue (USD Million) By Country (2021-2032)
Figure 15. South Korea Fortified Yogurt Revenue (USD Million) By Country (2021-2032)
Figure 16. Australia Fortified Yogurt Revenue (USD Million) By Country (2021-2032)
Figure 17. South East Asia Fortified Yogurt Revenue (USD Million) By Country (2021-2032)
Figure 18. South America Fortified Yogurt Revenue (USD Million) By Country (2021-2032)
Figure 19. Brazil Fortified Yogurt Revenue (USD Million) By Country (2021-2032)
Figure 20. Argentina Fortified Yogurt Revenue (USD Million) By Country (2021-2032)
Figure 21. Rest of Asia Pacific Fortified Yogurt Revenue (USD Million) By Country (2021-2032)
Figure 22. Middle East and Africa Fortified Yogurt Revenue (USD Million) By Region (2021-2032)
Figure 23. Saudi Arabia Fortified Yogurt Revenue (USD Million) By Region (2021-2032)
Figure 24. The UAE Fortified Yogurt Revenue (USD Million) By Region (2021-2032)
Figure 25. Rest of Middle East Fortified Yogurt Revenue (USD Million) By Region (2021-2032)
Figure 26. South Africa Fortified Yogurt Revenue (USD Million) By Region (2021-2032)
Figure 27. Africa Fortified Yogurt Revenue (USD Million) By Region (2021-2032)
Figure 28. North America Fortified Yogurt Revenue (USD Million) By Type (2021-2032)
Figure 29. North America Fortified Yogurt Revenue (USD Million) By Application (2021-2032)
Figure 30. North America Fortified Yogurt Revenue (USD Million) By Product (2021-2032)
Figure 31. Europe Fortified Yogurt Revenue (USD Million) By Type (2021-2032)
Figure 32. Europe Fortified Yogurt Revenue (USD Million) By Application (2021-2032)
Figure 33. Europe Fortified Yogurt Revenue (USD Million) By Product (2021-2032)
Figure 34. Asia Pacific Fortified Yogurt Revenue (USD Million) By Type (2021-2032)
Figure 35. Asia Pacific Fortified Yogurt Revenue (USD Million) By Application (2021-2032)
Figure 36. Asia Pacific Fortified Yogurt Revenue (USD Million) By Product (2021-2032)
Figure 37. South America Fortified Yogurt Revenue (USD Million) By Type (2021-2032)
Figure 38. South America Fortified Yogurt Revenue (USD Million) By Application (2021-2032)
Figure 39. South America Fortified Yogurt Revenue (USD Million) By Product (2021-2032)
Figure 40. Middle East and Africa Fortified Yogurt Revenue (USD Million) By Type (2021-2032)
Figure 41. Middle East and Africa Fortified Yogurt Revenue (USD Million) By Application (2021-2032)
Figure 42. Middle East and Africa Fortified Yogurt Revenue (USD Million) By Product (2021-2032)
By Type
Gluten Free
Lactose Free
Low Calories
Low Fat & Others
By Application
Supermarkets/Hypermarkets
Convenience Stores
Others
Countries Analyzed
North America (US, Canada, Mexico)
Europe (Germany, UK, France, Spain, Italy, Russia, Rest of Europe)
Asia Pacific (China, India, Japan, South Korea, Australia, South East Asia, Rest of Asia)
South America (Brazil, Argentina, Rest of South America)
Middle East and Africa (Saudi Arabia, UAE, Rest of Middle East, South Africa, Egypt, Rest of Africa)
