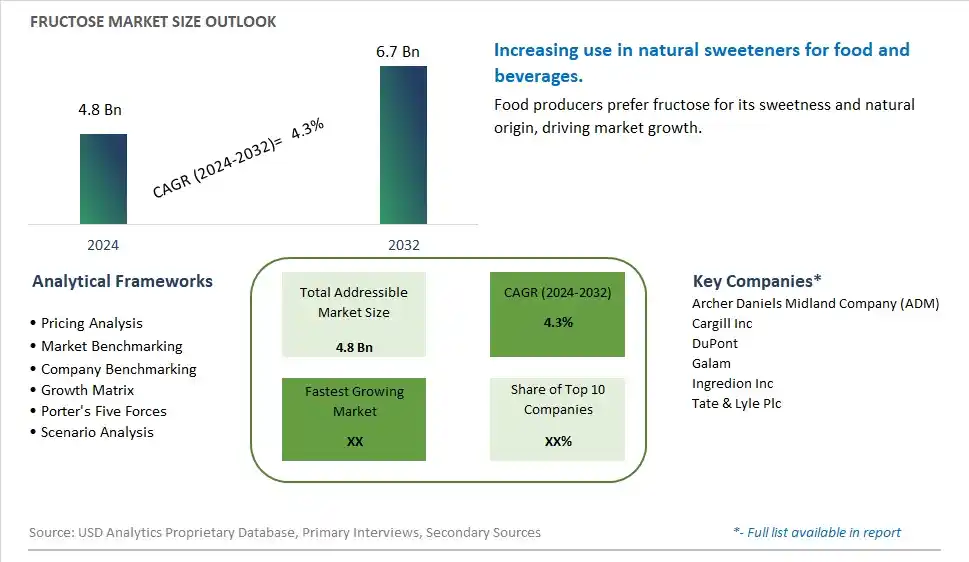
Global Fructose Market Size is valued at $4.8 Billion in 2024 and is forecast to register a growth rate (CAGR) of 4.3% to reach $6.7 Billion by 2032.
The global Fructose Market Comprehensive Study analyzes and forecasts the market size across 6 regions and 24 countries for diverse segments -By Product (High Fructose Corn Syrup, Fructose Syrups, Fructose Solids), By Application (Beverages, Processed Foods, Dairy Products, Confectionary, Bakery & Cereals, Others)
An Introduction to Fructose Market
In 2024, the fructose market is thriving, fueled by the demand for natural sweeteners that offer high sweetness and low glycemic impact. Fructose, derived from fruits and corn, is used in various food and beverage applications to provide sweetness and improve texture. The market benefits from advancements in extraction and processing technologies that enhance product purity and consistency. The trend towards clean label and natural ingredients is influencing product development. Increasing consumer interest in healthier sweetening options and the popularity of natural and low-calorie foods are further supporting market growth.
Fructose Competitive Landscape
The market report analyses the leading companies in the industry including Archer Daniels Midland Company (ADM), Cargill Inc, DuPont, Galam, Ingredion Inc, Tate & Lyle Plc, and Others.
Fructose Market Dynamics
Fructose Market Trend: Increasing Use in Low-Calorie and Natural Sweeteners
The most prominent trend in the Fructose Market is the increasing use in low-calorie and natural sweeteners. Consumers are seeking alternatives to traditional sugar that offer sweetness with fewer calories and a lower glycemic index. This trend is driven by the growing interest in reducing sugar intake and managing weight.
Fructose Market Driver: Health Consciousness and Demand for Natural Ingredients
A key driver in the Fructose Market is health consciousness and the demand for natural ingredients. As more individuals focus on avoiding synthetic additives and consuming natural foods, there is a rising demand for fructose derived from fruits and natural sources. This demand supports market growth as consumers seek healthier and more natural sweetening options.
Fructose Market Opportunity: Expansion into Functional Food and Beverage Applications
One significant opportunity in the Fructose Market lies in expansion into functional food and beverage applications. Companies can develop new products that utilize fructose in various formulations, such as energy drinks, health bars, and low-calorie desserts, offering consumers convenient and health-focused options. By highlighting the benefits and versatility of fructose, manufacturers can attract a broader consumer base and drive market growth.
Fructose Market Share Analysis- Largest Segment by Product
In the Fructose Market, High Fructose Corn Syrup (HFCS) is the largest segment. HFCS is widely used in the food and beverage industry due to its sweetness and cost-effectiveness compared to other sweeteners. Its high solubility and stability make it a popular choice for manufacturers of processed foods, beverages, and various confectioneries. The extensive use of HFCS in soft drinks, snacks, and baked goods underpins its position as the largest segment, supported by its broad application range and favorable production economics.
Fructose Market Share Analysis- Poised to Grow Fastest Over the Next Five Years by Application
The Beverages application in the Fructose Market is poised to grow the fastest over the next five years. The demand for fructose in beverages is driven by its high sweetness and ability to enhance flavor without the need for additional sugars or high-calorie sweeteners. As consumers increasingly seek low-calorie and naturally sweetened beverage options, fructose's role in formulating healthier drink alternatives becomes more prominent. The rise of functional drinks, flavored waters, and reduced-calorie beverages further propels the growth of fructose in this application, making it the fastest-growing segment.
Fructose Market Segmentation
By Product
High Fructose Corn Syrup
Fructose Syrups
Fructose Solids
By Application
Beverages
Processed Foods
Dairy Products
Confectionary
Bakery & Cereals
Others
Countries Analyzed
North America (US, Canada, Mexico)
Europe (Germany, UK, France, Spain, Italy, Russia, Rest of Europe)
Asia Pacific (China, India, Japan, South Korea, Australia, South East Asia, Rest of Asia)
South America (Brazil, Argentina, Rest of South America)
Middle East and Africa (Saudi Arabia, UAE, Rest of Middle East, South Africa, Egypt, Rest of Africa)
Fructose Companies Profiled in the Study
Archer Daniels Midland Company (ADM)
Cargill Inc
DuPont
Galam
Ingredion Inc
Tate & Lyle Plc
*- List Not Exhaustive
Chapter 1. TABLE OF CONTENTS
Chapter 2. Introduction to Fructose Market
2.1. Market Overview
2.2. Key Statistics and Report Highlights
2.3. Scope of the Comprehensive Study
2.3.1. Market Definition
2.3.2 Countries and Regions Covered
2.3.3 Research Objective
2.3.4 Units, Currency, and Conversions
2.3.5 Industry Value Chain
2.4. Key Market Segments
2.5. Key Companies
2.6. Study Period
Chapter 3. Strategic Analysis Review
3.1. Fructose Pricing Analysis and Forecast
3.2. Porter’s Five Forces
3.3. Market Ecosystem
3.4. SWOT Analysis
3.5. Regulatory Scenario
3.3. Effects of Inflation, Russia-Ukraine War, moderating economic growth, and other macroeconomic factors
Chapter 4. Competitive Landscape
4.1. Market Share Analysis
4.1.1. Global Fructose Market Share by Company, 2023
4.1.2. Product Offerings of Leading Fructose Companies
4.2. Market Entropy
4.2.1. New Product Launches in the Industry
4.2.2. Mergers, Acquisitions, Joint ventures, and Partnerships
4.3. Key Strategies and Best Practices
Chapter 5. Global Market Projections: Best, Reference, and Low Case Scenarios
5.1. Growth Analysis- Case Scenario Definitions
5.2. Low Growth Case Scenario Forecasts
5.3. Reference Growth Case Scenario Forecasts
5.4. High Growth Case Scenario Forecasts
Chapter 6. Market Dynamics
6.1. Fructose Market Drivers
6.2. Fructose Market Challenges
6.6. Fructose Market Opportunities
6.4. Fructose Market Trends
Chapter 7. Global Fructose Market Outlook Trends
7.1. Global Fructose Revenue (USD Million) and CAGR (%) by Type (2021-2032)
7.2. Global Fructose Revenue (USD Million) and CAGR (%) by Application (2021-2032)
7.3. Global Fructose Revenue (USD Million) and CAGR (%) by Product (2021-2032)
By Product
High Fructose Corn Syrup
Fructose Syrups
Fructose Solids
By Application
Beverages
Processed Foods
Dairy Products
Confectionary
Bakery & Cereals
Others
Chapter 8. Global Fructose Regional Analysis and Outlook
8.1. Global Fructose Revenue (USD Million) By Regions (2021- 2032)
8.2. North America Fructose Revenue (USD Million) by Country (2021-2032)
8.2.1. United States Fructose Regional Analysis and Outlook
8.2.2. Canada Fructose Regional Analysis and Outlook
8.2.3. Mexico Fructose Regional Analysis and Outlook
8.3. Europe Fructose Revenue (USD Million), by Country (2021-2032)
8.3.1. Germany Fructose Regional Analysis and Outlook
8.3.2. France Fructose Regional Analysis and Outlook
8.3.3. United Kingdom Fructose Regional Analysis and Outlook
8.3.4. Spain Fructose Regional Analysis and Outlook
8.3.5. Italy Fructose Regional Analysis and Outlook
8.3.6. Russia Fructose Regional Analysis and Outlook
8.3.7. Rest of Europe Fructose Regional Analysis and Outlook
8.4. Asia Pacific Fructose Revenue (USD Million) by Country (2021-2032)
8.4.1. China Fructose Regional Analysis and Outlook
8.4.2. Japan Fructose Regional Analysis and Outlook
8.4.3. India Fructose Regional Analysis and Outlook
8.4.4. South Korea Fructose Regional Analysis and Outlook
8.4.5. Australia Fructose Regional Analysis and Outlook
8.4.6. South East Asia Fructose Regional Analysis and Outlook
8.4.7. Rest of Asia Pacific Fructose Regional Analysis and Outlook
8.5. South America Fructose Revenue (USD Million), by Country (2021-2032)
8.5.1. Brazil Fructose Regional Analysis and Outlook
8.5.2. Argentina Fructose Regional Analysis and Outlook
8.5.3. Rest of South America Fructose Regional Analysis and Outlook
8.6. Middle East and Africa Fructose Revenue (USD Million) by Country (2021-2032)
8.6.1. Middle East Fructose Regional Analysis and Outlook
8.6.2. Africa Fructose Regional Analysis and Outlook
Chapter 9. North America Fructose Analysis and Outlook
9.1. North America Fructose Revenue (USD Million) by Segments (2021-2032)
9.1.1. North America Fructose Revenue (USD Million) by Type (2021-2032)
9.1.2. North America Fructose Revenue (USD Million) by Application (2021-2032)
9.1.3. North America Fructose Revenue (USD Million) by Product (2021-2032)
By Product
High Fructose Corn Syrup
Fructose Syrups
Fructose Solids
By Application
Beverages
Processed Foods
Dairy Products
Confectionary
Bakery & Cereals
Others
Chapter 10. Europe Fructose Analysis and Outlook
10.1. Europe Fructose Revenue (USD Million), by Segments (USD Million) (2021-2032)
10.1.1. Europe Fructose Revenue (USD Million) by Type (2021-2032)
10.1.2. Europe Fructose Revenue (USD Million) by Application (2021-2032)
10.1.3. Europe Fructose Revenue (USD Million) by Product (2021-2032)
By Product
High Fructose Corn Syrup
Fructose Syrups
Fructose Solids
By Application
Beverages
Processed Foods
Dairy Products
Confectionary
Bakery & Cereals
Others
Chapter 11. Asia Pacific Fructose Analysis and Outlook
11.1. Asia Pacific Fructose Revenue (USD Million), and Revenue (USD Million) by Segments (2021-2032)
11.1.1. Asia Pacific Fructose Revenue (USD Million) by Type (2021-2032)
11.1.2. Asia Pacific Fructose Revenue (USD Million) by Application (2021-2032)
11.1.3. Asia Pacific Fructose Revenue (USD Million) by Product (2021-2032)
By Product
High Fructose Corn Syrup
Fructose Syrups
Fructose Solids
By Application
Beverages
Processed Foods
Dairy Products
Confectionary
Bakery & Cereals
Others
Chapter 12. South America Fructose Analysis and Outlook
12.1. South America Fructose Revenue (USD Million), by Segments (2021-2032)
12.1.1. South America Fructose Revenue (USD Million) by Type (2021-2032)
12.1.2. South America Fructose Revenue (USD Million) by Application (2021-2032)
12.1.3. South America Fructose Revenue (USD Million) by Product (2021-2032)
By Product
High Fructose Corn Syrup
Fructose Syrups
Fructose Solids
By Application
Beverages
Processed Foods
Dairy Products
Confectionary
Bakery & Cereals
Others
Chapter 13. Middle East and Africa Fructose Analysis and Outlook
13.1. Middle East and Africa Fructose Revenue (USD Million), by Segments (2021-2032)
13.1.1. Middle East and Africa Fructose Revenue (USD Million) by Type (2021-2032)
13.1.2. Middle East and Africa Fructose Revenue (USD Million) by Application (2021-2032)
13.1.3. Middle East and Africa Fructose Revenue (USD Million) by Product (2021-2032)
By Product
High Fructose Corn Syrup
Fructose Syrups
Fructose Solids
By Application
Beverages
Processed Foods
Dairy Products
Confectionary
Bakery & Cereals
Others
Chapter 14. Fructose Company Profiles
14.1 Business Overview
14.2 Product Profiles
14.3 SWOT Profiles
14.5 Recent Developments
14.6 Financial Profile
List of Companies
Archer Daniels Midland Company (ADM)
Cargill Inc
DuPont
Galam
Ingredion Inc
Tate & Lyle Plc
15. Methodology and Data Sources
15.1 Customization Offerings
15.2 Subscription Services
15.3 Related Reports
15.4 Publisher Expertise
LIST OF TABLES
Table 1 Market Segmentation Analysis
Table 2 Global Fructose Market Share of Leading Companies, 2023
Table 3 Product Offerings of Leading Companies
Table 4 Low Growth Scenario Forecasts
Table 5 Reference Case Growth Scenario
Table 6 High Growth Case Scenario
Table 7 Global Fructose Revenue (USD Million) And CAGR (%) By Type (2021-2032)
Table 8 Global Fructose Revenue (USD Million) And CAGR (%) By Application (2021-2032)
Table 9 Global Fructose Revenue (USD Million) And CAGR (%) By Product (2021-2032)
Table 10 Global Fructose Market Revenue (USD Million) By Regions (2021-2032)
Table 11 Global Fructose Market Share (%) By Regions (2021-2032)
Table 12 North America Fructose Revenue (USD Million) By Country (2021-2032)
Table 13 Europe Fructose Revenue (USD Million) By Country (2021-2032)
Table 14 Asia Pacific Fructose Revenue (USD Million) By Country (2021-2032)
Table 15 South America Fructose Revenue (USD Million) By Country (2021-2032)
Table 16 Middle East and Africa Fructose Revenue (USD Million) By Region (2021-2032)
Table 17 North America Fructose Revenue (USD Million) By Type (2021-2032)
Table 18 North America Fructose Revenue (USD Million) By Application (2021-2032)
Table 19 North America Fructose Revenue (USD Million) By Product (2021-2032)
Table 20 Europe Fructose Revenue (USD Million) By Type (2021-2032)
Table 21 Europe Fructose Revenue (USD Million) By Application (2021-2032)
Table 22 Europe Fructose Revenue (USD Million) By Product (2021-2032)
Table 23 Asia Pacific Fructose Revenue (USD Million) By Type (2021-2032)
Table 24 Asia Pacific Fructose Revenue (USD Million) By Application (2021-2032)
Table 25 Asia Pacific Fructose Revenue (USD Million) By Product (2021-2032)
Table 26 South America Fructose Revenue (USD Million) By Type (2021-2032)
Table 27 South America Fructose Revenue (USD Million) By Application (2021-2032)
Table 28 South America Fructose Revenue (USD Million) By Product (2021-2032)
Table 29 Middle East and Africa Fructose Revenue (USD Million) By Type (2021-2032)
Table 30 Middle East and Africa Fructose Revenue (USD Million) By Application (2021-2032)
Table 31 Middle East and Africa Fructose Revenue (USD Million) By Product (2021-2032)
LIST OF FIGURES
Figure 1. Market Scope
Figure 2. Pricing Forecasts Per Unit, 2023- 2032
Figure 3. Porter’s Five Forces
Figure 4. Global Fructose Market Revenue (USD Million) By Regions (2021-2032)
Figure 5. Global Fructose Market Share (%) By Regions (2023)
Figure 6. North America Fructose Revenue (USD Million) By Country (2021-2032)
Figure 7. United States Fructose Revenue (USD Million) By Country (2021-2032)
Figure 8. Canada Fructose Revenue (USD Million) By Country (2021-2032)
Figure 9. Mexico Fructose Revenue (USD Million) By Country (2021-2032)
Figure 10. Europe Fructose Revenue (USD Million) By Country (2021-2032)
Figure 11. Germany Fructose Revenue (USD Million) By Country (2021-2032)
Figure 12. France Fructose Revenue (USD Million) By Country (2021-2032)
Figure 13. United Kingdom Fructose Revenue (USD Million) By Country (2021-2032)
Figure 14. Spain Fructose Revenue (USD Million) By Country (2021-2032)
Figure 15. Italy Fructose Revenue (USD Million) By Country (2021-2032)
Figure 16. Russia Fructose Revenue (USD Million) By Country (2021-2032)
Figure 17. Rest of Europe Fructose Revenue (USD Million) By Country (2021-2032)
Figure 11. Asia Pacific Fructose Revenue (USD Million) By Country (2021-2032)
Figure 12. China Fructose Revenue (USD Million) By Country (2021-2032)
Figure 13. Japan Fructose Revenue (USD Million) By Country (2021-2032)
Figure 14. India Fructose Revenue (USD Million) By Country (2021-2032)
Figure 15. South Korea Fructose Revenue (USD Million) By Country (2021-2032)
Figure 16. Australia Fructose Revenue (USD Million) By Country (2021-2032)
Figure 17. South East Asia Fructose Revenue (USD Million) By Country (2021-2032)
Figure 18. South America Fructose Revenue (USD Million) By Country (2021-2032)
Figure 19. Brazil Fructose Revenue (USD Million) By Country (2021-2032)
Figure 20. Argentina Fructose Revenue (USD Million) By Country (2021-2032)
Figure 21. Rest of Asia Pacific Fructose Revenue (USD Million) By Country (2021-2032)
Figure 22. Middle East and Africa Fructose Revenue (USD Million) By Region (2021-2032)
Figure 23. Saudi Arabia Fructose Revenue (USD Million) By Region (2021-2032)
Figure 24. The UAE Fructose Revenue (USD Million) By Region (2021-2032)
Figure 25. Rest of Middle East Fructose Revenue (USD Million) By Region (2021-2032)
Figure 26. South Africa Fructose Revenue (USD Million) By Region (2021-2032)
Figure 27. Africa Fructose Revenue (USD Million) By Region (2021-2032)
Figure 28. North America Fructose Revenue (USD Million) By Type (2021-2032)
Figure 29. North America Fructose Revenue (USD Million) By Application (2021-2032)
Figure 30. North America Fructose Revenue (USD Million) By Product (2021-2032)
Figure 31. Europe Fructose Revenue (USD Million) By Type (2021-2032)
Figure 32. Europe Fructose Revenue (USD Million) By Application (2021-2032)
Figure 33. Europe Fructose Revenue (USD Million) By Product (2021-2032)
Figure 34. Asia Pacific Fructose Revenue (USD Million) By Type (2021-2032)
Figure 35. Asia Pacific Fructose Revenue (USD Million) By Application (2021-2032)
Figure 36. Asia Pacific Fructose Revenue (USD Million) By Product (2021-2032)
Figure 37. South America Fructose Revenue (USD Million) By Type (2021-2032)
Figure 38. South America Fructose Revenue (USD Million) By Application (2021-2032)
Figure 39. South America Fructose Revenue (USD Million) By Product (2021-2032)
Figure 40. Middle East and Africa Fructose Revenue (USD Million) By Type (2021-2032)
Figure 41. Middle East and Africa Fructose Revenue (USD Million) By Application (2021-2032)
Figure 42. Middle East and Africa Fructose Revenue (USD Million) By Product (2021-2032)
By Product
High Fructose Corn Syrup
Fructose Syrups
Fructose Solids
By Application
Beverages
Processed Foods
Dairy Products
Confectionary
Bakery & Cereals
Others
Countries Analyzed
North America (US, Canada, Mexico)
Europe (Germany, UK, France, Spain, Italy, Russia, Rest of Europe)
Asia Pacific (China, India, Japan, South Korea, Australia, South East Asia, Rest of Asia)
South America (Brazil, Argentina, Rest of South America)
Middle East and Africa (Saudi Arabia, UAE, Rest of Middle East, South Africa, Egypt, Rest of Africa)
