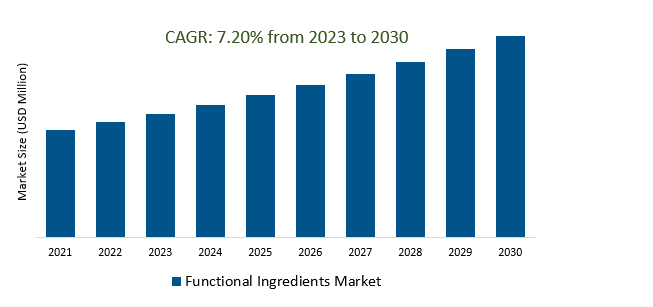
The Global Functional Ingredients Market Size is estimated to be US 88.9 Billion in 2023 and is poised to register 7.2% growth over the forecast period from 2023 to 2030 to reach US $ 144.63 billion in 2030.
The Functional Ingredients Market is driven by factors such as growing health consciousness, aging populations, rising chronic diseases, clean labels, convenience, evolving dietary preferences, personalized nutrition, microbiome health, CBD and hemp-based ingredients, functional beverages, clean label certification, sustainability, innovation in delivery formats, health and wellness in beauty, and regulatory changes. Consumers are increasingly seeking health-focused ingredients, such as probiotics, omega-3 fatty acids, and antioxidants, while the aging population and rising chronic diseases have created a larger market for these products. The demand for clean labels and natural ingredients has led to a shift away from synthetic additives and preservatives. The growing popularity of plant-based ingredients has also fuelled demand for these ingredients. The market is also influenced by the growing importance of sustainability and ethical sourcing.
Rising Health Consciousness Fuels Demand for Functional Ingredients like Probiotics, Omega-3s, and Antioxidants.
The growing awareness of the importance of health and well-being has ignited a surge in demand for functional ingredients within the global market. Consumers are increasingly seeking products that offer not just nutritional value but also specific health benefits. Probiotics, known for their digestive health advantages, omega-3 fatty acids, recognized for their heart and brain health benefits, and antioxidants, celebrated for their free-radical-fighting properties, have become particularly sought after. This shift towards health-conscious consumption is driven by a desire for preventive healthcare and a proactive approach to wellness. As a result, the functional ingredients market is experiencing robust growth, as consumers embrace products that align with their health-conscious lifestyles.
Rising Demand for Innovative Functional Ingredients in Convenience and Functional Foods is boosting the market.
The Functional Ingredients Market is experiencing a significant surge in demand, driven by the growing preference for innovative functional ingredients in both convenience and functional foods. Consumers are increasingly seeking products that not only offer convenience but also provide health benefits. This trend has led to the incorporation of cutting-edge functional ingredients in various food and beverage offerings, catering to a health-conscious customer base. These ingredients often include antioxidants, probiotics, vitamins, and minerals, among others, which enhance the nutritional profile and functional properties of the products. As a result, the functional ingredients market is thriving as manufacturers strive to meet the evolving tastes and preferences of consumers looking for healthier and more convenient food options.
The Surge in Vegetarianism and Veganism Driving Demand for Pea Protein and Plant-Based Antioxidants and attracting a wide range of customers.
The surge in vegetarianism and veganism is reshaping the landscape of the food industry, with a growing number of consumers adopting plant-based diets for health, environmental, and ethical reasons. This shift in dietary preferences has led to a significant increase in demand for plant-based protein sources, such as pea protein, which has become a staple ingredient in many vegan and vegetarian products. Additionally, consumers are increasingly seeking plant-based antioxidants for their perceived health benefits. This trend has created a burgeoning market for functional ingredients, as manufacturers and food producers aim to cater to this growing customer base. The appeal of plant-based diets and the health-consciousness associated with them are attracting a wide range of customers, from health enthusiasts to individuals looking for sustainable and cruelty-free food options. As a result, the functional ingredients market is witnessing robust growth, with innovation and product development centered around meeting the evolving demands of this expanding consumer segment.
Market Share Analysis:
Maltodextrin stands out as the reigning champion among functional ingredients in the market.
Maltodextrin’s unrivaled versatility and wide-ranging applications have solidified its dominance. This carbohydrate-based compound, derived from starch, has become a staple in various industries, including food and beverage, pharmaceuticals, and cosmetics. One of maltodextrin's key attributes is its ability to serve as a bulking agent, stabilizer, and thickener, enhancing the texture and mouthfeel of countless products. Its neutral flavor and excellent solubility make it a preferred choice for adding body to soups, sauces, and beverages, while also improving the shelf life of many perishable goods. Moreover, maltodextrin's usage in sports nutrition and as a convenient energy source has further propelled its market prominence. Its role in encapsulating Flavors and protecting sensitive ingredients in the pharmaceutical and cosmetic sectors has further cemented its position as the go-to functional ingredient. As consumer demands continue to evolve, maltodextrin remains at the forefront, continuously innovating to meet diverse industry needs.
Gut health stands as a prominent focus within the Functional Ingredients Market.
Functional ingredients are integrated into food and beverages to offer specialized health advantages beyond basic nutrition. These ingredients, sourced from diverse origins like plants, animals, and microorganisms, cater to the burgeoning interest in enhancing gut well-being. Among the most sought-after functional ingredients for gut health are probiotics, prebiotics, and fibre. Probiotics, resembling beneficial gut bacteria, exhibit various health benefits, including improved gut health, immune system enhancement, and decreased risk of chronic ailments. Prebiotics, non-digestible fibres, nourish probiotics and foster the growth of beneficial gut bacteria. Fiber, another crucial nutrient, aids in regulating digestion, promoting stool consistency, and nourishing the beneficial gut microbiota. The demand for gut health functional ingredients is propelled by increasing awareness of gut health's significance, rising digestive disorders, and the surge in plant-based diets rich in gut-friendly components like fibre and prebiotics.
Dairy Sources emerge as the undisputed leader within the Functional Ingredients Market.
Dairy Sources holds a commanding position due to its widespread utilization and diverse applications. This dominance can be attributed to the multifaceted nature of dairy-based ingredients, which are prized for their nutritional richness and versatility. In the food industry, dairy-derived functional ingredients are integral in creating a wide array of products, from creamy yogurts to fortified infant formulas. These ingredients provide essential nutrients like calcium, protein, and probiotics, making them crucial for maintaining optimal health and wellness. Moreover, they serve as stabilizers, emulsifiers, and texture enhancers in various culinary creations, ensuring product consistency and quality. In addition to their utility in traditional dairy products, these ingredients have found their way into non-dairy alternatives, catering to the growing demand for plant-based options. As consumers become more health-conscious, the demand for functional dairy ingredients, renowned for their fortifying properties, is expected to continue its upward trajectory, further solidifying its position at the forefront of the Functional Ingredients Market.
Plants are the predominant source of functional ingredients in the functional ingredients market, owing to several key factors.
Firstly, they offer a vast array of options, encompassing fruits, vegetables, herbs, and spices. Additionally, plants are a readily available and renewable resource, making them environmentally sustainable for functional ingredient production. Moreover, plant-derived functional ingredients tend to be cost-effective when compared to synthetic alternatives. Common examples of plant-based functional ingredients include essential vitamins (such as vitamins C, A, and K), essential minerals (like calcium, iron, and magnesium), antioxidants (including flavonoids and carotenoids), and dietary fiber, which contributes to digestive health and cholesterol reduction.
Functional Ingredients Market Segmentation
Type
- Maltodextrin
- Probiotics
- Polydextrose
- Modified starch
- Pectin
- Omega-3
- Omega-6
- Conjugated linoleic acid
- Rice protein
- Protein hydrolysate
- Mung bean protein
Health Benefits
- Gut Health
- Cardiovascular Health
- Bone Health
- Immunity Boosters
- Nutritive Health
- Weight Management
- Others
Application
- Infant Food
- Dairy Sources
- Bakery and Confectionery
- Snacks and Condiments
- Meat Sources
- Energy Drinks
- Juices
- Health Drinks
- Personal care
- Pharmaceuticals
- Animal feed
- Others
Source
- Animals
- Microbials
- Plants
- Synthetic Vitamins
- Synthetic Phytochemicals
- Synthetic Amino acids
- Synthetic Carotenoids
By Region
- North America (United States, Canada, Mexico)
- Europe (Germany, France, United Kingdom, Spain, Italy, Others)
- Asia Pacific (China, India, Japan, South Korea, Australia, Others)
- Latin America (Brazil, Argentina, Others)
- Middle East and Africa (Saudi Arabia, UAE, Kuwait, Other Middle East, South Africa, Nigeria, Other Africa)
Functional Ingredients Market Companies
- Cargill Inc
- BASF SE
- Archer Daniels Midland Company
- DuPoont
- Kerry Group
- Ajinomoto Co., Inc
- Ingredion Inc
- Tate and Lyle Plc
- Kemin Industries
- Roquette Freres
- CHR Hansen Holding AS
- Royal DSM NV
- Arla Foods Amba
*List not exhaustive
Functional Ingredients Market Outlook 2023
1 Market Overview
1.1 Introduction to the Functional Ingredients Market
1.2 Scope of the Study
1.3 Research Objective
1.3.1 Key Market Scope and Segments
1.3.2 Players Covered
1.3.3 Years Considered
2 Executive Summary
2.1 2023 Functional Ingredients Industry- Market Statistics
3 Market Dynamics
3.1 Market Drivers
3.2 Market Challenges
3.3 Market Opportunities
3.4 Market Trends
4 Market Factor Analysis
4.1 Porter’s Five Forces
4.2 Market Entropy
4.2.1 Global Functional Ingredients Market Companies with Area Served
4.2.2 Products Offerings Global Functional Ingredients Market
5 COVID-19 Impact Analysis and Outlook Scenarios
5.1.1 Covid-19 Impact Analysis
5.1.2 Post-COVID-19 Scenario- Low Growth Case
5.1.3 Post-COVID-19 Scenario- Reference Growth Case
5.1.4 Post-COVID-19 Scenario- Low Growth Case
6 Global Functional Ingredients Market Trends
6.1 Global Functional Ingredients Revenue (USD Million) and CAGR (%) by Type (2018-2030)
6.2 Global Functional Ingredients Revenue (USD Million) and CAGR (%) by Applications (2018-2030)
6.3 Global Functional Ingredients Revenue (USD Million) and CAGR (%) by Regions (2018-2030)
7 Global Functional Ingredients Market Revenue (USD Million) by Type, and Applications (2018-2022)
7.1 Global Functional Ingredients Revenue (USD Million) by Type (2018-2022)
7.1.1 Global Functional Ingredients Revenue (USD Million), Market Share (%) by Type (2018-2022)
7.2 Global Functional Ingredients Revenue (USD Million) by Applications (2018-2022)
7.2.1 Global Functional Ingredients Revenue (USD Million), Market Share (%) by Applications (2018-2022)
8 Global Functional Ingredients Development Regional Status and Outlook
8.1 Global Functional Ingredients Revenue (USD Million) By Regions (2018-2022)
8.2 North America Functional Ingredients Revenue (USD Million) by Type, and Application (2018-2022)
8.2.1 North America Functional Ingredients Revenue (USD Million) by Country (2018-2022)
8.2.2 North America Functional Ingredients Revenue (USD Million) by Type (2018-2022)
8.2.3 North America Functional Ingredients Revenue (USD Million) by Applications (2018-2022)
8.3 Europe Functional Ingredients Revenue (USD Million), by Type, and Applications (USD Million) (2018-2022)
8.3.1 Europe Functional Ingredients Revenue (USD Million), by Country (2018-2022)
8.3.2 Europe Functional Ingredients Revenue (USD Million) by Type (2018-2022)
8.3.3 Europe Functional Ingredients Revenue (USD Million) by Applications (2018-2022)
8.4 Asia Pacific Functional Ingredients Revenue (USD Million), and Revenue (USD Million) by Type, and Applications (2018-2022)
8.4.1 Asia Pacific Functional Ingredients Revenue (USD Million) by Country (2018-2022)
8.4.2 Asia Pacific Functional Ingredients Revenue (USD Million) by Type (2018-2022)
8.4.3 Asia Pacific Functional Ingredients Revenue (USD Million) by Applications (2018-2022)
8.5 South America Functional Ingredients Revenue (USD Million), by Type, and Applications (2018-2022)
8.5.1 South America Functional Ingredients Revenue (USD Million), by Country (2018-2022)
8.5.2 South America Functional Ingredients Revenue (USD Million) by Type (2018-2022)
8.5.3 South America Functional Ingredients Revenue (USD Million) by Applications (2018-2022)
8.6 Middle East and Africa Functional Ingredients Revenue (USD Million), by Type, Technology, Application, Thickness (2018-2022)
8.6.1 Middle East and Africa Functional Ingredients Revenue (USD Million) by Country (2018-2022)
8.6.2 Middle East and Africa Functional Ingredients Revenue (USD Million) by Type (2018-2022)
8.6.3 Middle East and Africa Functional Ingredients Revenue (USD Million) by Applications (2018-2022)
9 Company Profiles
10 Global Functional Ingredients Market Revenue (USD Million), by Type, and Applications (2023-2030)
10.1 Global Functional Ingredients Revenue (USD Million) and Market Share (%) by Type (2023-2030)
10.1.1 Global Functional Ingredients Revenue (USD Million), and Market Share (%) by Type (2023-2030)
10.2 Global Functional Ingredients Revenue (USD Million) and Market Share (%) by Applications (2023-2030)
10.2.1 Global Functional Ingredients Revenue (USD Million), and Market Share (%) by Applications (2023-2030)
11 Global Functional Ingredients Development Regional Status and Outlook Forecast
11.1 Global Functional Ingredients Revenue (USD Million) By Regions (2023-2030)
11.2 North America Functional Ingredients Revenue (USD Million) by Type, and Applications (2023-2030)
11.2.1 North America Functional Ingredients Revenue (USD) Million by Country (2023-2030)
11.2.2 North America Functional Ingredients Revenue (USD Million), by Type (2023-2030)
11.2.3 North America Functional Ingredients Revenue (USD Million), Market Share (%) by Applications (2023-2030)
11.3 Europe Functional Ingredients Revenue (USD Million), by Type, and Applications (2023-2030)
11.3.1 Europe Functional Ingredients Revenue (USD Million), by Country (2023-2030)
11.3.2 Europe Functional Ingredients Revenue (USD Million), by Type (2023-2030)
11.3.3 Europe Functional Ingredients Revenue (USD Million), by Applications (2023-2030)
11.4 Asia Pacific Functional Ingredients Revenue (USD Million) by Type, and Applications (2023-2030)
11.4.1 Asia Pacific Functional Ingredients Revenue (USD Million), by Country (2023-2030)
11.4.2 Asia Pacific Functional Ingredients Revenue (USD Million), by Type (2023-2030)
11.4.3 Asia Pacific Functional Ingredients Revenue (USD Million), by Applications (2023-2030)
11.5 South America Functional Ingredients Revenue (USD Million), by Type, and Applications (2023-2030)
11.5.1 South America Functional Ingredients Revenue (USD Million), by Country (2023-2030)
11.5.2 South America Functional Ingredients Revenue (USD Million), by Type (2023-2030)
11.5.3 South America Functional Ingredients Revenue (USD Million), by Applications (2023-2030)
11.6 Middle East and Africa Functional Ingredients Revenue (USD Million), by Type, and Applications (2023-2030)
11.6.1 Middle East and Africa Functional Ingredients Revenue (USD Million), by Region (2023-2030)
11.6.2 Middle East and Africa Functional Ingredients Revenue (USD Million), by Type (2023-2030)
11.6.3 Middle East and Africa Functional Ingredients Revenue (USD Million), by Applications (2023-2030)
12 Methodology and Data Sources
12.1 Methodology/Research Approach
12.1.1 Research Programs/Design
12.1.2 Market Size Estimation
12.1.3 Market Breakdown and Data Triangulation
12.2 Data Sources
12.2.1 Secondary Sources
12.2.2 Primary Sources
12.3 Disclaimer
List of Tables
Table 1 Market Segmentation Analysis
Table 2 Global Functional Ingredients Market Companies with Areas Served
Table 3 Products Offerings Global Functional Ingredients Market
Table 4 Low Growth Scenario Forecasts
Table 5 Reference Case Growth Scenario
Table 6 High Growth Case Scenario
Table 7 Global Functional Ingredients Revenue (USD Million) And CAGR (%) By Type (2018-2030)
Table 8 Global Functional Ingredients Revenue (USD Million) And CAGR (%) By Applications (2018-2030)
Table 9 Global Functional Ingredients Revenue (USD Million) And CAGR (%) By Regions (2018-2030)
Table 10 Global Functional Ingredients Revenue (USD Million) By Type (2018-2022)
Table 11 Global Functional Ingredients Revenue Market Share (%) By Type (2018-2022)
Table 12 Global Functional Ingredients Revenue (USD Million) By Applications (2018-2022)
Table 13 Global Functional Ingredients Revenue Market Share (%) By Applications (2018-2022)
Table 14 Global Functional Ingredients Market Revenue (USD Million) By Regions (2018-2022)
Table 15 Global Functional Ingredients Market Share (%) By Regions (2018-2022)
Table 16 North America Functional Ingredients Revenue (USD Million) By Country (2018-2022)
Table 17 North America Functional Ingredients Revenue (USD Million) By Type (2018-2022)
Table 18 North America Functional Ingredients Revenue (USD Million) By Applications (2018-2022)
Table 19 Europe Functional Ingredients Revenue (USD Million) By Country (2018-2022)
Table 20 Europe Functional Ingredients Revenue (USD Million) By Type (2018-2022)
Table 21 Europe Functional Ingredients Revenue (USD Million) By Applications (2018-2022)
Table 22 Asia Pacific Functional Ingredients Revenue (USD Million) By Country (2018-2022)
Table 23 Asia Pacific Functional Ingredients Revenue (USD Million) By Type (2018-2022)
Table 24 Asia Pacific Functional Ingredients Revenue (USD Million) By Applications (2018-2022)
Table 25 South America Functional Ingredients Revenue (USD Million) By Country (2018-2022)
Table 26 South America Functional Ingredients Revenue (USD Million) By Type (2018-2022)
Table 27 South America Functional Ingredients Revenue (USD Million) By Applications (2018-2022)
Table 28 Middle East and Africa Functional Ingredients Revenue (USD Million) By Region (2018-2022)
Table 29 Middle East and Africa Functional Ingredients Revenue (USD Million) By Type (2018-2022)
Table 30 Middle East and Africa Functional Ingredients Revenue (USD Million) By Applications (2018-2022)
Table 31 Financial Analysis
Table 32 Global Functional Ingredients Revenue (USD Million) By Type (2023-2030)
Table 33 Global Functional Ingredients Revenue Market Share (%) By Type (2023-2030)
Table 34 Global Functional Ingredients Revenue (USD Million) By Applications (2023-2030)
Table 35 Global Functional Ingredients Revenue Market Share (%) By Applications (2023-2030)
Table 36 Global Functional Ingredients Market Revenue (USD Million), And Revenue (USD Million) By Regions (2023-2030)
Table 37 North America Functional Ingredients Revenue (USD)By Country (2023-2030)
Table 38 North America Functional Ingredients Revenue (USD Million) By Type (2023-2030)
Table 39 North America Functional Ingredients Revenue (USD Million) By Applications (2023-2030)
Table 40 Europe Functional Ingredients Revenue (USD Million) By Country (2023-2030)
Table 41 Europe Functional Ingredients Revenue (USD Million) By Type (2023-2030)
Table 42 Europe Functional Ingredients Revenue (USD Million) By Applications (2023-2030)
Table 43 Asia Pacific Functional Ingredients Revenue (USD Million) By Country (2023-2030)
Table 44 Asia Pacific Functional Ingredients Revenue (USD Million) By Type (2023-2030)
Table 45 Asia Pacific Functional Ingredients Revenue (USD Million) By Applications (2023-2030)
Table 46 South America Functional Ingredients Revenue (USD Million) By Country (2023-2030)
Table 47 South America Functional Ingredients Revenue (USD Million) By Type (2023-2030)
Table 48 South America Functional Ingredients Revenue (USD Million) By Applications (2023-2030)
Table 49 Middle East and Africa Functional Ingredients Revenue (USD Million) By Region (2023-2030)
Table 50 Middle East and Africa Functional Ingredients Revenue (USD Million) By Region (2023-2030)
Table 51 Middle East and Africa Functional Ingredients Revenue (USD Million) By Type (2023-2030)
Table 52 Middle East and Africa Functional Ingredients Revenue (USD Million) By Applications (2023-2030)
Table 53 Research Programs/Design for This Report
Table 54 Key Data Information from Secondary Sources
Table 55 Key Data Information from Primary Sources
List of Figures
Figure 1 Market Scope
Figure 2 Porter’s Five Forces
Figure 3 Global Functional Ingredients Revenue (USD Million) By Type (2018-2022)
Figure 4 Global Functional Ingredients Revenue Market Share (%) By Type (2022)
Figure 5 Global Functional Ingredients Revenue (USD Million) By Applications (2018-2022)
Figure 6 Global Functional Ingredients Revenue Market Share (%) By Applications (2022)
Figure 7 Global Functional Ingredients Market Revenue (USD Million) By Regions (2018-2022)
Figure 8 Global Functional Ingredients Market Share (%) By Regions (2022)
Figure 9 North America Functional Ingredients Revenue (USD Million) By Country (2018-2022)
Figure 10 North America Functional Ingredients Revenue (USD Million) By Type (2018-2022)
Figure 11 North America Functional Ingredients Revenue (USD Million) By Applications (2018-2022)
Figure 12 Europe Functional Ingredients Revenue (USD Million) By Country (2018-2022)
Figure 13 Europe Functional Ingredients Revenue (USD Million) By Type (2018-2022)
Figure 14 Europe Functional Ingredients Revenue (USD Million) By Applications (2018-2022)
Figure 15 Asia Pacific Functional Ingredients Revenue (USD Million) By Country (2018-2022)
Figure 16 Asia Pacific Functional Ingredients Revenue (USD Million) By Type (2018-2022)
Figure 17 Asia Pacific Functional Ingredients Revenue (USD Million) By Applications (2018-2022)
Figure 18 South America Functional Ingredients Revenue (USD Million) By Country (2018-2022)
Figure 19 South America Functional Ingredients Revenue (USD Million) By Type (2018-2022)
Figure 20 South America Functional Ingredients Revenue (USD Million) By Applications (2018-2022)
Figure 21 Middle East and Africa Functional Ingredients Revenue (USD Million) By Region (2018-2022)
Figure 22 Middle East and Africa Functional Ingredients Revenue (USD Million) By Type (2018-2022)
Figure 23 Middle East and Africa Functional Ingredients Revenue (USD Million) By Applications (2018-2022)
Figure 24 Global Functional Ingredients Revenue (USD Million) By Type (2023-2030)
Figure 25 Global Functional Ingredients Revenue Market Share (%) By Type (2030)
Figure 26 Global Functional Ingredients Revenue (USD Million) By Applications (2023-2030)
Figure 27 Global Functional Ingredients Revenue Market Share (%) By Applications (2030)
Figure 28 Global Functional Ingredients Market Revenue (USD Million) By Regions (2023-2030)
Figure 29 North America Functional Ingredients Revenue (USD Million) By Country (2023-2030)
Figure 30 North America Functional Ingredients Revenue (USD Million) By Type (2023-2030)
Figure 31 North America Functional Ingredients Revenue (USD Million) By Applications (2023-2030)
Figure 32 Europe Functional Ingredients Revenue (USD Million) By Country (2023-2030)
Figure 33 Europe Functional Ingredients Revenue (USD Million) By Type (2023-2030)
Figure 34 Europe Functional Ingredients Revenue (USD Million) By Applications (2023-2030)
Figure 35 Asia Pacific Functional Ingredients Revenue (USD Million) By Country (2023-2030)
Figure 36 Asia Pacific Functional Ingredients Revenue (USD Million) By Type (2023-2030)
Figure 37 Asia Pacific Functional Ingredients Revenue (USD Million) By Applications (2023-2030)
Figure 38 South America Functional Ingredients Revenue (USD Million) By Country (2023-2030)
Figure 39 South America Functional Ingredients Revenue (USD Million) By Type (2023-2030)
Figure 40 South America Functional Ingredients Revenue (USD Million) By Applications (2023-2030)
Figure 41 Middle East and Africa Functional Ingredients Revenue (USD Million) By Region (2023-2030)
Figure 42 Middle East and Africa Functional Ingredients Revenue (USD Million) By Region (2023-2030)
Figure 43 Middle East and Africa Functional Ingredients Revenue (USD Million) By Type (2023-2030)
Figure 44 Middle East and Africa Functional Ingredients Revenue (USD Million) By Applications (2023-2030)
Figure 45 Bottom-Up and Top-Down Approaches For This Report
Figure 46 Data Triangulation
