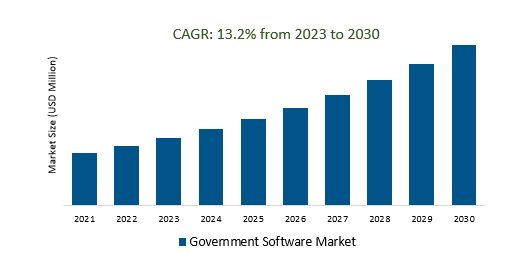
The Global Government Software Market Size is estimated to register 13.2% growth over the forecast period from 2023 to 2030 .
The market growth is driven by the increasing threat of cyberattacks and data breaches is a significant driver for government software investment, particularly in security-related software. Leading companies that are focused on Digital Transformation Acceleration, Cybersecurity Emphasis, Blockchain for Transparency, Smart Cities and IoT, Environmental Sustainability, Healthcare and Pandemic Preparedness, and others to boost market shares in the industry.
Market Overview
The Government Software Market encompasses software solutions and services tailored for government agencies, aiming to modernize operations, enhance service delivery, improve efficiency, and meet security and regulatory requirements. Key segments include e-government solutions, cybersecurity software, data analytics, ERP, and specialized applications for healthcare, social services, and emergency management. Notable players include SAP, Microsoft, Oracle, and IBM, while trends such as digital transformation, open data initiatives, and cybersecurity focus shape the market.
Market Dynamics
Market Trends - AI and Machine Learning for Government Efficiency
AI and Machine Learning are pivotal in the Government Software Market, driving government efficiency by enabling data-driven decision-making, automating tasks, and enhancing service delivery. These technologies find applications in predictive analytics, natural language processing, and cybersecurity, empowering governments to streamline operations, reduce costs, and provide more responsive services, thereby modernizing public sector governance.
Market Driver- Digital Transformation Demand Government Software Market
Digital transformation is a significant driver of demand in the Government Software Market, fueled by governments' imperative to modernize operations, improve service delivery, and enhance efficiency. As governments increasingly prioritize technology adoption, the market experiences rising demand for software solutions that facilitate the digitization of government services, streamline processes, support remote work, and promote data-driven decision-making.
Market Opportunity-Introduction of Cybersecurity
Cybersecurity is paramount in the Government Software Market, driven by the imperative to safeguard sensitive data and critical infrastructure from escalating cyber threats. Government agencies heavily invest in cybersecurity software to protect information, and national security, and ensure compliance. As cyberattacks advance, the demand for advanced cybersecurity measures remains high, focusing on threat detection, incident response, and data encryption to bolster government defenses against cyber threats.
Market Share Analysis- Cloud Based Government Software Market will register the fastest growth
The Global Government Software Market is analyzed across On-Premise, Cloud-based, Wed-based, and others. Cloud Based is poised to register the fastest growth. Cloud-based solutions are pivotal in the Government Software Market, offering government agencies scalable, cost-effective, and flexible options for software deployment and service delivery. Governments increasingly embrace cloud computing to streamline operations, enhance data accessibility, and improve resource management. This trend towards cloud adoption is expected to persist, with governments seeking secure and compliant cloud solutions that support their digital transformation initiatives, ensuring more agile and responsive public services.
Market Share Analysis- Annual held a significant market share in 2023
The Global Government Software Market is analyzed across various Subscription including Monthly, Quarterly, Annual, and others. Of these, Annual held a significant market share in 2023.
Annually, the Government Software Market demonstrates growth driven by governments' commitment to modernize operations and improve public services. Investments increase in digital transformation, cybersecurity, and data analytics, with a rising demand for cloud-based solutions and AI. The market adapts to emerging technologies and evolving regulations, maintaining a focus on innovation, efficiency, and citizen-centric services.
Government Software Market Segmentation
By Type
- On-Premise
- Web-based
- Cloud-based
By Subscription
By Application
- Government
- Social Organizations
- Others
By Region
- North America (United States, Canada, Mexico)
- Europe (Germany, France, United Kingdom, Spain, Italy, Others)
- Asia Pacific (China, India, Japan, South Korea, Australia, Others)
- Latin America (Brazil, Argentina, Others)
- Middle East and Africa (Saudi Arabia, UAE, Kuwait, Other Middle East, South Africa, Nigeria, Other Africa)
Government Software Market Companies
- SAS Institute (United States)
- Oracle Corporation (United States)
- Constellation Software Inc. (Canada)
- Microsoft Corporation (United States)
- SAP SE (Germany)
- Infor Inc (United States)
- Civica Group (United Kingdom)
- UNIT4 (The Netherlands)
- IBM Corporation (United States)
- Tyler Technologies Inc (United States)
*List not exhaustive
Government Software Market Outlook 2023
1 Market Overview
1.1 Introduction to the Government Software Market
1.2 Scope of the Study
1.3 Research Objective
1.3.1 Key Market Scope and Segments
1.3.2 Players Covered
1.3.3 Years Considered
2 Executive Summary
2.1 2023 Government Software Industry- Market Statistics
3 Market Dynamics
3.1 Market Drivers
3.2 Market Challenges
3.3 Market Opportunities
3.4 Market Trends
4 Market Factor Analysis
4.1 Porter’s Five Forces
4.2 Market Entropy
4.2.1 Global Government Software Market Companies with Area Served
4.2.2 Products Offerings Global Government Software Market
5 COVID-19 Impact Analysis and Outlook Scenarios
5.1.1 Covid-19 Impact Analysis
5.1.2 post-COVID-19 Scenario- Low Growth Case
5.1.3 post-COVID-19 Scenario- Reference Growth Case
5.1.4 post-COVID-19 Scenario- Low Growth Case
6 Global Government Software Market Trends
6.1 Global Government Software Revenue (USD Million) and CAGR (%) by Type (2018-2030)
6.2 Global Government Software Revenue (USD Million) and CAGR (%) by Applications (2018-2030)
6.3 Global Government Software Revenue (USD Million) and CAGR (%) by regions (2018-2030)
7 Global Government Software Market Revenue (USD Million) by Type, and Applications (2018-2022)
7.1 Global Government Software Revenue (USD Million) by Type (2018-2022)
7.1.1 Global Government Software Revenue (USD Million), Market Share (%) by Type (2018-2022)
7.2 Global Government Software Revenue (USD Million) by Applications (2018-2022)
7.2.1 Global Government Software Revenue (USD Million), Market Share (%) by Applications (2018-2022)
8 Global Government Software Development Regional Status and Outlook
8.1 Global Government Software Revenue (USD Million) By Regions (2018-2022)
8.2 North America Government Software Revenue (USD Million) by Type, and Application (2018-2022)
8.2.1 North America Government Software Revenue (USD Million) by Country (2018-2022)
8.2.2 North America Government Software Revenue (USD Million) by Type (2018-2022)
8.2.3 North America Government Software Revenue (USD Million) by Applications (2018-2022)
8.3 Europe Government Software Revenue (USD Million), by Type, and Applications (USD Million) (2018-2022)
8.3.1 Europe Government Software Revenue (USD Million), by Country (2018-2022)
8.3.2 Europe Government Software Revenue (USD Million) by Type (2018-2022)
8.3.3 Europe Government Software Revenue (USD Million) by Applications (2018-2022)
8.4 Asia Pacific Government Software Revenue (USD Million), and Revenue (USD Million) by Type, and Applications (2018-2022)
8.4.1 Asia Pacific Government Software Revenue (USD Million) by Country (2018-2022)
8.4.2 Asia Pacific Government Software Revenue (USD Million) by Type (2018-2022)
8.4.3 Asia Pacific Government Software Revenue (USD Million) by Applications (2018-2022)
8.5 South America Government Software Revenue (USD Million), by Type, and Applications (2018-2022)
8.5.1 South America Government Software Revenue (USD Million), by Country (2018-2022)
8.5.2 South America Government Software Revenue (USD Million) by Type (2018-2022)
8.5.3 South America Government Software Revenue (USD Million) by Applications (2018-2022)
8.6 Middle East and Africa Government Software Revenue (USD Million), by Type, Technology, Application, Thickness (2018-2022)
8.6.1 Middle East and Africa Government Software Revenue (USD Million) by Country (2018-2022)
8.6.2 Middle East and Africa Government Software Revenue (USD Million) by Type (2018-2022)
8.6.3 Middle East and Africa Government Software Revenue (USD Million) by Applications (2018-2022)
9 Company Profiles
10 Global Government Software Market Revenue (USD Million), by Type, and Applications (2023-2030)
10.1 Global Government Software Revenue (USD Million) and Market Share (%) by Type (2023-2030)
10.1.1 Global Government Software Revenue (USD Million), and Market Share (%) by Type (2023-2030)
10.2 Global Government Software Revenue (USD Million) and Market Share (%) by Applications (2023-2030)
10.2.1 Global Government Software Revenue (USD Million), and Market Share (%) by Applications (2023-2030)
11 Global Government Software Development Regional Status and Outlook Forecast
11.1 Global Government Software Revenue (USD Million) By Regions (2023-2030)
11.2 North America Government Software Revenue (USD Million) by Type, and Applications (2023-2030)
11.2.1 North America Government Software Revenue (USD) Million by Country (2023-2030)
11.2.2 North America Government Software Revenue (USD Million), by Type (2023-2030)
11.2.3 North America Government Software Revenue (USD Million), Market Share (%) by Applications (2023-2030)
11.3 Europe Government Software Revenue (USD Million), by Type, and Applications (2023-2030)
11.3.1 Europe Government Software Revenue (USD Million), by Country (2023-2030)
11.3.2 Europe Government Software Revenue (USD Million), by Type (2023-2030)
11.3.3 Europe Government Software Revenue (USD Million), by Applications (2023-2030)
11.4 Asia Pacific Government Software Revenue (USD Million) by Type, and Applications (2023-2030)
11.4.1 Asia Pacific Government Software Revenue (USD Million), by Country (2023-2030)
11.4.2 Asia Pacific Government Software Revenue (USD Million), by Type (2023-2030)
11.4.3 Asia Pacific Government Software Revenue (USD Million), by Applications (2023-2030)
11.5 South America Government Software Revenue (USD Million), by Type, and Applications (2023-2030)
11.5.1 South America Government Software Revenue (USD Million), by Country (2023-2030)
11.5.2 South America Government Software Revenue (USD Million), by Type (2023-2030)
11.5.3 South America Government Software Revenue (USD Million), by Applications (2023-2030)
11.6 Middle East and Africa Government Software Revenue (USD Million), by Type, and Applications (2023-2030)
11.6.1 Middle East and Africa Government Software Revenue (USD Million), by region (2023-2030)
11.6.2 Middle East and Africa Government Software Revenue (USD Million), by Type (2023-2030)
11.6.3 Middle East and Africa Government Software Revenue (USD Million), by Applications (2023-2030)
12 Methodology and Data Sources
12.1 Methodology/Research Approach
12.1.1 Research Programs/Design
12.1.2 Market Size Estimation
12.1.3 Market Breakdown and Data Triangulation
12.2 Data Sources
12.2.1 Secondary Sources
12.2.2 Primary Sources
12.3 Disclaimer
List of Tables
Table 1 Market Segmentation Analysis
Table 2 Global Government Software Market Companies with Areas Served
Table 3 Products Offerings Global Government Software Market
Table 4 Low Growth Scenario Forecasts
Table 5 Reference Case Growth Scenario
Table 6 High Growth Case Scenario
Table 7 Global Government Software Revenue (USD Million) And CAGR (%) By Type (2018-2030)
Table 8 Global Government Software Revenue (USD Million) And CAGR (%) By Applications (2018-2030)
Table 9 Global Government Software Revenue (USD Million) And CAGR (%) By Regions (2018-2030)
Table 10 Global Government Software Revenue (USD Million) By Type (2018-2022)
Table 11 Global Government Software Revenue Market Share (%) By Type (2018-2022)
Table 12 Global Government Software Revenue (USD Million) By Applications (2018-2022)
Table 13 Global Government Software Revenue Market Share (%) By Applications (2018-2022)
Table 14 Global Government Software Market Revenue (USD Million) By Regions (2018-2022)
Table 15 Global Government Software Market Share (%) By Regions (2018-2022)
Table 16 North America Government Software Revenue (USD Million) By Country (2018-2022)
Table 17 North America Government Software Revenue (USD Million) By Type (2018-2022)
Table 18 North America Government Software Revenue (USD Million) By Applications (2018-2022)
Table 19 Europe Government Software Revenue (USD Million) By Country (2018-2022)
Table 20 Europe Government Software Revenue (USD Million) By Type (2018-2022)
Table 21 Europe Government Software Revenue (USD Million) By Applications (2018-2022)
Table 22 Asia Pacific Government Software Revenue (USD Million) By Country (2018-2022)
Table 23 Asia Pacific Government Software Revenue (USD Million) By Type (2018-2022)
Table 24 Asia Pacific Government Software Revenue (USD Million) By Applications (2018-2022)
Table 25 South America Government Software Revenue (USD Million) By Country (2018-2022)
Table 26 South America Government Software Revenue (USD Million) By Type (2018-2022)
Table 27 South America Government Software Revenue (USD Million) By Applications (2018-2022)
Table 28 Middle East and Africa Government Software Revenue (USD Million) By Region (2018-2022)
Table 29 Middle East and Africa Government Software Revenue (USD Million) By Type (2018-2022)
Table 30 Middle East and Africa Government Software Revenue (USD Million) By Applications (2018-2022)
Table 31 Financial Analysis
Table 32 Global Government Software Revenue (USD Million) By Type (2023-2030)
Table 33 Global Government Software Revenue Market Share (%) By Type (2023-2030)
Table 34 Global Government Software Revenue (USD Million) By Applications (2023-2030)
Table 35 Global Government Software Revenue Market Share (%) By Applications (2023-2030)
Table 36 Global Government Software Market Revenue (USD Million), And Revenue (USD Million) By Regions (2023-2030)
Table 37 North America Government Software Revenue (USD)By Country (2023-2030)
Table 38 North America Government Software Revenue (USD Million) By Type (2023-2030)
Table 39 North America Government Software Revenue (USD Million) By Applications (2023-2030)
Table 40 Europe Government Software Revenue (USD Million) By Country (2023-2030)
Table 41 Europe Government Software Revenue (USD Million) By Type (2023-2030)
Table 42 Europe Government Software Revenue (USD Million) By Applications (2023-2030)
Table 43 Asia Pacific Government Software Revenue (USD Million) By Country (2023-2030)
Table 44 Asia Pacific Government Software Revenue (USD Million) By Type (2023-2030)
Table 45 Asia Pacific Government Software Revenue (USD Million) By Applications (2023-2030)
Table 46 South America Government Software Revenue (USD Million) By Country (2023-2030)
Table 47 South America Government Software Revenue (USD Million) By Type (2023-2030)
Table 48 South America Government Software Revenue (USD Million) By Applications (2023-2030)
Table 49 Middle East and Africa Government Software Revenue (USD Million) By Region (2023-2030)
Table 50 Middle East and Africa Government Software Revenue (USD Million) By Region (2023-2030)
Table 51 Middle East and Africa Government Software Revenue (USD Million) By Type (2023-2030)
Table 52 Middle East and Africa Government Software Revenue (USD Million) By Applications (2023-2030)
Table 53 Research Programs/Design for This Report
Table 54 Key Data Information from Secondary Sources
Table 55 Key Data Information from Primary Sources
List of Figures
Figure 1 Market Scope
Figure 2 Porter’s Five Forces
Figure 3 Global Government Software Revenue (USD Million) By Type (2018-2022)
Figure 4 Global Government Software Revenue Market Share (%) By Type (2022)
Figure 5 Global Government Software Revenue (USD Million) By Applications (2018-2022)
Figure 6 Global Government Software Revenue Market Share (%) By Applications (2022)
Figure 7 Global Government Software Market Revenue (USD Million) By Regions (2018-2022)
Figure 8 Global Government Software Market Share (%) By Regions (2022)
Figure 9 North America Government Software Revenue (USD Million) By Country (2018-2022)
Figure 10 North America Government Software Revenue (USD Million) By Type (2018-2022)
Figure 11 North America Government Software Revenue (USD Million) By Applications (2018-2022)
Figure 12 Europe Government Software Revenue (USD Million) By Country (2018-2022)
Figure 13 Europe Government Software Revenue (USD Million) By Type (2018-2022)
Figure 14 Europe Government Software Revenue (USD Million) By Applications (2018-2022)
Figure 15 Asia Pacific Government Software Revenue (USD Million) By Country (2018-2022)
Figure 16 Asia Pacific Government Software Revenue (USD Million) By Type (2018-2022)
Figure 17 Asia Pacific Government Software Revenue (USD Million) By Applications (2018-2022)
Figure 18 South America Government Software Revenue (USD Million) By Country (2018-2022)
Figure 19 South America Government Software Revenue (USD Million) By Type (2018-2022)
Figure 20 South America Government Software Revenue (USD Million) By Applications (2018-2022)
Figure 21 Middle East and Africa Government Software Revenue (USD Million) By Region (2018-2022)
Figure 22 Middle East and Africa Government Software Revenue (USD Million) By Type (2018-2022)
Figure 23 Middle East and Africa Government Software Revenue (USD Million) By Applications (2018-2022)
Figure 24 Global Government Software Revenue (USD Million) By Type (2023-2030)
Figure 25 Global Government Software Revenue Market Share (%) By Type (2030)
Figure 26 Global Government Software Revenue (USD Million) By Applications (2023-2030)
Figure 27 Global Government Software Revenue Market Share (%) By Applications (2030)
Figure 28 Global Government Software Market Revenue (USD Million) By Regions (2023-2030)
Figure 29 North America Government Software Revenue (USD Million) By Country (2023-2030)
Figure 30 North America Government Software Revenue (USD Million) By Type (2023-2030)
Figure 31 North America Government Software Revenue (USD Million) By Applications (2023-2030)
Figure 32 Europe Government Software Revenue (USD Million) By Country (2023-2030)
Figure 33 Europe Government Software Revenue (USD Million) By Type (2023-2030)
Figure 34 Europe Government Software Revenue (USD Million) By Applications (2023-2030)
Figure 35 Asia Pacific Government Software Revenue (USD Million) By Country (2023-2030)
Figure 36 Asia Pacific Government Software Revenue (USD Million) By Type (2023-2030)
Figure 37 Asia Pacific Government Software Revenue (USD Million) By Applications (2023-2030)
Figure 38 South America Government Software Revenue (USD Million) By Country (2023-2030)
Figure 39 South America Government Software Revenue (USD Million) By Type (2023-2030)
Figure 40 South America Government Software Revenue (USD Million) By Applications (2023-2030)
Figure 41 Middle East and Africa Government Software Revenue (USD Million) By Region (2023-2030)
Figure 42 Middle East and Africa Government Software Revenue (USD Million) By Region (2023-2030)
Figure 43 Middle East and Africa Government Software Revenue (USD Million) By Type (2023-2030)
Figure 44 Middle East and Africa Government Software Revenue (USD Million) By Applications (2023-2030)
Figure 45 Bottom-Up and Top-Down Approaches for This Report
Figure 46 Data Triangulation
