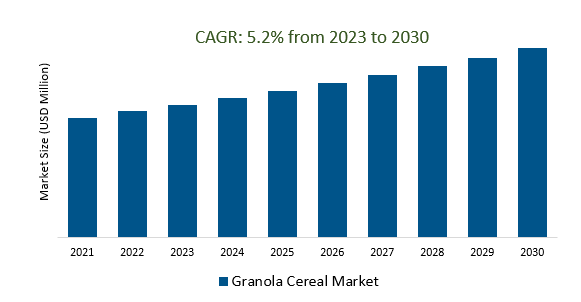
The Granola Cereal Market Size is estimated to register 5.2% growth over the forecast period from 2023 to 2030.
Granola Cereal Market Overview
The increasing consumer inclination towards healthier breakfast options, marked by the perception of granola as a nutritious and versatile choice is the primary driver. The rising health consciousness among consumers, coupled with an increasing focus on wellness and balanced diets are significantly boosting the demand for granola cereals. The market is seeing a surge in product innovation, with manufacturers offering a wide array of granola cereal varieties. These variations cater to diverse consumer preferences, including gluten-free, organic, low-sugar, and high-protein options. The introduction of unique flavours and ingredient combinations also reflects the trend of customization and variety in granola products. Manufacturers have been introducing an array of granola cereal variations, including gluten-free, organic, low-sugar, and high-protein options.
Granola Cereal Market Dynamics
Market Trends- Emphasis on Product Innovation and Diverse Offerings in Granola Cereal Industry.
The introduction of a wide spectrum of granola cereal variations, including but not limited to gluten-free, organic, low-sugar, and high-protein options are propelling the demand.
Manufacturers within this market are actively focusing on product diversification and innovation to meet evolving consumer preferences and dietary needs.
Additionally, the overarching consumer demand for customization and health-conscious choices are allowing granola cereal brands to differentiate themselves and capture different segments of the market leading to its expansion.
Market Driver- The Granola Cereal Market prioritizes health and wellness for consumers seeking nutritious food options.
The growing consumer inclination towards healthier dietary choices, positioning granola cereals as a nutritious breakfast and snack option are the key factors.
Granola's composition, containing whole grains, nuts, seeds, and dried fruits, aligns with prevailing health-conscious trends, appealing to consumers seeking balanced and wholesome food alternatives are propelling the market growth.
Additionally, manufacturers are emphasizing health-oriented marketing strategies, emphasizing nutritional benefits and natural ingredients to resonate with health-conscious consumers, driving the widespread of the market.
Market Opportunity- Convenience and On-the-Go Consumption drives Granola Cereal Industry.
Granola cereals, often available in bars or single-serve packaging, cater to the rising demand for portable and time-efficient food choices.
Businesses are focusing on packaging formats and marketing strategies that highlight the convenience factor, emphasizing the suitability of granola cereals for busy lifestyles.
Further, the need for quick, yet nutritious meal solutions, prompting manufacturers to develop innovative packaging and product designs that facilitate on-the-go consumption, leading to market growth.
Market Share Analysis- Gluten Free will register the fastest growth
The Granola Cereal Market is analyzed across Gluten and Gluten Free. Gluten Free is poised to register the fastest growth. Gluten-free granola cereals are formulated without gluten-containing grains like wheat, barley, or rye, making them suitable for individuals with gluten intolerance, sensitivity, or those following a gluten-free diet due to health concerns such as celiac disease. The gluten-free segment has gained traction due to increased health consciousness among consumers and the perception that gluten-free products are healthier. This trend has led to a surge in demand for gluten-free options across various food categories, including granola cereals. Manufacturers have responded by developing and marketing gluten-free granola cereals, often featuring a blend of gluten-free oats, nuts, seeds, and dried fruits to ensure nutritional value and flavour. Moreover, the rising prevalence of celiac disease and gluten sensitivities has contributed to the expansion of this market segment. Consumers seeking healthier food alternatives and those embracing gluten-free diets as a lifestyle choice further drive the growth of gluten-free granola cereals.
Market Share Analysis- Online held a significant market share in 2023
The Granola Cereal Market is analyzed across various applications including Online and Offline. Of these, online held a significant market share in 2023. Online sales of granola cereals have seen a substantial surge owing to the increasing adoption of e-commerce platforms and changing consumer shopping behaviours. Consumers are drawn to online purchasing due to its convenience, accessibility, and vast array of product choices available at their fingertips. The online platform provides a convenient shopping experience, allowing consumers to browse through various granola cereal options, compare prices, read reviews, and make purchases from the comfort of their homes. Moreover, the online segment offers an opportunity for granola cereal brands to expand their reach to a broader audience beyond geographical boundaries, facilitating nationwide or even international sales. Businesses operating in the Granola Cereal Market are focusing on optimizing their online presence, leveraging social media, e-commerce websites, and mobile apps to enhance visibility and engage with consumers.
Granola Cereal Market News
Kellogg India Unveils New Kellogg's Crunchy Granola Almonds & Cranberries.
Bagrry’s introduces a new Superfood Granola Range, emphasizing its commitment to nutritious options for health-conscious consumers.
Granola Cereal Market Segmentation
By Type
By Application
By Region
- North America (United States, Canada, Mexico)
- Europe (Germany, France, United Kingdom, Spain, Italy, Others)
- Asia Pacific (China, India, Japan, South Korea, Australia, Others)
- Latin America (Brazil, Argentina, Others)
- Middle East and Africa (Saudi Arabia, UAE, Kuwait, Other Middle East, South Africa, Nigeria, Other Africa)
Granola Cereal Market Companies
- Purely Elizabeth
- General Mills
- KIND
- Cascadian Farm Organic
- Nature’s Path
- Honey Bunches of Oats
- Mom's Best Cereals
- Bob’s Red Mill
*List not exhaustive
Granola Cereal Market Outlook 2023
1 Market Overview
1.1 Introduction to the Granola Cereal Market
1.2 Scope of the Study
1.3 Research Objective
1.3.1 Key Market Scope and Segments
1.3.2 Players Covered
1.3.3 Years Considered
2 Executive Summary
2.1 2023 Granola Cereal Industry- Market Statistics
3 Market Dynamics
3.1 Market Drivers
3.2 Market Challenges
3.3 Market Opportunities
3.4 Market Trends
4 Market Factor Analysis
4.1 Porter’s Five Forces
4.2 Market Entropy
4.2.1 Global Granola Cereal Market Companies with Area Served
4.2.2 Products Offerings Global Granola Cereal Market
5 COVID-19 Impact Analysis and Outlook Scenarios
5.1.1 Covid-19 Impact Analysis
5.1.2 Post-COVID-19 Scenario- Low Growth Case
5.1.3 Post-COVID-19 Scenario- Reference Growth Case
5.1.4 Post-COVID-19 Scenario- Low Growth Case
6 Global Granola Cereal Market Trends
6.1 Global Granola Cereal Revenue (USD Million) and CAGR (%) by Type (2018-2030)
6.2 Global Granola Cereal Revenue (USD Million) and CAGR (%) by Applications (2018-2030)
6.3 Global Granola Cereal Revenue (USD Million) and CAGR (%) by Regions (2018-2030)
7 Global Granola Cereal Market Revenue (USD Million) by Type, and Applications (2018-2022)
7.1 Global Granola Cereal Revenue (USD Million) by Type (2018-2022)
7.1.1 Global Granola Cereal Revenue (USD Million), Market Share (%) by Type (2018-2022)
7.2 Global Granola Cereal Revenue (USD Million) by Applications (2018-2022)
7.2.1 Global Granola Cereal Revenue (USD Million), Market Share (%) by Applications (2018-2022)
8 Global Granola Cereal Development Regional Status and Outlook
8.1 Global Granola Cereal Revenue (USD Million) By Regions (2018-2022)
8.2 North America Granola Cereal Revenue (USD Million) by Type, and Application (2018-2022)
8.2.1 North America Granola Cereal Revenue (USD Million) by Country (2018-2022)
8.2.2 North America Granola Cereal Revenue (USD Million) by Type (2018-2022)
8.2.3 North America Granola Cereal Revenue (USD Million) by Applications (2018-2022)
8.3 Europe Granola Cereal Revenue (USD Million), by Type, and Applications (USD Million) (2018-2022)
8.3.1 Europe Granola Cereal Revenue (USD Million), by Country (2018-2022)
8.3.2 Europe Granola Cereal Revenue (USD Million) by Type (2018-2022)
8.3.3 Europe Granola Cereal Revenue (USD Million) by Applications (2018-2022)
8.4 Asia Pacific Granola Cereal Revenue (USD Million), and Revenue (USD Million) by Type, and Applications (2018-2022)
8.4.1 Asia Pacific Granola Cereal Revenue (USD Million) by Country (2018-2022)
8.4.2 Asia Pacific Granola Cereal Revenue (USD Million) by Type (2018-2022)
8.4.3 Asia Pacific Granola Cereal Revenue (USD Million) by Applications (2018-2022)
8.5 South America Granola Cereal Revenue (USD Million), by Type, and Applications (2018-2022)
8.5.1 South America Granola Cereal Revenue (USD Million), by Country (2018-2022)
8.5.2 South America Granola Cereal Revenue (USD Million) by Type (2018-2022)
8.5.3 South America Granola Cereal Revenue (USD Million) by Applications (2018-2022)
8.6 Middle East and Africa Granola Cereal Revenue (USD Million), by Type, Technology, Application, Thickness (2018-2022)
8.6.1 Middle East and Africa Granola Cereal Revenue (USD Million) by Country (2018-2022)
8.6.2 Middle East and Africa Granola Cereal Revenue (USD Million) by Type (2018-2022)
8.6.3 Middle East and Africa Granola Cereal Revenue (USD Million) by Applications (2018-2022)
9 Company Profiles
10 Global Granola Cereal Market Revenue (USD Million), by Type, and Applications (2023-2030)
10.1 Global Granola Cereal Revenue (USD Million) and Market Share (%) by Type (2023-2030)
10.1.1 Global Granola Cereal Revenue (USD Million), and Market Share (%) by Type (2023-2030)
10.2 Global Granola Cereal Revenue (USD Million) and Market Share (%) by Applications (2023-2030)
10.2.1 Global Granola Cereal Revenue (USD Million), and Market Share (%) by Applications (2023-2030)
11 Global Granola Cereal Development Regional Status and Outlook Forecast
11.1 Global Granola Cereal Revenue (USD Million) By Regions (2023-2030)
11.2 North America Granola Cereal Revenue (USD Million) by Type, and Applications (2023-2030)
11.2.1 North America Granola Cereal Revenue (USD) Million by Country (2023-2030)
11.2.2 North America Granola Cereal Revenue (USD Million), by Type (2023-2030)
11.2.3 North America Granola Cereal Revenue (USD Million), Market Share (%) by Applications (2023-2030)
11.3 Europe Granola Cereal Revenue (USD Million), by Type, and Applications (2023-2030)
11.3.1 Europe Granola Cereal Revenue (USD Million), by Country (2023-2030)
11.3.2 Europe Granola Cereal Revenue (USD Million), by Type (2023-2030)
11.3.3 Europe Granola Cereal Revenue (USD Million), by Applications (2023-2030)
11.4 Asia Pacific Granola Cereal Revenue (USD Million) by Type, and Applications (2023-2030)
11.4.1 Asia Pacific Granola Cereal Revenue (USD Million), by Country (2023-2030)
11.4.2 Asia Pacific Granola Cereal Revenue (USD Million), by Type (2023-2030)
11.4.3 Asia Pacific Granola Cereal Revenue (USD Million), by Applications (2023-2030)
11.5 South America Granola Cereal Revenue (USD Million), by Type, and Applications (2023-2030)
11.5.1 South America Granola Cereal Revenue (USD Million), by Country (2023-2030)
11.5.2 South America Granola Cereal Revenue (USD Million), by Type (2023-2030)
11.5.3 South America Granola Cereal Revenue (USD Million), by Applications (2023-2030)
11.6 Middle East and Africa Granola Cereal Revenue (USD Million), by Type, and Applications (2023-2030)
11.6.1 Middle East and Africa Granola Cereal Revenue (USD Million), by Region (2023-2030)
11.6.2 Middle East and Africa Granola Cereal Revenue (USD Million), by Type (2023-2030)
11.6.3 Middle East and Africa Granola Cereal Revenue (USD Million), by Applications (2023-2030)
12 Methodology and Data Sources
12.1 Methodology/Research Approach
12.1.1 Research Programs/Design
12.1.2 Market Size Estimation
12.1.3 Market Breakdown and Data Triangulation
12.2 Data Sources
12.2.1 Secondary Sources
12.2.2 Primary Sources
12.3 Disclaimer
List of Tables
Table 1 Market Segmentation Analysis
Table 2 Global Granola Cereal Market Companies with Areas Served
Table 3 Products Offerings Global Granola Cereal Market
Table 4 Low Growth Scenario Forecasts
Table 5 Reference Case Growth Scenario
Table 6 High Growth Case Scenario
Table 7 Global Granola Cereal Revenue (USD Million) And CAGR (%) By Type (2018-2030)
Table 8 Global Granola Cereal Revenue (USD Million) And CAGR (%) By Applications (2018-2030)
Table 9 Global Granola Cereal Revenue (USD Million) And CAGR (%) By Regions (2018-2030)
Table 10 Global Granola Cereal Revenue (USD Million) By Type (2018-2022)
Table 11 Global Granola Cereal Revenue Market Share (%) By Type (2018-2022)
Table 12 Global Granola Cereal Revenue (USD Million) By Applications (2018-2022)
Table 13 Global Granola Cereal Revenue Market Share (%) By Applications (2018-2022)
Table 14 Global Granola Cereal Market Revenue (USD Million) By Regions (2018-2022)
Table 15 Global Granola Cereal Market Share (%) By Regions (2018-2022)
Table 16 North America Granola Cereal Revenue (USD Million) By Country (2018-2022)
Table 17 North America Granola Cereal Revenue (USD Million) By Type (2018-2022)
Table 18 North America Granola Cereal Revenue (USD Million) By Applications (2018-2022)
Table 19 Europe Granola Cereal Revenue (USD Million) By Country (2018-2022)
Table 20 Europe Granola Cereal Revenue (USD Million) By Type (2018-2022)
Table 21 Europe Granola Cereal Revenue (USD Million) By Applications (2018-2022)
Table 22 Asia Pacific Granola Cereal Revenue (USD Million) By Country (2018-2022)
Table 23 Asia Pacific Granola Cereal Revenue (USD Million) By Type (2018-2022)
Table 24 Asia Pacific Granola Cereal Revenue (USD Million) By Applications (2018-2022)
Table 25 South America Granola Cereal Revenue (USD Million) By Country (2018-2022)
Table 26 South America Granola Cereal Revenue (USD Million) By Type (2018-2022)
Table 27 South America Granola Cereal Revenue (USD Million) By Applications (2018-2022)
Table 28 Middle East and Africa Granola Cereal Revenue (USD Million) By Region (2018-2022)
Table 29 Middle East and Africa Granola Cereal Revenue (USD Million) By Type (2018-2022)
Table 30 Middle East and Africa Granola Cereal Revenue (USD Million) By Applications (2018-2022)
Table 31 Financial Analysis
Table 32 Global Granola Cereal Revenue (USD Million) By Type (2023-2030)
Table 33 Global Granola Cereal Revenue Market Share (%) By Type (2023-2030)
Table 34 Global Granola Cereal Revenue (USD Million) By Applications (2023-2030)
Table 35 Global Granola Cereal Revenue Market Share (%) By Applications (2023-2030)
Table 36 Global Granola Cereal Market Revenue (USD Million), And Revenue (USD Million) By Regions (2023-2030)
Table 37 North America Granola Cereal Revenue (USD)By Country (2023-2030)
Table 38 North America Granola Cereal Revenue (USD Million) By Type (2023-2030)
Table 39 North America Granola Cereal Revenue (USD Million) By Applications (2023-2030)
Table 40 Europe Granola Cereal Revenue (USD Million) By Country (2023-2030)
Table 41 Europe Granola Cereal Revenue (USD Million) By Type (2023-2030)
Table 42 Europe Granola Cereal Revenue (USD Million) By Applications (2023-2030)
Table 43 Asia Pacific Granola Cereal Revenue (USD Million) By Country (2023-2030)
Table 44 Asia Pacific Granola Cereal Revenue (USD Million) By Type (2023-2030)
Table 45 Asia Pacific Granola Cereal Revenue (USD Million) By Applications (2023-2030)
Table 46 South America Granola Cereal Revenue (USD Million) By Country (2023-2030)
Table 47 South America Granola Cereal Revenue (USD Million) By Type (2023-2030)
Table 48 South America Granola Cereal Revenue (USD Million) By Applications (2023-2030)
Table 49 Middle East and Africa Granola Cereal Revenue (USD Million) By Region (2023-2030)
Table 50 Middle East and Africa Granola Cereal Revenue (USD Million) By Region (2023-2030)
Table 51 Middle East and Africa Granola Cereal Revenue (USD Million) By Type (2023-2030)
Table 52 Middle East and Africa Granola Cereal Revenue (USD Million) By Applications (2023-2030)
Table 53 Research Programs/Design for This Report
Table 54 Key Data Information from Secondary Sources
Table 55 Key Data Information from Primary Sources
List of Figures
Figure 1 Market Scope
Figure 2 Porter’s Five Forces
Figure 3 Global Granola Cereal Revenue (USD Million) By Type (2018-2022)
Figure 4 Global Granola Cereal Revenue Market Share (%) By Type (2022)
Figure 5 Global Granola Cereal Revenue (USD Million) By Applications (2018-2022)
Figure 6 Global Granola Cereal Revenue Market Share (%) By Applications (2022)
Figure 7 Global Granola Cereal Market Revenue (USD Million) By Regions (2018-2022)
Figure 8 Global Granola Cereal Market Share (%) By Regions (2022)
Figure 9 North America Granola Cereal Revenue (USD Million) By Country (2018-2022)
Figure 10 North America Granola Cereal Revenue (USD Million) By Type (2018-2022)
Figure 11 North America Granola Cereal Revenue (USD Million) By Applications (2018-2022)
Figure 12 Europe Granola Cereal Revenue (USD Million) By Country (2018-2022)
Figure 13 Europe Granola Cereal Revenue (USD Million) By Type (2018-2022)
Figure 14 Europe Granola Cereal Revenue (USD Million) By Applications (2018-2022)
Figure 15 Asia Pacific Granola Cereal Revenue (USD Million) By Country (2018-2022)
Figure 16 Asia Pacific Granola Cereal Revenue (USD Million) By Type (2018-2022)
Figure 17 Asia Pacific Granola Cereal Revenue (USD Million) By Applications (2018-2022)
Figure 18 South America Granola Cereal Revenue (USD Million) By Country (2018-2022)
Figure 19 South America Granola Cereal Revenue (USD Million) By Type (2018-2022)
Figure 20 South America Granola Cereal Revenue (USD Million) By Applications (2018-2022)
Figure 21 Middle East and Africa Granola Cereal Revenue (USD Million) By Region (2018-2022)
Figure 22 Middle East and Africa Granola Cereal Revenue (USD Million) By Type (2018-2022)
Figure 23 Middle East and Africa Granola Cereal Revenue (USD Million) By Applications (2018-2022)
Figure 24 Global Granola Cereal Revenue (USD Million) By Type (2023-2030)
Figure 25 Global Granola Cereal Revenue Market Share (%) By Type (2030)
Figure 26 Global Granola Cereal Revenue (USD Million) By Applications (2023-2030)
Figure 27 Global Granola Cereal Revenue Market Share (%) By Applications (2030)
Figure 28 Global Granola Cereal Market Revenue (USD Million) By Regions (2023-2030)
Figure 29 North America Granola Cereal Revenue (USD Million) By Country (2023-2030)
Figure 30 North America Granola Cereal Revenue (USD Million) By Type (2023-2030)
Figure 31 North America Granola Cereal Revenue (USD Million) By Applications (2023-2030)
Figure 32 Europe Granola Cereal Revenue (USD Million) By Country (2023-2030)
Figure 33 Europe Granola Cereal Revenue (USD Million) By Type (2023-2030)
Figure 34 Europe Granola Cereal Revenue (USD Million) By Applications (2023-2030)
Figure 35 Asia Pacific Granola Cereal Revenue (USD Million) By Country (2023-2030)
Figure 36 Asia Pacific Granola Cereal Revenue (USD Million) By Type (2023-2030)
Figure 37 Asia Pacific Granola Cereal Revenue (USD Million) By Applications (2023-2030)
Figure 38 South America Granola Cereal Revenue (USD Million) By Country (2023-2030)
Figure 39 South America Granola Cereal Revenue (USD Million) By Type (2023-2030)
Figure 40 South America Granola Cereal Revenue (USD Million) By Applications (2023-2030)
Figure 41 Middle East and Africa Granola Cereal Revenue (USD Million) By Region (2023-2030)
Figure 42 Middle East and Africa Granola Cereal Revenue (USD Million) By Region (2023-2030)
Figure 43 Middle East and Africa Granola Cereal Revenue (USD Million) By Type (2023-2030)
Figure 44 Middle East and Africa Granola Cereal Revenue (USD Million) By Applications (2023-2030)
Figure 45 Bottom-Up and Top-Down Approaches For This Report
Figure 46 Data Triangulation
