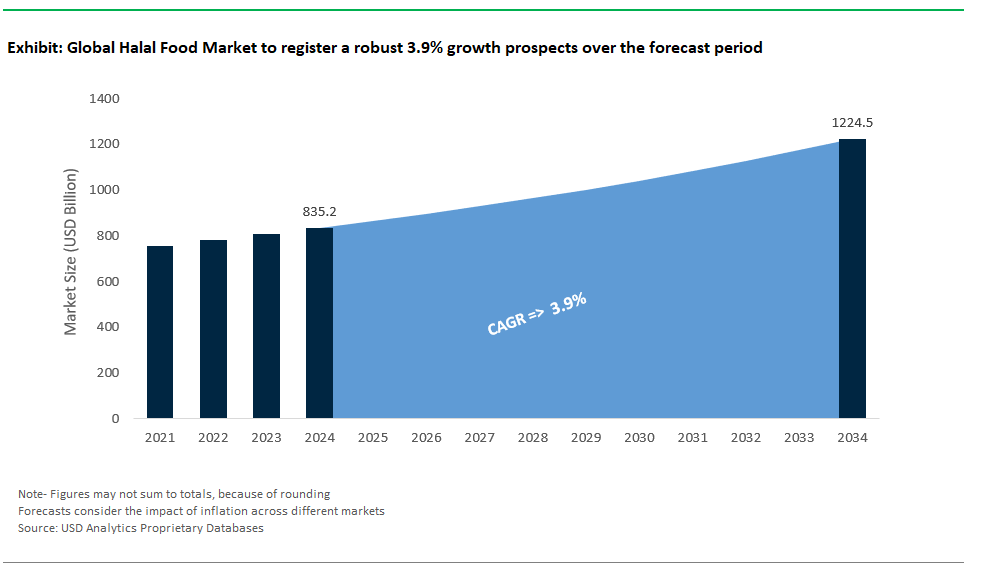
The global Halal Food Market Size is valued at $835.2 Billion in 2024 and is forecast to register a growth rate (CAGR) of 3.9% to reach $1224.5 Billion by 2034.
The halal food market is driven by religious and cultural dietary preferences, along with the growing awareness of halal practices among Muslim and non-Muslim consumers. Key drivers include the demand for certified halal products, increased globalization facilitating access to halal food options, and consumers seeking quality assurance, ethical sourcing, and transparency in food production.
Halal Food Market Competitive Landscape
The market report analyses the leading companies in the industry including Al Islami Foods Company Limited LLC, Al-Falah Halal Foods, Allanasons Private Limited, American Halal Company, Inc., Beijing Shunxin Agriculture Co., Ltd., Hebei Kangyuan Halal Food Co., Ltd., Midamar Corporation, Namet Gıda Sanayi ve Ticaret A.Åž., Nema Food Company, Nestlé S.A., Prima Agri-Products Sdn Bhd, QL Foods Sdn Bhd, and Others.
Halal Food Market Dynamics
Halal Food Market Trend: Growing Consumer Preference for Halal and Ethical Food Choices Drives the Halal Food Market
The most prominent trend in the halal food market is the growing consumer preference for halal and ethical food choices. With an increasing awareness of dietary practices and a focus on ethical sourcing, consumers are seeking halal-certified products that align with their religious and ethical beliefs. This trend is characterized by a shift towards transparency in food production, ensuring that halal food meets not only religious standards but also ethical and sustainable criteria. Brands that emphasize halal certification and ethical sourcing practices are capitalizing on this trend, catering to the diverse preferences of consumers who prioritize both religious compliance and ethical considerations in their food choices.
Halal Food Market Driver: Rising Global Muslim Population and Inclusivity Drive the Growth of Halal Food Market
A key driver propelling the halal food market is the rising global Muslim population and the growing inclusivity of halal products. With an expanding Muslim consumer base worldwide, there is an increased demand for diverse halal food options that cater to various tastes and preferences. This driver is fueled by the recognition of halal as a mainstream dietary choice, appealing not only to Muslims but also to a broader consumer audience seeking high-quality, hygienic, and responsibly sourced food products. Brands that embrace inclusivity in their halal offerings and cater to a multicultural market are contributing to the market's growth by meeting the dietary needs of a diverse and expanding consumer base.
Halal Food Market Opportunity: Innovation in Halal Convenience Foods and Snacks
An untapped opportunity within the halal food market lies in the innovation of halal convenience foods and snacks. Brands can explore the development of convenient and on-the-go halal options, including ready-to-eat meals, snacks, and beverages. This opportunity involves creating products that align with the busy lifestyles of modern consumers while maintaining halal integrity. By offering a variety of convenient halal choices, companies can tap into the fast-growing market for on-the-go and snackable halal foods, meeting the needs of consumers who seek both convenience and adherence to halal dietary principles in their daily lives.
Halal Food Market Share Analysis: Meat, Poultry, and Seafood Products is poised to register the fastest growth rate (CAGR) over the forecast period from 2025 to 2034.
Meat, poultry, and seafood products are the fastest-growing segment in the halal food market by type. These products form a staple part of many cuisines, particularly in Muslim-majority regions, and their demand is fueled by strict adherence to halal slaughtering and processing standards. The increasing global demand for high-protein diets and the expansion of halal-certified supply chains contribute to this growth. Additionally, the rise of halal-certified ready-to-eat and frozen meat products in both traditional and non-Muslim markets further accelerates the segment's expansion.
Halal Food Market Share Analysis: Supermarkets/Hypermarkets generated the highest revenue in 2024
Supermarkets and hypermarkets represent the largest segment in the halal food market by end-user. These retail channels provide a wide range of halal-certified products, making it convenient for consumers to shop for their daily needs in one location. Their ability to offer competitive pricing, diverse product options, and promotional campaigns attracts a large customer base. Moreover, the growing trend of in-store certification displays, which assure consumers of the authenticity of halal products, reinforces the dominance of this segment. The presence of halal food sections in large retail outlets has further expanded their appeal among diverse consumer groups.
Halal Food Market Share Analysis: Residential Application is poised to register the fastest growth rate (CAGR) over the forecast period from 2025 to 2034.
The residential segment is the fastest-growing application in the halal food market. With increasing awareness of halal food standards and growing accessibility to certified products, households are rapidly adopting halal options for everyday meals. This trend is particularly prominent in urban areas where multicultural populations reside, leading to higher demand for halal food products. The convenience of online grocery platforms offering halal-certified items and the growing focus on healthy and ethically sourced foods contribute to the segment’s rapid expansion. Additionally, changing dietary preferences and the popularity of home cooking during and post-pandemic have further boosted residential demand.
Halal Food Market Report Scope
|
Parameter
|
Details
|
|
Market Size (2024)
|
$835.2 Billion
|
|
Market Size (2034)
|
$1224.5 Billion
|
|
Market Growth Rate
|
3.9%
|
|
Segments
|
By Type (Cereal Based, Fruits and Vegetables, Milk and Dairy Products, Meat Poultry and Seafood Products), By Application (Restaurant, Hotel, Home, Others), By End-User (Supermarkets/Hypermarkets, Convenience Stores, Specialty Stores, Online Stores, Others)
|
|
Study Period
|
2019- 2024 and 2025-2034
|
|
Units
|
Revenue (USD)
|
|
Qualitative Analysis
|
Porter’s Five Forces, SWOT Profile, Market Share, Scenario Forecasts, Market Ecosystem, Company Ranking, Market Dynamics, Industry Benchmarking
|
|
Companies
|
Al Islami Foods Company Ltd LLC, Al-Falah Halal Foods, Allanasons Private Ltd, American Halal Company, Inc., Beijing Shunxin Agriculture Co., Ltd., Hebei Kangyuan Halal Food Co., Ltd., Midamar Corp, Namet Gıda Sanayi ve Ticaret A.Åž., Nema Food Company, Nestlé S.A., Prima Agri-Products Sdn Bhd, QL Foods Sdn Bhd, and Others.
|
|
Countries
|
US, Canada, Mexico, Germany, France, Spain, Italy, UK, Russia, China, India, Japan, South Korea, Australia, South East Asia, Brazil, Argentina, Middle East, Africa
|
Halal Food Market Segmentation
By Type
- Cereal Based
- Fruits and Vegetables
- Milk and Dairy Products
- Meat
- Poultry and Seafood Products
By Application
- Restaurant
- Hotel
- Home
- Others
By End-User
- Supermarkets
- Hypermarkets
- Convenience Stores
- Specialty Stores
- Online Stores
- Others
By Region
- North America (United States, Canada, Mexico)
- Europe (Germany, France, United Kingdom, Spain, Italy, Others)
- Asia Pacific (China, India, Japan, South Korea, Australia, Others)
- Latin America (Brazil, Argentina, Others)
- Middle East and Africa (Saudi Arabia, UAE, Kuwait, Other Middle East, South Africa, Nigeria, Other Africa)
Halal Food Companies Profiled in the Study
Halal food adheres to Islamic dietary laws, prepared and processed following specific guidelines, permissible for consumption by Muslims.The industry is characterized by intense competitive conditions with leading companies focusing on new product launches, widening distribution channels, and supply-chain optimization strategies.
- Al-Falah Halal Foods
- Al Islami Foods Company Limited LLC
- QL Foods Sdn Bhd
- Nestlé S.A.
- American Halal Company, Inc.
- Beijing Shunxin Agriculture Co., Ltd.
- Allanasons Private Limited
- Prima Agri-Products Sdn Bhd
- Hebei Kangyuan Halal Food Co., Ltd.
- Nema Food Company
- Midamar Corporation
- Namet Gıda Sanayi ve Ticaret A.Ş.
*List not exhaustive
Halal Food Market Outlook 2024
1 Market Overview
1.1 Introduction to the Halal Food Market
1.2 Scope of the Study
1.3 Research Objective
1.3.1 Key Market Scope and Segments
1.3.2 Players Covered
1.3.3 Years Considered
2 Executive Summary
2.1 2024 Halal Food Industry- Market Statistics
3 Market Dynamics
3.1 Market Drivers
3.2 Market Challenges
3.3 Market Opportunities
3.4 Market Trends
4 Market Factor Analysis
4.1 Porter’s Five Forces
4.2 Market Entropy
4.2.1 Global Halal Food Market Companies with Area Served
4.2.2 Products Offerings Global Halal Food Market
5 COVID-19 Impact Analysis and Outlook Scenarios
5.1.1 Covid-19 Impact Analysis
5.1.2 Post-COVID-19 Scenario- Low Growth Case
5.1.3 Post-COVID-19 Scenario- Reference Growth Case
5.1.4 Post-COVID-19 Scenario- Low Growth Case
6 Global Halal Food Market Trends
6.1 Global Halal Food Revenue (USD Million) and CAGR (%) by Type (2018-2030)
6.2 Global Halal Food Revenue (USD Million) and CAGR (%) by Applications (2018-2030)
6.3 Global Halal Food Revenue (USD Million) and CAGR (%) by Regions (2018-2030)
7 Global Halal Food Market Revenue (USD Million) by Type, and Applications (2018-2022)
7.1 Global Halal Food Revenue (USD Million) by Type (2018-2022)
7.1.1 Global Halal Food Revenue (USD Million), Market Share (%) by Type (2018-2022)
7.2 Global Halal Food Revenue (USD Million) by Applications (2018-2022)
7.2.1 Global Halal Food Revenue (USD Million), Market Share (%) by Applications (2018-2022)
8 Global Halal Food Development Regional Status and Outlook
8.1 Global Halal Food Revenue (USD Million) By Regions (2018-2022)
8.2 North America Halal Food Revenue (USD Million) by Type, and Application (2018-2022)
8.2.1 North America Halal Food Revenue (USD Million) by Country (2018-2022)
8.2.2 North America Halal Food Revenue (USD Million) by Type (2018-2022)
8.2.3 North America Halal Food Revenue (USD Million) by Applications (2018-2022)
8.3 Europe Halal Food Revenue (USD Million), by Type, and Applications (USD Million) (2018-2022)
8.3.1 Europe Halal Food Revenue (USD Million), by Country (2018-2022)
8.3.2 Europe Halal Food Revenue (USD Million) by Type (2018-2022)
8.3.3 Europe Halal Food Revenue (USD Million) by Applications (2018-2022)
8.4 Asia Pacific Halal Food Revenue (USD Million), and Revenue (USD Million) by Type, and Applications (2018-2022)
8.4.1 Asia Pacific Halal Food Revenue (USD Million) by Country (2018-2022)
8.4.2 Asia Pacific Halal Food Revenue (USD Million) by Type (2018-2022)
8.4.3 Asia Pacific Halal Food Revenue (USD Million) by Applications (2018-2022)
8.5 South America Halal Food Revenue (USD Million), by Type, and Applications (2018-2022)
8.5.1 South America Halal Food Revenue (USD Million), by Country (2018-2022)
8.5.2 South America Halal Food Revenue (USD Million) by Type (2018-2022)
8.5.3 South America Halal Food Revenue (USD Million) by Applications (2018-2022)
8.6 Middle East and Africa Halal Food Revenue (USD Million), by Type, Technology, Application, Thickness (2018-2022)
8.6.1 Middle East and Africa Halal Food Revenue (USD Million) by Country (2018-2022)
8.6.2 Middle East and Africa Halal Food Revenue (USD Million) by Type (2018-2022)
8.6.3 Middle East and Africa Halal Food Revenue (USD Million) by Applications (2018-2022)
9 Company Profiles
10 Global Halal Food Market Revenue (USD Million), by Type, and Applications (2024-2030)
10.1 Global Halal Food Revenue (USD Million) and Market Share (%) by Type (2024-2030)
10.1.1 Global Halal Food Revenue (USD Million), and Market Share (%) by Type (2024-2030)
10.2 Global Halal Food Revenue (USD Million) and Market Share (%) by Applications (2024-2030)
10.2.1 Global Halal Food Revenue (USD Million), and Market Share (%) by Applications (2024-2030)
11 Global Halal Food Development Regional Status and Outlook Forecast
11.1 Global Halal Food Revenue (USD Million) By Regions (2024-2030)
11.2 North America Halal Food Revenue (USD Million) by Type, and Applications (2024-2030)
11.2.1 North America Halal Food Revenue (USD) Million by Country (2024-2030)
11.2.2 North America Halal Food Revenue (USD Million), by Type (2024-2030)
11.2.3 North America Halal Food Revenue (USD Million), Market Share (%) by Applications (2024-2030)
11.3 Europe Halal Food Revenue (USD Million), by Type, and Applications (2024-2030)
11.3.1 Europe Halal Food Revenue (USD Million), by Country (2024-2030)
11.3.2 Europe Halal Food Revenue (USD Million), by Type (2024-2030)
11.3.3 Europe Halal Food Revenue (USD Million), by Applications (2024-2030)
11.4 Asia Pacific Halal Food Revenue (USD Million) by Type, and Applications (2024-2030)
11.4.1 Asia Pacific Halal Food Revenue (USD Million), by Country (2024-2030)
11.4.2 Asia Pacific Halal Food Revenue (USD Million), by Type (2024-2030)
11.4.3 Asia Pacific Halal Food Revenue (USD Million), by Applications (2024-2030)
11.5 South America Halal Food Revenue (USD Million), by Type, and Applications (2024-2030)
11.5.1 South America Halal Food Revenue (USD Million), by Country (2024-2030)
11.5.2 South America Halal Food Revenue (USD Million), by Type (2024-2030)
11.5.3 South America Halal Food Revenue (USD Million), by Applications (2024-2030)
11.6 Middle East and Africa Halal Food Revenue (USD Million), by Type, and Applications (2024-2030)
11.6.1 Middle East and Africa Halal Food Revenue (USD Million), by Region (2024-2030)
11.6.2 Middle East and Africa Halal Food Revenue (USD Million), by Type (2024-2030)
11.6.3 Middle East and Africa Halal Food Revenue (USD Million), by Applications (2024-2030)
12 Methodology and Data Sources
12.1 Methodology/Research Approach
12.1.1 Research Programs/Design
12.1.2 Market Size Estimation
12.1.3 Market Breakdown and Data Triangulation
12.2 Data Sources
12.2.1 Secondary Sources
12.2.2 Primary Sources
12.3 Disclaimer
List of Tables
Table 1 Market Segmentation Analysis
Table 2 Global Halal Food Market Companies with Areas Served
Table 3 Products Offerings Global Halal Food Market
Table 4 Low Growth Scenario Forecasts
Table 5 Reference Case Growth Scenario
Table 6 High Growth Case Scenario
Table 7 Global Halal Food Revenue (USD Million) And CAGR (%) By Type (2018-2030)
Table 8 Global Halal Food Revenue (USD Million) And CAGR (%) By Applications (2018-2030)
Table 9 Global Halal Food Revenue (USD Million) And CAGR (%) By Regions (2018-2030)
Table 10 Global Halal Food Revenue (USD Million) By Type (2018-2022)
Table 11 Global Halal Food Revenue Market Share (%) By Type (2018-2022)
Table 12 Global Halal Food Revenue (USD Million) By Applications (2018-2022)
Table 13 Global Halal Food Revenue Market Share (%) By Applications (2018-2022)
Table 14 Global Halal Food Market Revenue (USD Million) By Regions (2018-2022)
Table 15 Global Halal Food Market Share (%) By Regions (2018-2022)
Table 16 North America Halal Food Revenue (USD Million) By Country (2018-2022)
Table 17 North America Halal Food Revenue (USD Million) By Type (2018-2022)
Table 18 North America Halal Food Revenue (USD Million) By Applications (2018-2022)
Table 19 Europe Halal Food Revenue (USD Million) By Country (2018-2022)
Table 20 Europe Halal Food Revenue (USD Million) By Type (2018-2022)
Table 21 Europe Halal Food Revenue (USD Million) By Applications (2018-2022)
Table 22 Asia Pacific Halal Food Revenue (USD Million) By Country (2018-2022)
Table 23 Asia Pacific Halal Food Revenue (USD Million) By Type (2018-2022)
Table 24 Asia Pacific Halal Food Revenue (USD Million) By Applications (2018-2022)
Table 25 South America Halal Food Revenue (USD Million) By Country (2018-2022)
Table 26 South America Halal Food Revenue (USD Million) By Type (2018-2022)
Table 27 South America Halal Food Revenue (USD Million) By Applications (2018-2022)
Table 28 Middle East and Africa Halal Food Revenue (USD Million) By Region (2018-2022)
Table 29 Middle East and Africa Halal Food Revenue (USD Million) By Type (2018-2022)
Table 30 Middle East and Africa Halal Food Revenue (USD Million) By Applications (2018-2022)
Table 31 Financial Analysis
Table 32 Global Halal Food Revenue (USD Million) By Type (2024-2030)
Table 33 Global Halal Food Revenue Market Share (%) By Type (2024-2030)
Table 34 Global Halal Food Revenue (USD Million) By Applications (2024-2030)
Table 35 Global Halal Food Revenue Market Share (%) By Applications (2024-2030)
Table 36 Global Halal Food Market Revenue (USD Million), And Revenue (USD Million) By Regions (2024-2030)
Table 37 North America Halal Food Revenue (USD)By Country (2024-2030)
Table 38 North America Halal Food Revenue (USD Million) By Type (2024-2030)
Table 39 North America Halal Food Revenue (USD Million) By Applications (2024-2030)
Table 40 Europe Halal Food Revenue (USD Million) By Country (2024-2030)
Table 41 Europe Halal Food Revenue (USD Million) By Type (2024-2030)
Table 42 Europe Halal Food Revenue (USD Million) By Applications (2024-2030)
Table 43 Asia Pacific Halal Food Revenue (USD Million) By Country (2024-2030)
Table 44 Asia Pacific Halal Food Revenue (USD Million) By Type (2024-2030)
Table 45 Asia Pacific Halal Food Revenue (USD Million) By Applications (2024-2030)
Table 46 South America Halal Food Revenue (USD Million) By Country (2024-2030)
Table 47 South America Halal Food Revenue (USD Million) By Type (2024-2030)
Table 48 South America Halal Food Revenue (USD Million) By Applications (2024-2030)
Table 49 Middle East and Africa Halal Food Revenue (USD Million) By Region (2024-2030)
Table 50 Middle East and Africa Halal Food Revenue (USD Million) By Region (2024-2030)
Table 51 Middle East and Africa Halal Food Revenue (USD Million) By Type (2024-2030)
Table 52 Middle East and Africa Halal Food Revenue (USD Million) By Applications (2024-2030)
Table 53 Research Programs/Design for This Report
Table 54 Key Data Information from Secondary Sources
Table 55 Key Data Information from Primary Sources
List of Figures
Figure 1 Market Scope
Figure 2 Porter’s Five Forces
Figure 3 Global Halal Food Revenue (USD Million) By Type (2018-2022)
Figure 4 Global Halal Food Revenue Market Share (%) By Type (2022)
Figure 5 Global Halal Food Revenue (USD Million) By Applications (2018-2022)
Figure 6 Global Halal Food Revenue Market Share (%) By Applications (2022)
Figure 7 Global Halal Food Market Revenue (USD Million) By Regions (2018-2022)
Figure 8 Global Halal Food Market Share (%) By Regions (2022)
Figure 9 North America Halal Food Revenue (USD Million) By Country (2018-2022)
Figure 10 North America Halal Food Revenue (USD Million) By Type (2018-2022)
Figure 11 North America Halal Food Revenue (USD Million) By Applications (2018-2022)
Figure 12 Europe Halal Food Revenue (USD Million) By Country (2018-2022)
Figure 13 Europe Halal Food Revenue (USD Million) By Type (2018-2022)
Figure 14 Europe Halal Food Revenue (USD Million) By Applications (2018-2022)
Figure 15 Asia Pacific Halal Food Revenue (USD Million) By Country (2018-2022)
Figure 16 Asia Pacific Halal Food Revenue (USD Million) By Type (2018-2022)
Figure 17 Asia Pacific Halal Food Revenue (USD Million) By Applications (2018-2022)
Figure 18 South America Halal Food Revenue (USD Million) By Country (2018-2022)
Figure 19 South America Halal Food Revenue (USD Million) By Type (2018-2022)
Figure 20 South America Halal Food Revenue (USD Million) By Applications (2018-2022)
Figure 21 Middle East and Africa Halal Food Revenue (USD Million) By Region (2018-2022)
Figure 22 Middle East and Africa Halal Food Revenue (USD Million) By Type (2018-2022)
Figure 23 Middle East and Africa Halal Food Revenue (USD Million) By Applications (2018-2022)
Figure 24 Global Halal Food Revenue (USD Million) By Type (2024-2030)
Figure 25 Global Halal Food Revenue Market Share (%) By Type (2030)
Figure 26 Global Halal Food Revenue (USD Million) By Applications (2024-2030)
Figure 27 Global Halal Food Revenue Market Share (%) By Applications (2030)
Figure 28 Global Halal Food Market Revenue (USD Million) By Regions (2024-2030)
Figure 29 North America Halal Food Revenue (USD Million) By Country (2024-2030)
Figure 30 North America Halal Food Revenue (USD Million) By Type (2024-2030)
Figure 31 North America Halal Food Revenue (USD Million) By Applications (2024-2030)
Figure 32 Europe Halal Food Revenue (USD Million) By Country (2024-2030)
Figure 33 Europe Halal Food Revenue (USD Million) By Type (2024-2030)
Figure 34 Europe Halal Food Revenue (USD Million) By Applications (2024-2030)
Figure 35 Asia Pacific Halal Food Revenue (USD Million) By Country (2024-2030)
Figure 36 Asia Pacific Halal Food Revenue (USD Million) By Type (2024-2030)
Figure 37 Asia Pacific Halal Food Revenue (USD Million) By Applications (2024-2030)
Figure 38 South America Halal Food Revenue (USD Million) By Country (2024-2030)
Figure 39 South America Halal Food Revenue (USD Million) By Type (2024-2030)
Figure 40 South America Halal Food Revenue (USD Million) By Applications (2024-2030)
Figure 41 Middle East and Africa Halal Food Revenue (USD Million) By Region (2024-2030)
Figure 42 Middle East and Africa Halal Food Revenue (USD Million) By Region (2024-2030)
Figure 43 Middle East and Africa Halal Food Revenue (USD Million) By Type (2024-2030)
Figure 44 Middle East and Africa Halal Food Revenue (USD Million) By Applications (2024-2030)
Figure 45 Bottom-Up and Top-Down Approaches For This Report
Figure 46 Data Triangulation
