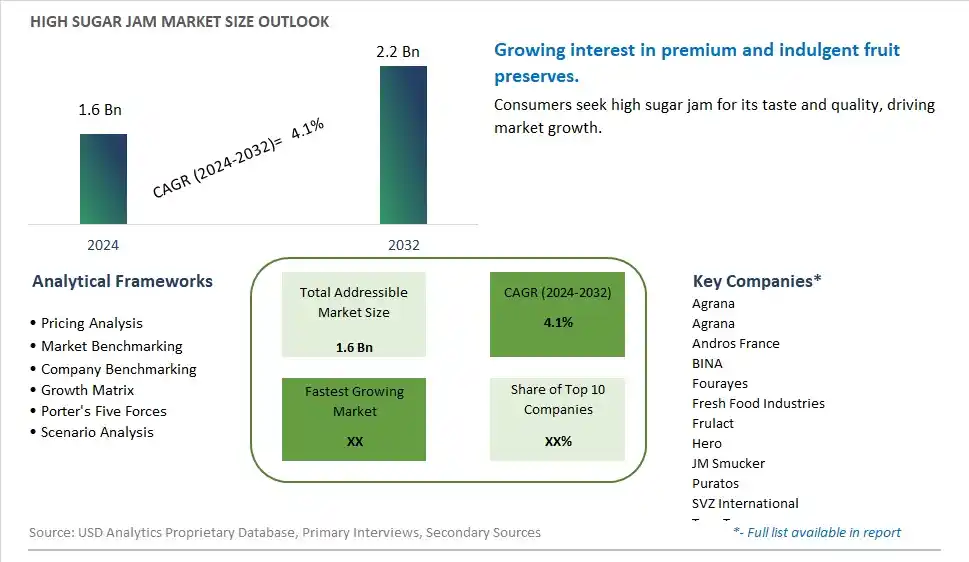
Global High Sugar Jam Market Size is valued at $1.6 Billion in 2024 and is forecast to register a growth rate (CAGR) of 4.1% to reach $2.2 Billion by 2032.
The global High Sugar Jam Market Comprehensive Study analyzes and forecasts the market size across 6 regions and 24 countries for diverse segments -By Type (Apple, Pear, Strawberry, Grape, Others), By Application (Dairy Industry, Baked Product Industry, Ice-Cream Industry, Others)
An Introduction to High Sugar Jam Market
In 2024, the high sugar jam market is thriving, fueled by the demand for sweet and flavorful spreads that preserve the taste and texture of fruits. High sugar jams, made with a high concentration of sugar, offer a long shelf life and intense fruit flavor. The market benefits from innovations in fruit preservation and processing technologies that enhance the quality and consistency of jams. The trend towards clean label and natural ingredients is influencing product development. Increasing consumer interest in traditional and artisanal preserves, supported by the popularity of breakfast and dessert foods, is further propelling market growth.
High Sugar Jam Competitive Landscape
The market report analyses the leading companies in the industry including Agrana, Agrana, Andros France, BINA, Fourayes, Fresh Food Industries, Frulact, Hero, JM Smucker, Puratos, SVZ International, Tree Top, Valio, Zentis, Zuegg, and Others.
High Sugar Jam Market Dynamics
High Sugar Jam Market Trend: Increasing Demand for Premium and Artisanal Products
The most prominent trend in the High Sugar Jam Market is the increasing demand for premium and artisanal products. Consumers are seeking high-quality jams made with natural ingredients and traditional methods, driven by the desire for unique and gourmet food experiences. This trend is fueled by the growing interest in artisanal and small-batch food products.
High Sugar Jam Market Driver: Health Consciousness and Natural Ingredients
A key driver in the High Sugar Jam Market is health consciousness and the demand for natural ingredients. As more individuals focus on consuming foods free from artificial additives and preservatives, there is a rising demand for high sugar jams made with natural fruit and sweeteners. This demand supports market growth as consumers seek healthier and more authentic food options.
High Sugar Jam Market Opportunity: Expansion into Exotic and Innovative Flavors
One significant opportunity in the High Sugar Jam Market lies in the expansion into exotic and innovative flavors. Companies can develop new jam varieties that incorporate unique and rare fruits, offering consumers a diverse range of flavors and culinary experiences. By highlighting the quality and creativity of their products, manufacturers can attract a broader consumer base and drive market growth.
High Sugar Jam Market Share Analysis- Largest Segment by Type
In the High Sugar Jam Market, Strawberry is the largest segment by type. Strawberry jam's popularity is driven by its classic taste, broad consumer appeal, and versatility in both sweet and savory dishes. Its long-standing presence in the market, combined with consumer preference for familiar flavors, contributes to its dominance. Strawberry jam is also widely used in a variety of food products and recipes, reinforcing its position as the largest segment in the high sugar jam market.
High Sugar Jam Market Share Analysis- Poised to Grow Fastest Over the Next Five Years by Application
In the High Sugar Jam Market, the Dairy Industry is poised to grow the fastest over the next five years. The growing demand for innovative dairy products and the incorporation of high sugar jams in yogurt, cheese spreads, and other dairy items are driving this segment's growth. High sugar jams add flavor and sweetness to dairy products, enhancing their appeal and marketability. As dairy manufacturers seek to differentiate their products and cater to evolving consumer preferences, the application of high sugar jams in dairy products is expected to see significant expansion.
High Sugar Jam Market Segmentation
By Type
Apple
Pear
Strawberry
Grape
Others
By Application
Dairy Industry
Baked Product Industry
Ice-Cream Industry
Others
Countries Analyzed
North America (US, Canada, Mexico)
Europe (Germany, UK, France, Spain, Italy, Russia, Rest of Europe)
Asia Pacific (China, India, Japan, South Korea, Australia, South East Asia, Rest of Asia)
South America (Brazil, Argentina, Rest of South America)
Middle East and Africa (Saudi Arabia, UAE, Rest of Middle East, South Africa, Egypt, Rest of Africa)
High Sugar Jam Companies Profiled in the Study
Agrana
Agrana
Andros France
BINA
Fourayes
Fresh Food Industries
Frulact
Hero
JM Smucker
Puratos
SVZ International
Tree Top
Valio
Zentis
Zuegg
*- List Not Exhaustive
Chapter 1. TABLE OF CONTENTS
Chapter 2. Introduction to High Sugar Jam Market
2.1. Market Overview
2.2. Key Statistics and Report Highlights
2.3. Scope of the Comprehensive Study
2.3.1. Market Definition
2.3.2 Countries and Regions Covered
2.3.3 Research Objective
2.3.4 Units, Currency, and Conversions
2.3.5 Industry Value Chain
2.4. Key Market Segments
2.5. Key Companies
2.6. Study Period
Chapter 3. Strategic Analysis Review
3.1. High Sugar Jam Pricing Analysis and Forecast
3.2. Porter’s Five Forces
3.3. Market Ecosystem
3.4. SWOT Analysis
3.5. Regulatory Scenario
3.3. Effects of Inflation, Russia-Ukraine War, moderating economic growth, and other macroeconomic factors
Chapter 4. Competitive Landscape
4.1. Market Share Analysis
4.1.1. Global High Sugar Jam Market Share by Company, 2023
4.1.2. Product Offerings of Leading High Sugar Jam Companies
4.2. Market Entropy
4.2.1. New Product Launches in the Industry
4.2.2. Mergers, Acquisitions, Joint ventures, and Partnerships
4.3. Key Strategies and Best Practices
Chapter 5. Global Market Projections: Best, Reference, and Low Case Scenarios
5.1. Growth Analysis- Case Scenario Definitions
5.2. Low Growth Case Scenario Forecasts
5.3. Reference Growth Case Scenario Forecasts
5.4. High Growth Case Scenario Forecasts
Chapter 6. Market Dynamics
6.1. High Sugar Jam Market Drivers
6.2. High Sugar Jam Market Challenges
6.6. High Sugar Jam Market Opportunities
6.4. High Sugar Jam Market Trends
Chapter 7. Global High Sugar Jam Market Outlook Trends
7.1. Global High Sugar Jam Revenue (USD Million) and CAGR (%) by Type (2021-2032)
7.2. Global High Sugar Jam Revenue (USD Million) and CAGR (%) by Application (2021-2032)
7.3. Global High Sugar Jam Revenue (USD Million) and CAGR (%) by Product (2021-2032)
By Type
Apple
Pear
Strawberry
Grape
Others
By Application
Dairy Industry
Baked Product Industry
Ice-Cream Industry
Others
Chapter 8. Global High Sugar Jam Regional Analysis and Outlook
8.1. Global High Sugar Jam Revenue (USD Million) By Regions (2021- 2032)
8.2. North America High Sugar Jam Revenue (USD Million) by Country (2021-2032)
8.2.1. United States High Sugar Jam Regional Analysis and Outlook
8.2.2. Canada High Sugar Jam Regional Analysis and Outlook
8.2.3. Mexico High Sugar Jam Regional Analysis and Outlook
8.3. Europe High Sugar Jam Revenue (USD Million), by Country (2021-2032)
8.3.1. Germany High Sugar Jam Regional Analysis and Outlook
8.3.2. France High Sugar Jam Regional Analysis and Outlook
8.3.3. United Kingdom High Sugar Jam Regional Analysis and Outlook
8.3.4. Spain High Sugar Jam Regional Analysis and Outlook
8.3.5. Italy High Sugar Jam Regional Analysis and Outlook
8.3.6. Russia High Sugar Jam Regional Analysis and Outlook
8.3.7. Rest of Europe High Sugar Jam Regional Analysis and Outlook
8.4. Asia Pacific High Sugar Jam Revenue (USD Million) by Country (2021-2032)
8.4.1. China High Sugar Jam Regional Analysis and Outlook
8.4.2. Japan High Sugar Jam Regional Analysis and Outlook
8.4.3. India High Sugar Jam Regional Analysis and Outlook
8.4.4. South Korea High Sugar Jam Regional Analysis and Outlook
8.4.5. Australia High Sugar Jam Regional Analysis and Outlook
8.4.6. South East Asia High Sugar Jam Regional Analysis and Outlook
8.4.7. Rest of Asia Pacific High Sugar Jam Regional Analysis and Outlook
8.5. South America High Sugar Jam Revenue (USD Million), by Country (2021-2032)
8.5.1. Brazil High Sugar Jam Regional Analysis and Outlook
8.5.2. Argentina High Sugar Jam Regional Analysis and Outlook
8.5.3. Rest of South America High Sugar Jam Regional Analysis and Outlook
8.6. Middle East and Africa High Sugar Jam Revenue (USD Million) by Country (2021-2032)
8.6.1. Middle East High Sugar Jam Regional Analysis and Outlook
8.6.2. Africa High Sugar Jam Regional Analysis and Outlook
Chapter 9. North America High Sugar Jam Analysis and Outlook
9.1. North America High Sugar Jam Revenue (USD Million) by Segments (2021-2032)
9.1.1. North America High Sugar Jam Revenue (USD Million) by Type (2021-2032)
9.1.2. North America High Sugar Jam Revenue (USD Million) by Application (2021-2032)
9.1.3. North America High Sugar Jam Revenue (USD Million) by Product (2021-2032)
By Type
Apple
Pear
Strawberry
Grape
Others
By Application
Dairy Industry
Baked Product Industry
Ice-Cream Industry
Others
Chapter 10. Europe High Sugar Jam Analysis and Outlook
10.1. Europe High Sugar Jam Revenue (USD Million), by Segments (USD Million) (2021-2032)
10.1.1. Europe High Sugar Jam Revenue (USD Million) by Type (2021-2032)
10.1.2. Europe High Sugar Jam Revenue (USD Million) by Application (2021-2032)
10.1.3. Europe High Sugar Jam Revenue (USD Million) by Product (2021-2032)
By Type
Apple
Pear
Strawberry
Grape
Others
By Application
Dairy Industry
Baked Product Industry
Ice-Cream Industry
Others
Chapter 11. Asia Pacific High Sugar Jam Analysis and Outlook
11.1. Asia Pacific High Sugar Jam Revenue (USD Million), and Revenue (USD Million) by Segments (2021-2032)
11.1.1. Asia Pacific High Sugar Jam Revenue (USD Million) by Type (2021-2032)
11.1.2. Asia Pacific High Sugar Jam Revenue (USD Million) by Application (2021-2032)
11.1.3. Asia Pacific High Sugar Jam Revenue (USD Million) by Product (2021-2032)
By Type
Apple
Pear
Strawberry
Grape
Others
By Application
Dairy Industry
Baked Product Industry
Ice-Cream Industry
Others
Chapter 12. South America High Sugar Jam Analysis and Outlook
12.1. South America High Sugar Jam Revenue (USD Million), by Segments (2021-2032)
12.1.1. South America High Sugar Jam Revenue (USD Million) by Type (2021-2032)
12.1.2. South America High Sugar Jam Revenue (USD Million) by Application (2021-2032)
12.1.3. South America High Sugar Jam Revenue (USD Million) by Product (2021-2032)
By Type
Apple
Pear
Strawberry
Grape
Others
By Application
Dairy Industry
Baked Product Industry
Ice-Cream Industry
Others
Chapter 13. Middle East and Africa High Sugar Jam Analysis and Outlook
13.1. Middle East and Africa High Sugar Jam Revenue (USD Million), by Segments (2021-2032)
13.1.1. Middle East and Africa High Sugar Jam Revenue (USD Million) by Type (2021-2032)
13.1.2. Middle East and Africa High Sugar Jam Revenue (USD Million) by Application (2021-2032)
13.1.3. Middle East and Africa High Sugar Jam Revenue (USD Million) by Product (2021-2032)
By Type
Apple
Pear
Strawberry
Grape
Others
By Application
Dairy Industry
Baked Product Industry
Ice-Cream Industry
Others
Chapter 14. High Sugar Jam Company Profiles
14.1 Business Overview
14.2 Product Profiles
14.3 SWOT Profiles
14.5 Recent Developments
14.6 Financial Profile
List of Companies
Agrana
Agrana
Andros France
BINA
Fourayes
Fresh Food Industries
Frulact
Hero
JM Smucker
Puratos
SVZ International
Tree Top
Valio
Zentis
Zuegg
15. Methodology and Data Sources
15.1 Customization Offerings
15.2 Subscription Services
15.3 Related Reports
15.4 Publisher Expertise
LIST OF TABLES
Table 1 Market Segmentation Analysis
Table 2 Global High Sugar Jam Market Share of Leading Companies, 2023
Table 3 Product Offerings of Leading Companies
Table 4 Low Growth Scenario Forecasts
Table 5 Reference Case Growth Scenario
Table 6 High Growth Case Scenario
Table 7 Global High Sugar Jam Revenue (USD Million) And CAGR (%) By Type (2021-2032)
Table 8 Global High Sugar Jam Revenue (USD Million) And CAGR (%) By Application (2021-2032)
Table 9 Global High Sugar Jam Revenue (USD Million) And CAGR (%) By Product (2021-2032)
Table 10 Global High Sugar Jam Market Revenue (USD Million) By Regions (2021-2032)
Table 11 Global High Sugar Jam Market Share (%) By Regions (2021-2032)
Table 12 North America High Sugar Jam Revenue (USD Million) By Country (2021-2032)
Table 13 Europe High Sugar Jam Revenue (USD Million) By Country (2021-2032)
Table 14 Asia Pacific High Sugar Jam Revenue (USD Million) By Country (2021-2032)
Table 15 South America High Sugar Jam Revenue (USD Million) By Country (2021-2032)
Table 16 Middle East and Africa High Sugar Jam Revenue (USD Million) By Region (2021-2032)
Table 17 North America High Sugar Jam Revenue (USD Million) By Type (2021-2032)
Table 18 North America High Sugar Jam Revenue (USD Million) By Application (2021-2032)
Table 19 North America High Sugar Jam Revenue (USD Million) By Product (2021-2032)
Table 20 Europe High Sugar Jam Revenue (USD Million) By Type (2021-2032)
Table 21 Europe High Sugar Jam Revenue (USD Million) By Application (2021-2032)
Table 22 Europe High Sugar Jam Revenue (USD Million) By Product (2021-2032)
Table 23 Asia Pacific High Sugar Jam Revenue (USD Million) By Type (2021-2032)
Table 24 Asia Pacific High Sugar Jam Revenue (USD Million) By Application (2021-2032)
Table 25 Asia Pacific High Sugar Jam Revenue (USD Million) By Product (2021-2032)
Table 26 South America High Sugar Jam Revenue (USD Million) By Type (2021-2032)
Table 27 South America High Sugar Jam Revenue (USD Million) By Application (2021-2032)
Table 28 South America High Sugar Jam Revenue (USD Million) By Product (2021-2032)
Table 29 Middle East and Africa High Sugar Jam Revenue (USD Million) By Type (2021-2032)
Table 30 Middle East and Africa High Sugar Jam Revenue (USD Million) By Application (2021-2032)
Table 31 Middle East and Africa High Sugar Jam Revenue (USD Million) By Product (2021-2032)
LIST OF FIGURES
Figure 1. Market Scope
Figure 2. Pricing Forecasts Per Unit, 2023- 2032
Figure 3. Porter’s Five Forces
Figure 4. Global High Sugar Jam Market Revenue (USD Million) By Regions (2021-2032)
Figure 5. Global High Sugar Jam Market Share (%) By Regions (2023)
Figure 6. North America High Sugar Jam Revenue (USD Million) By Country (2021-2032)
Figure 7. United States High Sugar Jam Revenue (USD Million) By Country (2021-2032)
Figure 8. Canada High Sugar Jam Revenue (USD Million) By Country (2021-2032)
Figure 9. Mexico High Sugar Jam Revenue (USD Million) By Country (2021-2032)
Figure 10. Europe High Sugar Jam Revenue (USD Million) By Country (2021-2032)
Figure 11. Germany High Sugar Jam Revenue (USD Million) By Country (2021-2032)
Figure 12. France High Sugar Jam Revenue (USD Million) By Country (2021-2032)
Figure 13. United Kingdom High Sugar Jam Revenue (USD Million) By Country (2021-2032)
Figure 14. Spain High Sugar Jam Revenue (USD Million) By Country (2021-2032)
Figure 15. Italy High Sugar Jam Revenue (USD Million) By Country (2021-2032)
Figure 16. Russia High Sugar Jam Revenue (USD Million) By Country (2021-2032)
Figure 17. Rest of Europe High Sugar Jam Revenue (USD Million) By Country (2021-2032)
Figure 11. Asia Pacific High Sugar Jam Revenue (USD Million) By Country (2021-2032)
Figure 12. China High Sugar Jam Revenue (USD Million) By Country (2021-2032)
Figure 13. Japan High Sugar Jam Revenue (USD Million) By Country (2021-2032)
Figure 14. India High Sugar Jam Revenue (USD Million) By Country (2021-2032)
Figure 15. South Korea High Sugar Jam Revenue (USD Million) By Country (2021-2032)
Figure 16. Australia High Sugar Jam Revenue (USD Million) By Country (2021-2032)
Figure 17. South East Asia High Sugar Jam Revenue (USD Million) By Country (2021-2032)
Figure 18. South America High Sugar Jam Revenue (USD Million) By Country (2021-2032)
Figure 19. Brazil High Sugar Jam Revenue (USD Million) By Country (2021-2032)
Figure 20. Argentina High Sugar Jam Revenue (USD Million) By Country (2021-2032)
Figure 21. Rest of Asia Pacific High Sugar Jam Revenue (USD Million) By Country (2021-2032)
Figure 22. Middle East and Africa High Sugar Jam Revenue (USD Million) By Region (2021-2032)
Figure 23. Saudi Arabia High Sugar Jam Revenue (USD Million) By Region (2021-2032)
Figure 24. The UAE High Sugar Jam Revenue (USD Million) By Region (2021-2032)
Figure 25. Rest of Middle East High Sugar Jam Revenue (USD Million) By Region (2021-2032)
Figure 26. South Africa High Sugar Jam Revenue (USD Million) By Region (2021-2032)
Figure 27. Africa High Sugar Jam Revenue (USD Million) By Region (2021-2032)
Figure 28. North America High Sugar Jam Revenue (USD Million) By Type (2021-2032)
Figure 29. North America High Sugar Jam Revenue (USD Million) By Application (2021-2032)
Figure 30. North America High Sugar Jam Revenue (USD Million) By Product (2021-2032)
Figure 31. Europe High Sugar Jam Revenue (USD Million) By Type (2021-2032)
Figure 32. Europe High Sugar Jam Revenue (USD Million) By Application (2021-2032)
Figure 33. Europe High Sugar Jam Revenue (USD Million) By Product (2021-2032)
Figure 34. Asia Pacific High Sugar Jam Revenue (USD Million) By Type (2021-2032)
Figure 35. Asia Pacific High Sugar Jam Revenue (USD Million) By Application (2021-2032)
Figure 36. Asia Pacific High Sugar Jam Revenue (USD Million) By Product (2021-2032)
Figure 37. South America High Sugar Jam Revenue (USD Million) By Type (2021-2032)
Figure 38. South America High Sugar Jam Revenue (USD Million) By Application (2021-2032)
Figure 39. South America High Sugar Jam Revenue (USD Million) By Product (2021-2032)
Figure 40. Middle East and Africa High Sugar Jam Revenue (USD Million) By Type (2021-2032)
Figure 41. Middle East and Africa High Sugar Jam Revenue (USD Million) By Application (2021-2032)
Figure 42. Middle East and Africa High Sugar Jam Revenue (USD Million) By Product (2021-2032)
By Type
Apple
Pear
Strawberry
Grape
Others
By Application
Dairy Industry
Baked Product Industry
Ice-Cream Industry
Others
Countries Analyzed
North America (US, Canada, Mexico)
Europe (Germany, UK, France, Spain, Italy, Russia, Rest of Europe)
Asia Pacific (China, India, Japan, South Korea, Australia, South East Asia, Rest of Asia)
South America (Brazil, Argentina, Rest of South America)
Middle East and Africa (Saudi Arabia, UAE, Rest of Middle East, South Africa, Egypt, Rest of Africa)
