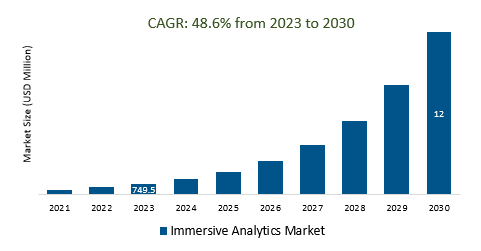
According to USD Analytics the Global Immersive Analytics Market is expected to reach US $ 12 billion in 2032 from US 749.5 Million in 2024, at a CAGR of 48.6%.
The market growth is driven by increasing IoT and sensor technologies, there was a demand for real-time data analysis and visualization in 3D environments. Immersive analytics was being used for monitoring and managing complex systems in real-time. Leading Companies focusing on Wider Adoption in Industries, Healthcare and Life Sciences, Enhanced Data Collaboration, Customization for Specific Use Cases, Security and Privacy Enhancements, Advancements in Hardware, and others to boost market shares in the industry.
Market Overview
The Immersive Analytics market is a sector within data analytics that utilizes immersive technologies like virtual reality (VR) and augmented reality (AR) to create interactive 3D data visualizations. It offers a more intuitive approach to understanding complex data, aids data-driven decision-making, and supports remote collaboration. Challenges include cost, data security, and technology adoption barriers. The future scope appears promising, with potential applications in various industries, customization, AI integration, and strengthened data security measures.
Market Dynamics
Market Trends - AI and ML Boost Immersive Analytics Capabilities
The Immersive Analytics market is witnessing a significant transformation as artificial intelligence (AI) and machine learning (ML) technologies increasingly integrate with immersive analytics, enhancing its capabilities. AI and ML bring predictive and real-time analysis to the forefront of immersive data visualization, allowing users to gain deeper insights and make data-driven decisions more effectively. These technologies enable intelligent pattern recognition and anomaly detection within immersive data environments, making it easier to identify critical trends and outliers.
Market Driver- Hardware and Software Development Drives Immersive Analytics Market Growth
The Immersive Analytics market is experiencing substantial growth driven by advancements in hardware and software development. More powerful hardware, such as GPUs and VR/AR devices, has made immersive analytics technology more accessible and improved the user experience. Simultaneously, sophisticated software tools enable the creation of 3D data visualizations, expanding the market's reach across various industries. As development in both hardware and software continues, Immersive Analytics is poised to grow further and offer enhanced data visualization and analysis capabilities.
Market Opportunity- Immersive Analytics Revolutionizes Healthcare and Medical Imaging
Immersive Analytics is revolutionizing healthcare and medical imaging by utilizing VR and AR technologies to provide medical professionals with 3D data visualization tools. This technology improves medical image interpretation, enhances research capabilities, and facilitates patient communication, ultimately leading to more accurate diagnoses and treatment plans. Its adoption is reshaping the healthcare sector, offering better data analysis and visualization in medical applications, which holds promise for improving patient outcomes and advancing medical research.
The Global Immersive Analytics Market is analyzed across Hardware, Headsets, Displays, Sensors and Controllers, Other Hardware, Solutions, Services, and others. Solutions are poised to register the fastest growth. Solutions in the Immersive Analytics market encompass hardware and software offerings, data integration tools, AI and ML integration, security measures, industry-specific solutions, remote collaboration platforms, and educational applications. These solutions aim to provide users with immersive experiences for data visualization, catering to a variety of industries and needs, from healthcare and manufacturing to gaming and consumer applications, with a strong focus on enhancing data security, accessibility, and industry-specific customization.
Market Share Analysis- Education and Training held a significant market share in 2025
The Global Property Management System (PMS) Market is analyzed across various applications including Education and Training, Sales and Marketing, Design and Visualization, Strategy Planning, and others. Of these, Education and Training held a significant market share in 2025. Education and training for the Immersive Analytics Market encompass academic programs, certifications, online courses, workshops, and in-house training initiatives, ensuring students and professionals gain the necessary skills to use immersive analytics tools effectively. These educational efforts are often supplemented by user documentation, community forums, and research and development collaborations. They play a pivotal role in fostering innovation and ensuring the growth and maturity of the Immersive Analytics market while empowering individuals to harness immersive technologies for data analysis and decision-making.
Immersive Analytics Market Segmentation
By Type
Hardware
- Headsets
- Displays
- Sensors and Controllers
- Other Hardware
- Solutions
- Services
By Application
- Education and Training
- Sales and Marketing
- Design and Visualization
- Strategy Planning
- Others
By End-User
- Media and Entertainment
- Healthcare
- Automotive and Transportation
- Buidling and Construction
- Government and Defense
- Others
By Region
- North America (United States, Canada, Mexico)
- Europe (Germany, France, United Kingdom, Spain, Italy, Others)
- Asia Pacific (China, India, Japan, South Korea, Australia, Others)
- Latin America (Brazil, Argentina, Others)
- Middle East and Africa (Saudi Arabia, UAE, Kuwait, Other Middle East, South Africa, Nigeria, Other Africa)
Immersive Analytics Market Companies
- International Business Machines Corporation
- Microsoft Corporation
- Google LLC
- HTC Corporation
- Meta Platforms, Inc.
- TIBCO Software Inc.
- Hewlett Packard Enterprise Company
- Magic Leap, Inc.
- SAP SE
- Accenture plc
- Tableau Software LLC
*List not exhaustive
Immersive Analytics Market Outlook 2025
1 Market Overview
1.1 Introduction to the Immersive Analytics Market
1.2 Scope of the Study
1.3 Research Objective
1.3.1 Key Market Scope and Segments
1.3.2 Players Covered
1.3.3 Years Considered
2 Executive Summary
2.1 2023 Immersive Analytics Industry- Market Statistics
3 Market Dynamics
3.1 Market Drivers
3.2 Market Challenges
3.3 Market Opportunities
3.4 Market Trends
4 Market Factor Analysis
4.1 Porter’s Five Forces
4.2 Market Entropy
4.2.1 Global Immersive Analytics Market Companies with Area Served
4.2.2 Products Offerings Global Immersive Analytics Market
5 COVID-19 Impact Analysis and Outlook Scenarios
5.1.1 Covid-19 Impact Analysis
5.1.2 post-COVID-19 Scenario- Low Growth Case
5.1.3 post-COVID-19 Scenario- Reference Growth Case
5.1.4 post-COVID-19 Scenario- Low Growth Case
6 Global Immersive Analytics Market Trends
6.1 Global Immersive Analytics Revenue (USD Million) and CAGR (%) by Type (2018-2030)
6.2 Global Immersive Analytics Revenue (USD Million) and CAGR (%) by Applications (2018-2030)
6.3 Global Immersive Analytics Revenue (USD Million) and CAGR (%) by regions (2018-2030)
7 Global Immersive Analytics Market Revenue (USD Million) by Type, and Applications (2019-2024)
7.1 Global Immersive Analytics Revenue (USD Million) by Type (2019-2024)
7.1.1 Global Immersive Analytics Revenue (USD Million), Market Share (%) by Type (2019-2024)
7.2 Global Immersive Analytics Revenue (USD Million) by Applications (2019-2024)
7.2.1 Global Immersive Analytics Revenue (USD Million), Market Share (%) by Applications (2019-2024)
8 Global Immersive Analytics Development Regional Status and Outlook
8.1 Global Immersive Analytics Revenue (USD Million) By Regions (2019-2024)
8.2 North America Immersive Analytics Revenue (USD Million) by Type, and Application (2019-2024)
8.2.1 North America Immersive Analytics Revenue (USD Million) by Country (2019-2024)
8.2.2 North America Immersive Analytics Revenue (USD Million) by Type (2019-2024)
8.2.3 North America Immersive Analytics Revenue (USD Million) by Applications (2019-2024)
8.3 Europe Immersive Analytics Revenue (USD Million), by Type, and Applications (USD Million) (2019-2024)
8.3.1 Europe Immersive Analytics Revenue (USD Million), by Country (2019-2024)
8.3.2 Europe Immersive Analytics Revenue (USD Million) by Type (2019-2024)
8.3.3 Europe Immersive Analytics Revenue (USD Million) by Applications (2019-2024)
8.4 Asia Pacific Immersive Analytics Revenue (USD Million), and Revenue (USD Million) by Type, and Applications (2019-2024)
8.4.1 Asia Pacific Immersive Analytics Revenue (USD Million) by Country (2019-2024)
8.4.2 Asia Pacific Immersive Analytics Revenue (USD Million) by Type (2019-2024)
8.4.3 Asia Pacific Immersive Analytics Revenue (USD Million) by Applications (2019-2024)
8.5 South America Immersive Analytics Revenue (USD Million), by Type, and Applications (2019-2024)
8.5.1 South America Immersive Analytics Revenue (USD Million), by Country (2019-2024)
8.5.2 South America Immersive Analytics Revenue (USD Million) by Type (2019-2024)
8.5.3 South America Immersive Analytics Revenue (USD Million) by Applications (2019-2024)
8.6 Middle East and Africa Immersive Analytics Revenue (USD Million), by Type, Technology, Application, Thickness (2019-2024)
8.6.1 Middle East and Africa Immersive Analytics Revenue (USD Million) by Country (2019-2024)
8.6.2 Middle East and Africa Immersive Analytics Revenue (USD Million) by Type (2019-2024)
8.6.3 Middle East and Africa Immersive Analytics Revenue (USD Million) by Applications (2019-2024)
9 Company Profiles
10 Global Immersive Analytics Market Revenue (USD Million), by Type, and Applications (2025-2034)
10.1 Global Immersive Analytics Revenue (USD Million) and Market Share (%) by Type (2025-2034)
10.1.1 Global Immersive Analytics Revenue (USD Million), and Market Share (%) by Type (2025-2034)
10.2 Global Immersive Analytics Revenue (USD Million) and Market Share (%) by Applications (2025-2034)
10.2.1 Global Immersive Analytics Revenue (USD Million), and Market Share (%) by Applications (2025-2034)
11 Global Immersive Analytics Development Regional Status and Outlook Forecast
11.1 Global Immersive Analytics Revenue (USD Million) By Regions (2025-2034)
11.2 North America Immersive Analytics Revenue (USD Million) by Type, and Applications (2025-2034)
11.2.1 North America Immersive Analytics Revenue (USD) Million by Country (2025-2034)
11.2.2 North America Immersive Analytics Revenue (USD Million), by Type (2025-2034)
11.2.3 North America Immersive Analytics Revenue (USD Million), Market Share (%) by Applications (2025-2034)
11.3 Europe Immersive Analytics Revenue (USD Million), by Type, and Applications (2025-2034)
11.3.1 Europe Immersive Analytics Revenue (USD Million), by Country (2025-2034)
11.3.2 Europe Immersive Analytics Revenue (USD Million), by Type (2025-2034)
11.3.3 Europe Immersive Analytics Revenue (USD Million), by Applications (2025-2034)
11.4 Asia Pacific Immersive Analytics Revenue (USD Million) by Type, and Applications (2025-2034)
11.4.1 Asia Pacific Immersive Analytics Revenue (USD Million), by Country (2025-2034)
11.4.2 Asia Pacific Immersive Analytics Revenue (USD Million), by Type (2025-2034)
11.4.3 Asia Pacific Immersive Analytics Revenue (USD Million), by Applications (2025-2034)
11.5 South America Immersive Analytics Revenue (USD Million), by Type, and Applications (2025-2034)
11.5.1 South America Immersive Analytics Revenue (USD Million), by Country (2025-2034)
11.5.2 South America Immersive Analytics Revenue (USD Million), by Type (2025-2034)
11.5.3 South America Immersive Analytics Revenue (USD Million), by Applications (2025-2034)
11.6 Middle East and Africa Immersive Analytics Revenue (USD Million), by Type, and Applications (2025-2034)
11.6.1 Middle East and Africa Immersive Analytics Revenue (USD Million), by region (2025-2034)
11.6.2 Middle East and Africa Immersive Analytics Revenue (USD Million), by Type (2025-2034)
11.6.3 Middle East and Africa Immersive Analytics Revenue (USD Million), by Applications (2025-2034)
12 Methodology and Data Sources
12.1 Methodology/Research Approach
12.1.1 Research Programs/Design
12.1.2 Market Size Estimation
12.1.3 Market Breakdown and Data Triangulation
12.2 Data Sources
12.2.1 Secondary Sources
12.2.2 Primary Sources
12.3 Disclaimer
List of Tables
Table 1 Market Segmentation Analysis
Table 2 Global Immersive Analytics Market Companies with Areas Served
Table 3 Products Offerings Global Immersive Analytics Market
Table 4 Low Growth Scenario Forecasts
Table 5 Reference Case Growth Scenario
Table 6 High Growth Case Scenario
Table 7 Global Immersive Analytics Revenue (USD Million) And CAGR (%) By Type (2018-2030)
Table 8 Global Immersive Analytics Revenue (USD Million) And CAGR (%) By Applications (2018-2030)
Table 9 Global Immersive Analytics Revenue (USD Million) And CAGR (%) By Regions (2018-2030)
Table 10 Global Immersive Analytics Revenue (USD Million) By Type (2019-2024)
Table 11 Global Immersive Analytics Revenue Market Share (%) By Type (2019-2024)
Table 12 Global Immersive Analytics Revenue (USD Million) By Applications (2019-2024)
Table 13 Global Immersive Analytics Revenue Market Share (%) By Applications (2019-2024)
Table 14 Global Immersive Analytics Market Revenue (USD Million) By Regions (2019-2024)
Table 15 Global Immersive Analytics Market Share (%) By Regions (2019-2024)
Table 16 North America Immersive Analytics Revenue (USD Million) By Country (2019-2024)
Table 17 North America Immersive Analytics Revenue (USD Million) By Type (2019-2024)
Table 18 North America Immersive Analytics Revenue (USD Million) By Applications (2019-2024)
Table 19 Europe Immersive Analytics Revenue (USD Million) By Country (2019-2024)
Table 20 Europe Immersive Analytics Revenue (USD Million) By Type (2019-2024)
Table 21 Europe Immersive Analytics Revenue (USD Million) By Applications (2019-2024)
Table 22 Asia Pacific Immersive Analytics Revenue (USD Million) By Country (2019-2024)
Table 23 Asia Pacific Immersive Analytics Revenue (USD Million) By Type (2019-2024)
Table 24 Asia Pacific Immersive Analytics Revenue (USD Million) By Applications (2019-2024)
Table 25 South America Immersive Analytics Revenue (USD Million) By Country (2019-2024)
Table 26 South America Immersive Analytics Revenue (USD Million) By Type (2019-2024)
Table 27 South America Immersive Analytics Revenue (USD Million) By Applications (2019-2024)
Table 28 Middle East and Africa Immersive Analytics Revenue (USD Million) By Region (2019-2024)
Table 29 Middle East and Africa Immersive Analytics Revenue (USD Million) By Type (2019-2024)
Table 30 Middle East and Africa Immersive Analytics Revenue (USD Million) By Applications (2019-2024)
Table 31 Financial Analysis
Table 32 Global Immersive Analytics Revenue (USD Million) By Type (2025-2034)
Table 33 Global Immersive Analytics Revenue Market Share (%) By Type (2025-2034)
Table 34 Global Immersive Analytics Revenue (USD Million) By Applications (2025-2034)
Table 35 Global Immersive Analytics Revenue Market Share (%) By Applications (2025-2034)
Table 36 Global Immersive Analytics Market Revenue (USD Million), And Revenue (USD Million) By Regions (2025-2034)
Table 37 North America Immersive Analytics Revenue (USD)By Country (2025-2034)
Table 38 North America Immersive Analytics Revenue (USD Million) By Type (2025-2034)
Table 39 North America Immersive Analytics Revenue (USD Million) By Applications (2025-2034)
Table 40 Europe Immersive Analytics Revenue (USD Million) By Country (2025-2034)
Table 41 Europe Immersive Analytics Revenue (USD Million) By Type (2025-2034)
Table 42 Europe Immersive Analytics Revenue (USD Million) By Applications (2025-2034)
Table 43 Asia Pacific Immersive Analytics Revenue (USD Million) By Country (2025-2034)
Table 44 Asia Pacific Immersive Analytics Revenue (USD Million) By Type (2025-2034)
Table 45 Asia Pacific Immersive Analytics Revenue (USD Million) By Applications (2025-2034)
Table 46 South America Immersive Analytics Revenue (USD Million) By Country (2025-2034)
Table 47 South America Immersive Analytics Revenue (USD Million) By Type (2025-2034)
Table 48 South America Immersive Analytics Revenue (USD Million) By Applications (2025-2034)
Table 49 Middle East and Africa Immersive Analytics Revenue (USD Million) By Region (2025-2034)
Table 50 Middle East and Africa Immersive Analytics Revenue (USD Million) By Region (2025-2034)
Table 51 Middle East and Africa Immersive Analytics Revenue (USD Million) By Type (2025-2034)
Table 52 Middle East and Africa Immersive Analytics Revenue (USD Million) By Applications (2025-2034)
Table 53 Research Programs/Design for This Report
Table 54 Key Data Information from Secondary Sources
Table 55 Key Data Information from Primary Sources
List of Figures
Figure 1 Market Scope
Figure 2 Porter’s Five Forces
Figure 3 Global Immersive Analytics Revenue (USD Million) By Type (2019-2024)
Figure 4 Global Immersive Analytics Revenue Market Share (%) By Type (2022)
Figure 5 Global Immersive Analytics Revenue (USD Million) By Applications (2019-2024)
Figure 6 Global Immersive Analytics Revenue Market Share (%) By Applications (2022)
Figure 7 Global Immersive Analytics Market Revenue (USD Million) By Regions (2019-2024)
Figure 8 Global Immersive Analytics Market Share (%) By Regions (2022)
Figure 9 North America Immersive Analytics Revenue (USD Million) By Country (2019-2024)
Figure 10 North America Immersive Analytics Revenue (USD Million) By Type (2019-2024)
Figure 11 North America Immersive Analytics Revenue (USD Million) By Applications (2019-2024)
Figure 12 Europe Immersive Analytics Revenue (USD Million) By Country (2019-2024)
Figure 13 Europe Immersive Analytics Revenue (USD Million) By Type (2019-2024)
Figure 14 Europe Immersive Analytics Revenue (USD Million) By Applications (2019-2024)
Figure 15 Asia Pacific Immersive Analytics Revenue (USD Million) By Country (2019-2024)
Figure 16 Asia Pacific Immersive Analytics Revenue (USD Million) By Type (2019-2024)
Figure 17 Asia Pacific Immersive Analytics Revenue (USD Million) By Applications (2019-2024)
Figure 18 South America Immersive Analytics Revenue (USD Million) By Country (2019-2024)
Figure 19 South America Immersive Analytics Revenue (USD Million) By Type (2019-2024)
Figure 20 South America Immersive Analytics Revenue (USD Million) By Applications (2019-2024)
Figure 21 Middle East and Africa Immersive Analytics Revenue (USD Million) By Region (2019-2024)
Figure 22 Middle East and Africa Immersive Analytics Revenue (USD Million) By Type (2019-2024)
Figure 23 Middle East and Africa Immersive Analytics Revenue (USD Million) By Applications (2019-2024)
Figure 24 Global Immersive Analytics Revenue (USD Million) By Type (2025-2034)
Figure 25 Global Immersive Analytics Revenue Market Share (%) By Type (2030)
Figure 26 Global Immersive Analytics Revenue (USD Million) By Applications (2025-2034)
Figure 27 Global Immersive Analytics Revenue Market Share (%) By Applications (2030)
Figure 28 Global Immersive Analytics Market Revenue (USD Million) By Regions (2025-2034)
Figure 29 North America Immersive Analytics Revenue (USD Million) By Country (2025-2034)
Figure 30 North America Immersive Analytics Revenue (USD Million) By Type (2025-2034)
Figure 31 North America Immersive Analytics Revenue (USD Million) By Applications (2025-2034)
Figure 32 Europe Immersive Analytics Revenue (USD Million) By Country (2025-2034)
Figure 33 Europe Immersive Analytics Revenue (USD Million) By Type (2025-2034)
Figure 34 Europe Immersive Analytics Revenue (USD Million) By Applications (2025-2034)
Figure 35 Asia Pacific Immersive Analytics Revenue (USD Million) By Country (2025-2034)
Figure 36 Asia Pacific Immersive Analytics Revenue (USD Million) By Type (2025-2034)
Figure 37 Asia Pacific Immersive Analytics Revenue (USD Million) By Applications (2025-2034)
Figure 38 South America Immersive Analytics Revenue (USD Million) By Country (2025-2034)
Figure 39 South America Immersive Analytics Revenue (USD Million) By Type (2025-2034)
Figure 40 South America Immersive Analytics Revenue (USD Million) By Applications (2025-2034)
Figure 41 Middle East and Africa Immersive Analytics Revenue (USD Million) By Region (2025-2034)
Figure 42 Middle East and Africa Immersive Analytics Revenue (USD Million) By Region (2025-2034)
Figure 43 Middle East and Africa Immersive Analytics Revenue (USD Million) By Type (2025-2034)
Figure 44 Middle East and Africa Immersive Analytics Revenue (USD Million) By Applications (2025-2034)
Figure 45 Bottom-Up and Top-Down Approaches for This Report
Figure 46 Data Triangulation
